Dynamic scaling of Y-axis in custom indicator?
- It does that now. If you don't specify a min and max, that is what you get. Top of the window is the maximum visible, ...
- Your problem is the "+/-<a very large number>" I'd scale it, perhaps
V LOG10(ABS(v))*SIGN(v) ATAN(v) * 100 / M_PI_2 -1000 -3.00000 -99.93642 -100 -2.00000 -99.36349 -10 -1.00000 -93.65498 -3 -0.47712 -79.51679 -1 0.00000 -50.00004 0 Err:502 0.00000 0.01 -2.00000 0.63660 0.5 -0.30103 29.51675 1 0.00000 50.00004 2 0.30103 70.48334 3 0.47712 79.51679 10 1.00000 93.65498 100 2.00000 99.36349 1000 3.00000 99.93642 double scale1(double v){ double s=v > 0 ? +1 : -1; double a=MathAbs(v); return a < 1 ? 0 : MathLog10(a) * s; } double scale2(double v){ return MathArctan(v) * 100 / M_PI_2; }
WHRoeder,
1. Yes, you are right.
2. Very smart solution, but I'm not sure if that solves my particular problem. (Well, I'm sure it does, but I was thinking of a different approach).
This is what I have come up with:
Find the value of WindowFirstVisibleBar
Find the value of WindowBarsPerChart
set minY and maxY = 0
Loop from WindowFirstVisibleBar to WindowBarsPerChart
check if value of indicator(for this bar number) is less than minY and if so, set minY to current value
(and vice versa for maxY)
End Loop
set WindowPriceMax() = maxY
set WindowPriceMin() = minY
I think it would work, but it's not very elegant. I'd have to loop over a number of bars every time I move the chart sideways.
And I would want it to change the scale for every time I move the chart. So I'm looking at OnChartEvent (CHARTEVENT_OBJECT_DRAG ?).
Please correct me if this path is wrong.
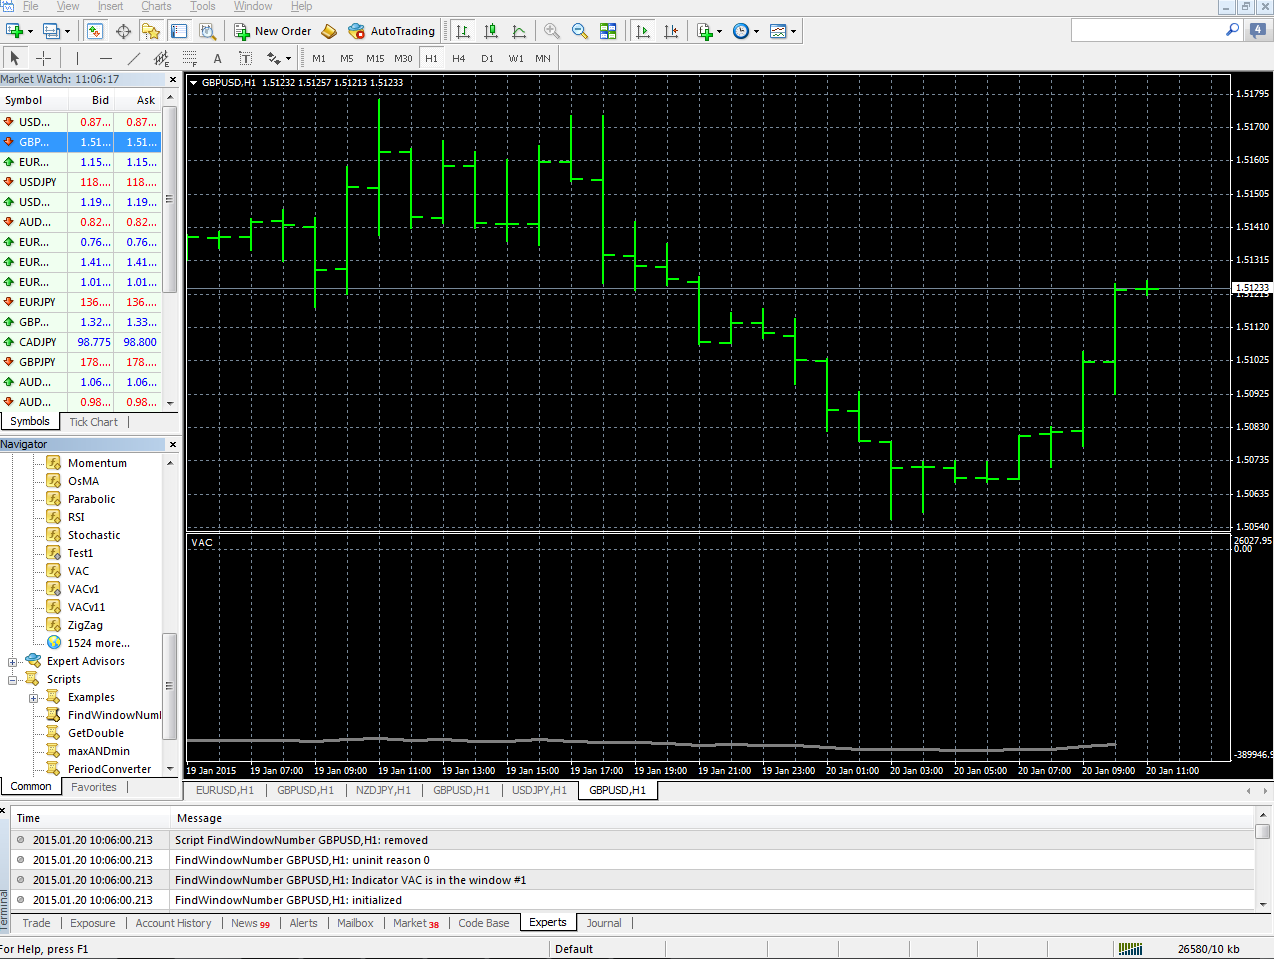
I've attached a picture.

You shouldn't need to loop through all the visible bars
This is a script to get the max and min visible values of the RSI, you should be able to adapt it to get the values of a buffer
void OnStart()
  {
  int checkbars,_start;
  double rsi[];
  ArrayResize(rsi,Bars);
  for (int x=0;x<Bars;x++)
     {
     rsi[x]=iRSI(Symbol(),0,14,0,x);
     }
  int left=WindowFirstVisibleBar();
  int chart_bars=WindowBarsPerChart();
  if(chart_bars>left)
     {
     checkbars=left;
     _start=0;
     }
  else
     {
     checkbars=chart_bars;
     _start=left-chart_bars;
     }

  int index_max=ArrayMaximum(rsi,checkbars,_start);
  string max=DoubleToStr(rsi[index_max],2);
  int index_min=ArrayMinimum(rsi,checkbars,_start);
  string min=DoubleToStr(rsi[index_min],2);
  Print("Max="+max+", Min="+min);
  }
//+------------------------------------------------------------------+
set WindowPriceMax() = maxY
This retrieves the value
I think that you will need to use ChartSetDouble
Try CHARTEVENT_CHART_CHANGE
You shouldn't need to loop through all the visible bars
This is a script to get the max and min visible values of the RSI, you should be able to adapt it to get the values of a buffer
This retrieves the value
I think that you will need to use ChartSetDouble
Try CHARTEVENT_CHART_CHANGE
GumRai.
Thanks. I am now able to read Max and Min of the indicator pertaining to the visible bars thanks to ArrayMaximum and ArrayMinimum.
But I have big problems SETTING the value.
The indicator is clearly attached to subwindow 1 (see picture).
But when I try to SET the the value (through ChartSetDouble(1,CHART_FIXED_MIN,5000) ) I get,
2015.01.20 10:07:26.406 Script SETmaxANDmin GBPUSD,H1: removed
2015.01.20 10:07:26.406 SETmaxANDmin GBPUSD,H1: uninit reason 0
2015.01.20 10:07:26.406 SETmaxANDmin GBPUSD,H1: ChartFixedMinSet, Error Code = 4051
2015.01.20 10:07:26.406 SETmaxANDmin GBPUSD,H1: ID: 1
...indicating that the chart id is wrong (it will return ok if I change 1 to 0). However, nothing happens with the vertical scale, but that's a different problem.
I want to change the scale of my indicator window (subwindow 1).
Any ideas?
P.S. I used a different script in the attached picture but that makes no difference. The subwindow is #1 anyhow.
P.P.S. I have now tried to enclose the code in code tags but no success...
void OnStart()
{
PrintMaxAndMin();
int chart_no = 1;
ChartFixedMinSet(5000,chart_no);
}
//+------------------------------------------------------------------+
bool ChartFixedMinSet(const double value,int chart_ID=1)
{
Print("ID: ",chart_ID);
//--- reset the error value
ResetLastError();
//--- set property value
if(!ChartSetDouble(chart_ID,CHART_FIXED_MIN,value))
{
//--- display the error message in Experts journal
Print(__FUNCTION__+", Error Code = ",GetLastError());
return(false);
}
//--- successful execution
return(true);
}
void PrintMaxAndMin()
{
int windows=ChartGetInteger(0,CHART_WINDOWS_TOTAL);
Print("CHART_WINDOWS_TOTAL = ",windows);
if(windows>1)
{
for(int i=0;i<windows;i++)
{
double priceMin=ChartGetDouble(0,CHART_PRICE_MIN,i);
double priceMax=ChartGetDouble(0,CHART_PRICE_MAX,i);
Print(i+": CHART_PRICE_MIN = ",priceMin);
Print(i+": CHART_PRICE_MAX = ",priceMax);
}
}
}
Sorry, I steered you a bit wrong there.
IndicatorSetDouble(INDICATOR_MAXIMUM,your maximum value);
IndicatorSetDouble(INDICATOR_MINIMUM,your minimum value);
which has to be incorporated in your indicator
- Free trading apps
- Over 8,000 signals for copying
- Economic news for exploring financial markets
You agree to website policy and terms of use
Hi!
I have an indicator that can run from +<a very large nubmer> to -<a very large number>. The problem with this is that after a while the indicator becomes compressed and very hard to read.
Is there a neat way to make the y axis scale according to the current bars showing in window (also including scrolling backwards, and not only the last X bars).
I have searched a lot, but couldn't find a good solution.
Thanks.