Something Interesting in Financial Video November 2013 - page 3
You are missing trading opportunities:
- Free trading apps
- Over 8,000 signals for copying
- Economic news for exploring financial markets
Registration
Log in
You agree to website policy and terms of use
If you do not have an account, please register
Technical Analysis Tutorial Candlesticks (it is the lesson + practics for the about 2 hours)
We wish to guide you through the fundamentals of technical analysis. In this first class, You will learn what really matters to get the basics of your technical understanding . This class will cover candlestick analysis, trend lines, and support and resistance. You will learn how not to be shaken on a shakeout and how not the be fooled by a false breakout. This is the basics but we go a little beyond the basics into things that many more experienced traders tend to miss. In the future we will progress with more advanced classes in this series covering everything all the way up to importing formulas into your charting package, Elliot wave analysis, and point and figure analysis. But it all starts with this class. Hope you enjoy it , we worked very hard on this class.
Through the control offered by the exchanges, and government regulation, trading in the commodities markets does offer some limited protection from manipulation. The use of prudent orders does also offer some protection from loss.
The Short Futures Position
This simply means taking a short position in the hope that the futures price will go down. There is nothing to borrow and return when you take a short position since delivery, if it ever takes place, doesn't become an issue until some time in the future.
Limit and Stop-Loss Orders
"Limit orders" are common in the futures markets. In such cases, the customer instructs the broker to buy or sell only if the price of the contract he is holding, or wishes to hold, reaches a certain point. Limit orders are usually considered good only during a specific trading session, but they may also be marked "G.T.C." good till canceled.
Maximum Daily Price Moves
Sometimes futures prices in certain markets will move sharply in one direction or the other following very important news extremely bad weather in a growing area or a political upheaval, for instance. To provide for more orderly markets, the exchanges have definite daily trading limits on most contracts.
Most futures exchanges use formulas to increase a contract's daily trading limit if that limit has been reached for a specific number of consecutive trading days. Also. in some markets, trading limits are removed prior to expiration of the nearby futures contract. For other contracts, including stock index and foreign currency futures, no trading limits exist.
The Commodity Exchange Act
Trading in futures is regulated by the Commodity Futures Trading Commission, an independent agency of the United States government. The CFTC administers and enforces the Commodity Exchange Act.
Forum
Libraries: MQL5 Wizard - Candlestick Patterns Class
newdigital, 2013.09.10 15:21
Just some basic for traders -
Candlestick Basics
Candlestick charts are an effective way of visualizing price movements. There are two basic candlesticks:
Candlestick Parts
There are three main parts to a candlestick:
- Lower Shadow: The vertical line between the low of the day and the open (bullish candle) or close (bearish candle)
Candlestick PatternsThe power of Candlestick Charts is with multiple candlesticks forming reversal and continuation patterns:
Forum
Libraries: MQL5 Wizard - Candlestick Patterns Class
newdigital, 2013.09.10 19:03
Real Body and Upper and Lower Shadows
The rectangular area between the opening and the close of a session of trading is called the real body. The thin lines that look like candle wicks above and below the real body are called shadows. The shadow above the real body is called the upper shadow, the top end of the upper shadow corresponding to the high of the session of trading, and the shadow below the real body is called the lower shadow, where the bottom end of the lower shadow corresponds to the low of the session of trading.
Bullish CandlestickWhen discussing trading sessions based on a trading day (morning to afternoon), generally speaking the two most significant times of the trading day are the opening and the close. The opening and the close create the real body of the candlestick; hence, the most important part of a candlestick is the real body. By looking at a candlestick, a person can quickly tell whether traders were eagerly buying throughout the day (bulls were in charge for the trading day) - the candlestick is green, or whether traders were eagerly selling throughout the day (bears dominated the trading day) - the candlestick is red. By looking at the size of the real body of the candlestick, a trader can tell if the bulls were significantly in charge of the trading day (a tall green candlestick) or only moderately in charge of the trading day (a small green candlestick). Similarly, if a trader sees a large red candle, he or she can assume that the selling pressure of the bears overpowered the bulls for the day; however, if the candlestick is very small and red, then the trader can see that the bears were only slightly more powerful that day than the bulls. In summary, the real body of a candlestick can summarize the outcome of a period of trading in an easy to see way – green = bulls win the trading session, red = bears win the trading session; and the height of the candle equals the margin of victory for the bulls or the bears.
Steve Nison (1994) states that “for a [bullish] candle to have meaning, some Japanese candlestick traders believe that the real body should be at least three times as long as the previous day’s real body.” (p. 20). Roads (2008) suggests the following: “determine the area covered by the difference between the close and the open. If it’s at least 90 percent of the area covered by the difference between the high and low, you have a long white candle” (p. 76). An example of a computer charting package’s definition is: “Its Close price is higher than the Open price; Its body is longer than each shadow; Its body is longer than the average body size calculated for the specified number of preceding candles” (ThinkorSwim, 2011).
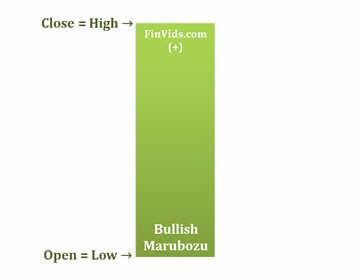
Bullish MarubozuThere are specific versions of the bullish candle. The first is a very bullish candlestick called the bullish marubozu. The rough translation of marubozu is “bald or little hair” (Rhoads, 2008, p. 74). A marubozu is bald or has little hair because a marubozu has no upper or lower shadow, or at least a very small upper and/or lower shadow. This is the most extreme form of the bullish candlestick because bulls were in charge from the opening to the close; bears were unable to push prices below the opening price and the trading session ended with bulls still buying pushing prices upward until the close.
Candlesticks Vol 2 - Candlestick Sentiment
Video Tutorial on How To Trade Descending Triangle Chart Patterns
Forum
Indicators: Levels
newdigital, 2013.11.13 07:42
How to Trade a Descending Triangle
Talking Points
===============
What is a Descending Triangle pattern?
A descending triangle pattern is consolidation price pattern composed of lower swing highs pushed lower by an established downtrend line converging with a horizontal support made up of a series of swing lows located in roughly the same area. Another name for the descending triangle is the right triangle pattern due to its similarity to the geometric shape of the same name. The height of the triangle meets the horizontal support at a 90 degree angle.
Usually, descending triangles form as profit taking by sellers is met with bargain hunting buyers. However, the buying pressure is mutted as higher lows are not made. A news release or economic announcement could be the catalyst required to push price out of this coil tilting the balance strongly in the seller's favor. Unlike its cousins, the symmetrical triangle and ascending triangle, the descending lacks significant bullish participation indicated by that lack of higher lows.
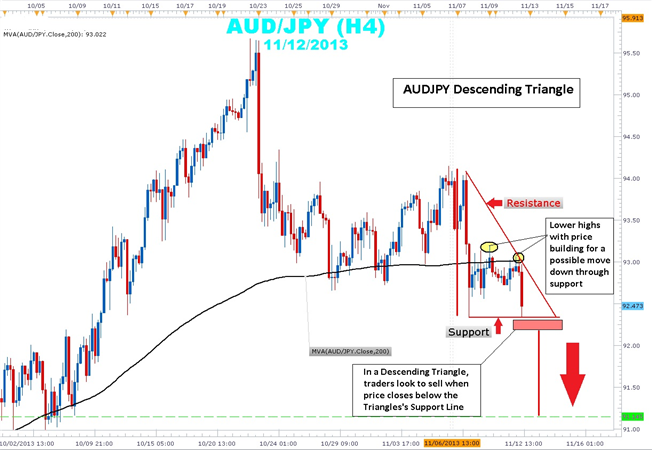
Taking a look at the current AUDJPY 4-hour chart, you can clearly see price action bound between a descending trend line that connects the 11/6 swing high of 94.15 to 11/12 swing high of 93.05. This swing high is a lower swing high than the 11/10 93.19 swing high showing the building strength in the downtrend. Current price action within the triangle is below the 200 simple moving average (SMA), a key indicator that traders use to determine bullishness or bearishness.
Traders will watch price action for a 4-hour candle close below support to confirm that there is follow through in a potential breakout. Stops can be placed near the middle of the triangle just above the 93.00 and 200 SMA. The height of the triangle is a little over 170 pips. By extending this height from the support level of a potential breakout zone, look for a possible target of 91.14. The profit target coincides with the lows seen back on October 2nd.
In summary, descending triangles can be an excellent way to rejoin a downtrend that clearly illustrates risk and reward. Price has a tendency to break form the descending triangle in a downward direction.
Candle Pattern Stages :
Confirmation
In this video I will be discussing a few ways to set a target level for your trade. Before entering a trade you should always have the details mapped out and planned as far as your entry level, stop loss level and target level. This should all be in accordance with your money management.
Before deciding whether or not to participate in the Forex market, you should carefully consider your investment objectives, level of experience and risk appetite. Most importantly, do not invest money you cannot afford to lose.
Pretty cool way to use the RSI. How to trade using RSI Trading Strategy
=========
Identify the Trend
The first step to trading any successful trend based strategy is to find the trend! One of easiest ways to find the trend is through identifying a charts swing highs and swing lows. Traders can work from left to right on their graph and identify the outliers in price. If you see the peaks and valleys of price declining consistently, you are looking at a downtrend. If highs and lows are advancing, traders would consider a currency pair to be trending upward.
Given this information, traders should look to sell the AUDNZD as long as price continues to decline towards lower lows. If the trend continues, expectations are that price will decline allowing traders to look for new areas to sell the market.
RSI for Entry
Once a strong trend is established, traders will look to join that trend with a technical market trigger. Oscillators are a family of indicators that are designed specifically to determine if momentum is returning to an existing trend. Below we can again see the AUDNZD 8 Hour chart, but this time the RSI (Relative Strength Index) indicator has been added. Since we have identified the AUDNZD as being in a downtrend, traders will look to sell the pair when the RSI indicator crosses back below a value of 70 (overbought). This will signal momentum returning lower after the creation of a new swing high.
Below you will find several previous examples of RSI entries signaled on the AUDNZD. Remember since the trend is down, only new sell positions should be initiated. At no point should a buy position be considered as price declines.
Manage Risk
Every good strategy needs a risk management component. When trading strong trends such as the AUDNZD, it is important to realize that they will eventually come to an end! Traders have a variety of choices when it comes to stop placement, but one of the easiest methods is to use a previous swing high on the chart. In the event that price breaks towards higher highs, traders will wish to exit any existing sell biased positions and look for new opportunities elsewhere.
Wether you are trading live money or just practicing on a demo it is also recomended to review your trades. This way you can track your progress while making sure you adhere to the strategy rules!
=========
Forum
Libraries: MQL5 Wizard - Candlestick Patterns Class
newdigital, 2013.09.18 22:29
Shooting Star
The Shooting Star candlestick formation is a significant bearish reversal candlestick pattern that mainly occurs at the top of uptrends.
The Shooting formation is created when the open, low, and close are roughly the same price. Also, there is a long upper shadow, generally defined as at least twice the length of the real body.
When the low and the close are the same, a bearish Shooting Star candlestick is formed and it is considered a stronger formation because the bears were able to reject the bulls completely plus the bears were able to push prices even more by closing below the opening price.
The Shooting Star formation is considered less bearish, but nevertheless bearish when the open and low are roughly the same. The bears were able to counteract the bulls, but were not able to bring the price back to the price at the open.
The long upper shadow of the Shooting Star implies that the market tested to find where resistance and supply was located. When the market found the area of resistance, the highs of the day, bears began to push prices lower, ending the day near the opening price. Thus, the bullish advance upward was rejected by the bears.
Shooting Star Candlestick Chart ExampleThe chart below of Cisco Systems (CSCO) illustrates a Shooting Star reversal pattern after an uptrend:
In the chart above of CSCO, the market began the day testing to find where supply would enter the market. CSCO's stock price eventually found resistance at the high of the day. In fact, there was so much resistance and subsequent selling pressure, that prices were able to close the day significantly lower than the open, a very bearish sign.
The Shooting Star is an extremely helpful candlestick pattern to help traders visually see where resistance and supply is located. After an uptrend, the Shooting Star pattern can signal to traders that the uptrend could be over and that long positions should probably be reduced or completely exited.
However, other indicators should be used in conjunction with the Shooting Star candlestick pattern to determine sell signals, for example, waiting a day to see if prices continued falling or other chart indications such as a break of an upward trendline.
For aggressive traders, the Shooting Star pattern illustrated above could be used as the sell signal. The red portion of the candle (the difference between the open and close) was so large with CSCO, that it could be considered the same as a bearish candle occuring on the next day. However, caution would have to be used because the close of the Shooting Star rested right at the uptrend support line for Cisco Systems.
Generally speaking though, a trader should wait for a confirmation candle before entering.
The bullish version of the Shooting Star formation is the Inverted Hammer formation that occurs at bottoms. Another similar candlestick pattern in look and interpretation to the Shooting Star pattern is the Gravestone Doji