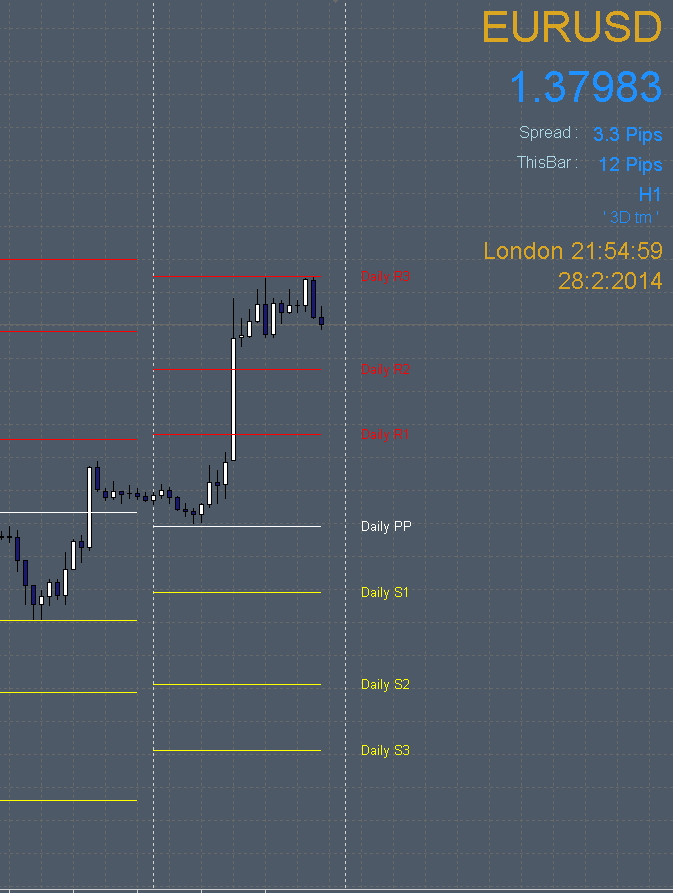
Please Help! Can someone help me! How to move Text Label.
Please tell me how to move the text label.
Please see the following code and attached file.
...can you help? Thanks advanced.
<REMOVED>
ObjectCreate( R3_NAME, OBJ_TEXT, 0, 0, 0 );
- There is no such thing as a "text label" There are text objects (connected to bars,) and label objects (connected to a chart corner.)
- Why are you using a text object when you don't want them moving with the bars?
Use ObjectMove in start() and code so that the object is only moved when a new bar opens.
Use Time[0] + n for the time co-ordinate. n being whatever value places the text nicely
Please tell me how to move the text label.
Please see the following code and attached file.
...can you help? Thanks advanced.
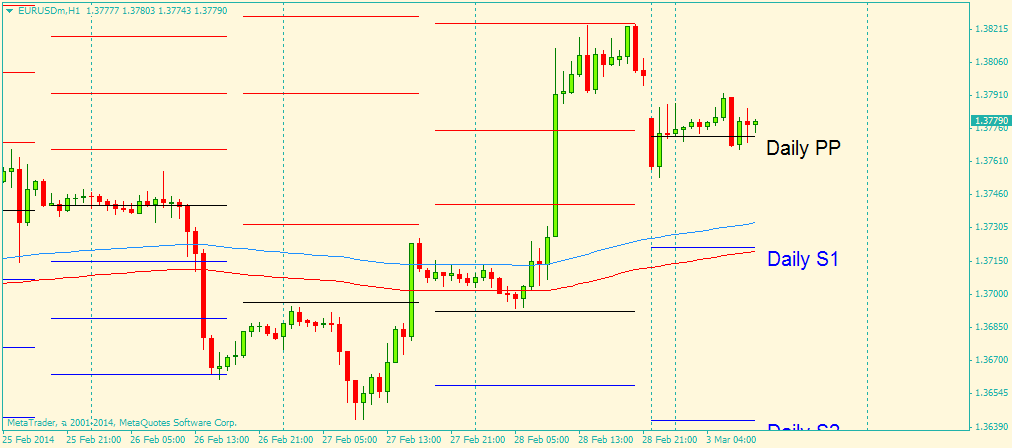
Is this what you're looking for ?
I played around with the code a bit, so now the chart is shifted automatically to a set percentage and text objects (or text labels as you call them ) can be adjusted as well.
If this is what you're looking for let me know here or pm me.
- There is no such thing as a "text label" There are text objects (connected to bars,) and label objects (connected to a chart corner.)
- Why are you using a text object when you don't want them moving with the bars?
1. That is correct and I bet that pandora111 didn't know that.
2. This one is easy, because he/she wants them moving with the bars but on the right side of the chart shift tab. That's all.
Use ObjectMove in start() and code so that the object is only moved when a new bar opens.
Use Time[0] + n for the time co-ordinate. n being whatever value places the text nicely
Did you try that? I'm asking because I did and it looks like past the point of Time[0] the text objects are not visible.
Looks like they need to be created past the Time[0] line to the right. Of course after shifting the chart.
if(ChartShiftSizeGet()<ChartShift)ChartShiftSizeSet(ChartShift);
Use ObjectMove in start() and code so that the object is only moved when a new bar opens.
Use Time[0] + n for the time co-ordinate. n being whatever value places the text nicely
Did you try that? I'm asking because I did and it looks like past the point of Time[0] the text objects are not visible.
Looks like they need to be created past the Time[0] line to the right. Of course after shifting the chart.
I have used it in the past and it works, obviously the chart has to be shifted and it won't work so well if the user tends to zoom in and out on the chart
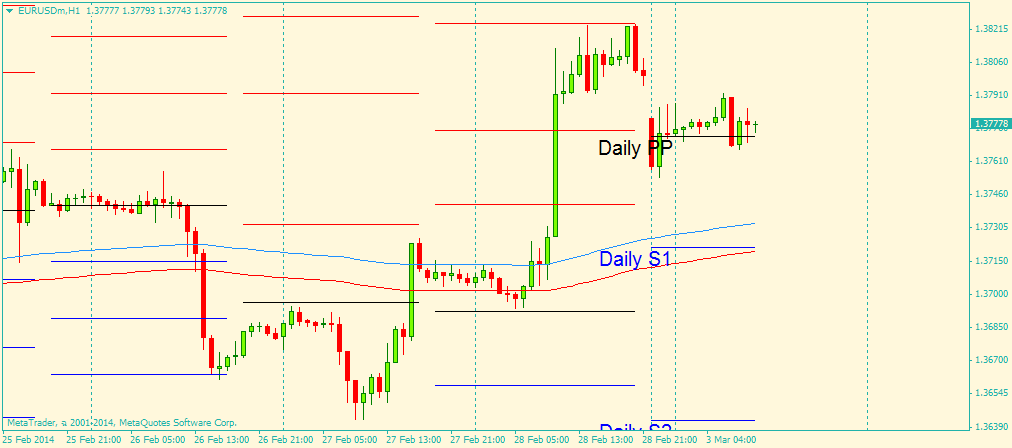
This is how the indi displays with Pandora's code
Then by adding
            ObjectMove( R3_NAME, 0, Time[0]+Period()*60*6, Res3[0] );
            ObjectMove( R2_NAME, 0, Time[0]+Period()*60*6, Res2[0] );
            ObjectMove( R1_NAME, 0, Time[0]+Period()*60*6, Res1[0] );
            ObjectMove( PIVOT_NAME, 0, Time[0]+Period()*60*6, Pivot[0] );
            ObjectMove( S1_NAME, 0, Time[0]+Period()*60*6, Sup1[0] );
            ObjectMove( S2_NAME, 0, Time[0]+Period()*60*6, Sup2[0] );
            ObjectMove( S3_NAME, 0, Time[0]+Period()*60*6, Sup3[0] );
I have used it in the past and it works, obviously the chart has to be shifted and it won't work so well if the user tends to zoom in and out on the chart
This is how the indi displays with Pandora's code
Then by adding
I have used a different approach :
1. Shifted the chart
//--------------------------------------------------------------------
//| Main iteration                                                   |
//--------------------------------------------------------------------
int start()
  {
   int i,Count;
   double Range;
   int labelsCount;
   if(ChartShiftSizeGet()<ChartShift)ChartShiftSizeSet(ChartShift);
   i=Bars-IndicatorCounted()-1;
using the :
//+---------------------------------------------------------------------------+
//| The function receives shift size of the zero bar from the right border    |
//| of the chart in percentage values (from 10% up to 50%).                   |
//+---------------------------------------------------------------------------+
double ChartShiftSizeGet(const long chart_ID=0)
  {
//--- prepare the variable to get the result
   double result=EMPTY_VALUE;
//--- reset the error value
   ResetLastError();
//--- receive the property value
   if(!ChartGetDouble(chart_ID,CHART_SHIFT_SIZE,0,result))
     {
      //--- display the error message in Experts journal
      Print(__FUNCTION__+", Error Code = ",ErrorDescription(GetLastError()));
     }
//--- return the value of the chart property
   return(result);
  }
//+--------------------------------------------------------------------------------------+
//| The function sets the shift size of the zero bar from the right                      |
//| border of the chart in percentage values (from 10% up to 50%). To enable the shift   |
//| mode, CHART_SHIFT property value should be set to                                    |
//| true.                                                                                |
//+--------------------------------------------------------------------------------------+
bool ChartShiftSizeSet(const double value,const long chart_ID=0)
  {
//--- reset the error value
   ResetLastError();
//--- set property value
   if(!ChartSetDouble(chart_ID,CHART_SHIFT_SIZE,value))
     {
      //--- display the error message in Experts journal
      Print(__FUNCTION__+", Error Code = ",ErrorDescription(GetLastError()));
      return(false);
     }
//--- successful execution
   return(true);
  }
then I've set an array for names and an array for price value for each pivot.
Then, if new day, I 'got the text object deleted with
//+------------------------------------------------------------------+
//| Delete Text object                                               |
//+------------------------------------------------------------------+
bool TextDelete(const long   chart_ID=0,  // chart's ID
                const string name="Text") // object name
  {
//--- reset the error value
   ResetLastError();
//--- delete the object
   if(!ObjectDelete(chart_ID,name))
     {
      Print(__FUNCTION__,
            ": failed to delete "+name+" object! Error code = ",ErrorDescription(GetLastError()));
      return(false);
     }
//--- successful execution
   return(true);
  }
and create them again with
//+------------------------------------------------------------------+
//| Creating Text object                                             |
//+------------------------------------------------------------------+
bool TextCreate(const long              chart_ID=0,               // chart's ID
                const string            name="Text",              // object name
                const int               sub_window=0,             // subwindow index
                datetime                time=0,                   // anchor point time
                double                  price=0,                  // anchor point price
                const string            text="Text",              // the text itself
                const string            font="Arial",             // font
                const int               font_size=10,             // font size
                const color             clr=clrRed,               // color
                const double            angle=0.0,                // text slope
                const ENUM_ANCHOR_POINT anchor=ANCHOR_LEFT_UPPER, // anchor type
                const bool              back=false,               // in the background
                const bool              selection=false,          // highlight to move
                const bool              hidden=true,              // hidden in the object list
                const long              z_order=0)                // priority for mouse click
  {
//--- set anchor point coordinates if they are not set
   ChangeTextEmptyPoint(time,price);
//--- reset the error value
   ResetLastError();
//--- create Text object
   if(!ObjectCreate(chart_ID,name,OBJ_TEXT,sub_window,time,price))
     {
      Print(__FUNCTION__,
            ": failed to create "+name+" object! Error code = ",ErrorDescription(GetLastError()));
      return(false);
     }
//--- set the text
   ObjectSetString(chart_ID,name,OBJPROP_TEXT,text);
//--- set text font
   ObjectSetString(chart_ID,name,OBJPROP_FONT,font);
//--- set font size
   ObjectSetInteger(chart_ID,name,OBJPROP_FONTSIZE,font_size);
//--- set the slope angle of the text
   ObjectSetDouble(chart_ID,name,OBJPROP_ANGLE,angle);
//--- set anchor type
   ObjectSetInteger(chart_ID,name,OBJPROP_ANCHOR,anchor);
//--- set color
   ObjectSetInteger(chart_ID,name,OBJPROP_COLOR,clr);
//--- display in the foreground (false) or background (true)
   ObjectSetInteger(chart_ID,name,OBJPROP_BACK,back);
//--- enable (true) or disable (false) the mode of moving the object by mouse
   ObjectSetInteger(chart_ID,name,OBJPROP_SELECTABLE,selection);
   ObjectSetInteger(chart_ID,name,OBJPROP_SELECTED,selection);
//--- hide (true) or display (false) graphical object name in the object list
   ObjectSetInteger(chart_ID,name,OBJPROP_HIDDEN,hidden);
//--- set the priority for receiving the event of a mouse click in the chart
   ObjectSetInteger(chart_ID,name,OBJPROP_ZORDER,z_order);
//--- successful execution
   return(true);
  }
If you're interested, I can post the file or the code. Maybe you can improve on it.
Is this what you're looking for ?
I played around with the code a bit, so now the chart is shifted automatically to a set percentage and text objects (or text labels as you call them ) can be adjusted as well.
If this is what you're looking for let me know here or pm me.
Hi, I suggest you to not invite people to pm you. This is certainly not your intention, but this can be interpreted as a form of advertising, as we don't know if you are not trying to sell something.
Are you serious?
If I had the intention to sell something, wouldn't I be the one to pm others?
Here is what the line just above your post says : " If you're interested, I can post the file or the code. Maybe you can improve on it."
Is this why most of my posts get deleted?
You don't have a problem with this:
Your message to me I can give you the full code directly.....
That won't be for free. For that you have to use Jobs section and pay to get it...
Isn't that clear intention to sell? So no more pm for me I guess, is it?
I am truly shocked !
- Free trading apps
- Over 8,000 signals for copying
- Economic news for exploring financial markets
You agree to website policy and terms of use
Please tell me how to move the text label.
Please see the following code and attached file.
...can you help? Thanks advanced.
int init()
{
// Attach indicator arrays to buffers
SetIndexBuffer( 0, Res3);
SetIndexBuffer( 1, Res2);
SetIndexBuffer( 2, Res1);
SetIndexBuffer( 3, Pivot);
SetIndexBuffer( 4, Sup1);
SetIndexBuffer( 5, Sup2);
SetIndexBuffer( 6, Sup3);
// Set styles
SetIndexStyle( 0, DRAW_LINE, STYLE_SOLID, 1);
SetIndexStyle( 1, DRAW_LINE, STYLE_SOLID, 1);
SetIndexStyle( 2, DRAW_LINE, STYLE_SOLID, 1);
SetIndexStyle( 3, DRAW_LINE, STYLE_SOLID, 1);
SetIndexStyle( 4, DRAW_LINE, STYLE_SOLID, 1);
SetIndexStyle( 5, DRAW_LINE, STYLE_SOLID, 1);
SetIndexStyle( 6, DRAW_LINE, STYLE_SOLID, 1);
// Set empty values
SetIndexEmptyValue( 0, EMPTY_VALUE );
SetIndexEmptyValue( 1, EMPTY_VALUE );
SetIndexEmptyValue( 2, EMPTY_VALUE );
SetIndexEmptyValue( 3, EMPTY_VALUE );
SetIndexEmptyValue( 4, EMPTY_VALUE );
SetIndexEmptyValue( 5, EMPTY_VALUE );
SetIndexEmptyValue( 6, EMPTY_VALUE );
// Set labels
SetIndexLabel( 0, R3_NAME );
SetIndexLabel( 1, R2_NAME );
SetIndexLabel( 2, R1_NAME );
SetIndexLabel( 3, PIVOT_NAME );
SetIndexLabel( 4, S1_NAME );
SetIndexLabel( 5, S2_NAME );
SetIndexLabel( 6, S3_NAME );
// Put text on the chart
ObjectCreate( R3_NAME, OBJ_TEXT, 0, 0, 0 );
ObjectCreate( R2_NAME, OBJ_TEXT, 0, 0, 0 );
ObjectCreate( R1_NAME, OBJ_TEXT, 0, 0, 0 );
ObjectCreate( PIVOT_NAME, OBJ_TEXT, 0, 0, 0 );
ObjectCreate( S1_NAME, OBJ_TEXT, 0, 0, 0 );
ObjectCreate( S2_NAME, OBJ_TEXT, 0, 0, 0 );
ObjectCreate( S3_NAME, OBJ_TEXT, 0, 0, 0 );
// Set the text characteristics
ObjectSetText( R3_NAME, R3_NAME, 15, FONT, R3_COL );
ObjectSetText( R2_NAME, R2_NAME, 15, FONT, R2_COL );
ObjectSetText( R1_NAME, R1_NAME, 15, FONT, R1_COL );
ObjectSetText( PIVOT_NAME, PIVOT_NAME, 15, FONT, PIVOT_COL );
ObjectSetText( S1_NAME, S1_NAME, 15, FONT, S1_COL );
ObjectSetText( S2_NAME, S2_NAME, 15, FONT, S2_COL );
ObjectSetText( S3_NAME, S3_NAME, 15, FONT, S3_COL );
// Catch bad input
if( MathAbs( ShiftHrs ) > 23 )
{
Alert( "ShiftHrs is too large. Reset to 0 hrs. ");
ShiftHrs = 0;
}
ThisSymbol = Symbol();
PivotDayStartTime = Time[Bars-1]; // the first bar
return(0);
}