Indicators: Donchian Channel
newdigital, 2013.10.15 06:20
A Basic Breakout Strategy For Forex
Talking Points:
- Forex tips for finding support and resistance levels.
- Learn to enter Forex breakouts using Donchian Channels.
- Complete a breakout trading plan with stop orders.
The Forex market is known for its strong trends, which can make trading a breakout strategy an effective approach to the markets. Normally the first step of any breakout strategy is to identify the key levels of support and resistance for a currency pair. Today we are going to review using Donchian Channels for just that purpose, while complete a trading setup on the GBPUSD.
Let’s get started!
Trading Donchian Channels
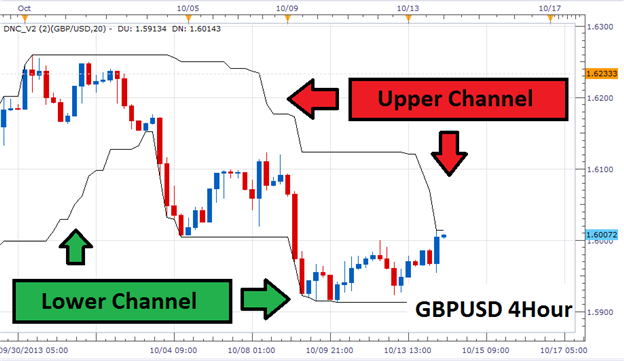
Donchian Channels can be applied to any chart to extrapolate current levels of support and resistance. They do this by clearly identify the high and low on a graph created during the selected number of periods. Above we can see the Donchian Channels applied to a GBPUSD 4Hour chart, using a 20 period setting. The channel lines highlight the current 20 periods high and low values, which can be used as support and resistance when trading breakouts. Breakout traders in a downtrend will look for price to break below the lower channel prior to creating new entries in the direction of the trend. The same is true in an uptrend, where traders will identify the upper channel as a potential area to enter the market.
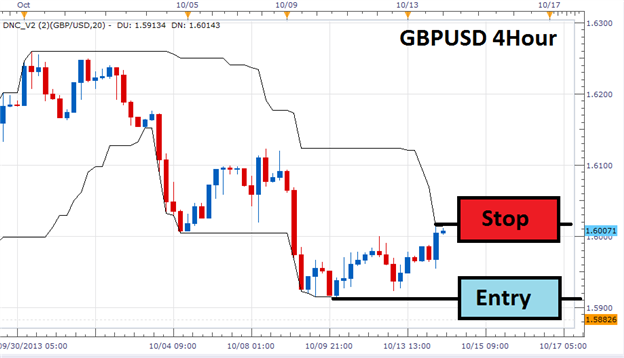
Since the price of the GBPUSD has declined as much as 346 pips for the month of October, many traders will want to identify new entries to sell the pair on a breakout towards lower lows. With our current low already identified by the Donchian Channels at 1.5913, traders can begin preparing for a breakout below this value. As pictured below, you can find a sample breakout setup. Entry orders to sell the GBPUSD can be placed at a minimum of one pip below support, so traders enter the market on a breakout to lower lows.
Setting Risk
As with any strategy, breakout traders should incorporate stops into their trading. When using Donchian Channels, this process can be made very easy. Remember how the top pricing channel (representing the 20 period high), acts as an area of resistance? In a downtrend price is expected to make lower lows and stay below this value. If a new high is created, with a breach of the upper channel, traders will want to exit their positions. Traders may also want to manually tail and move their stop order to lock in profit as the trend continues. On trading tip breakout traders can employ is moving this preset stop along with the decreasing pricing channel as the trade moves in their favor.
Forum on trading, automated trading systems and testing trading strategies
newdigital, 2014.01.18 07:34
How to use Donchian Channels (adapted from dailyfx article)
- First find the trend to determine the trend
- Learn to enter Forex breakouts using Donchian Channels.
- Channels can be used to trail your stop and lock in profit.
The Forex market is known for its strong trends, which can make trading breakouts of support and resistance levels an effective approach to the markets. To plan for such market conditions, today we will review a three step breakout strategy using the Donchian Channels.
Find the Trend
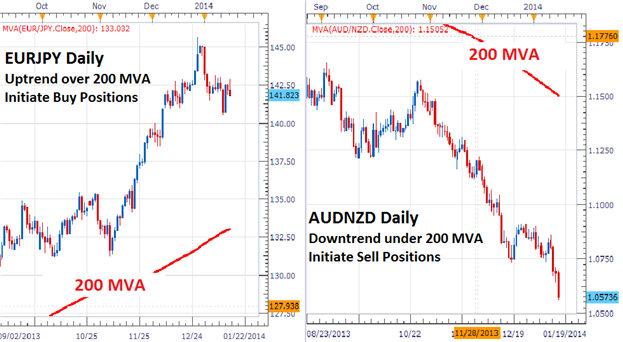
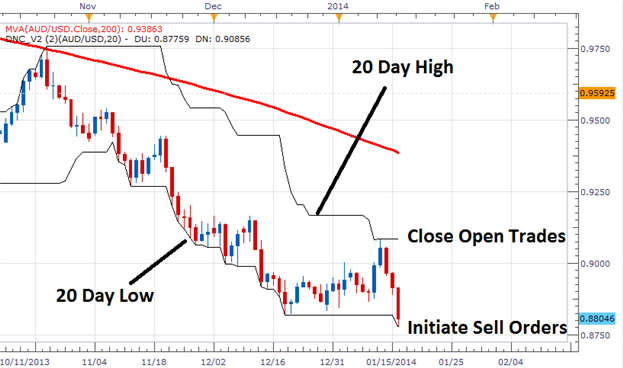
The first step to trend trading is to find the trend! There are many ways to identify the trends depicted below, but one of easiest is through the use of the 200 period MVA (Moving Average). To begin add this indicator to your chart, and then see if price is above or below the average. This is how we will determine the trend and our trading bias.
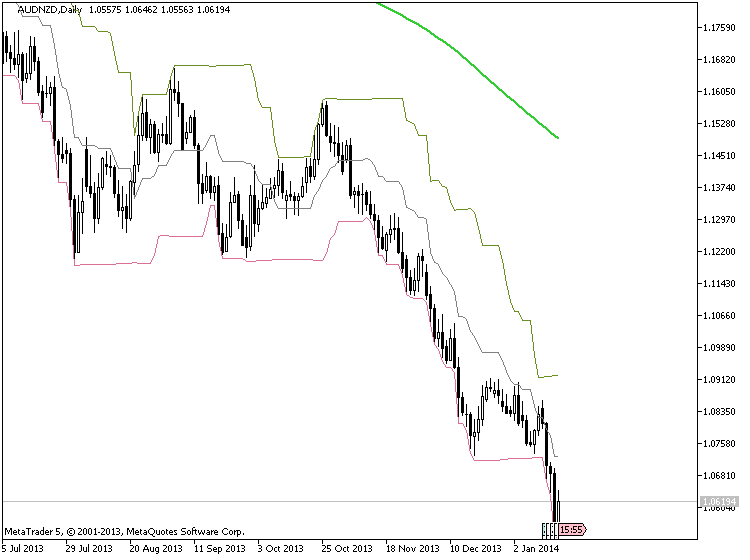
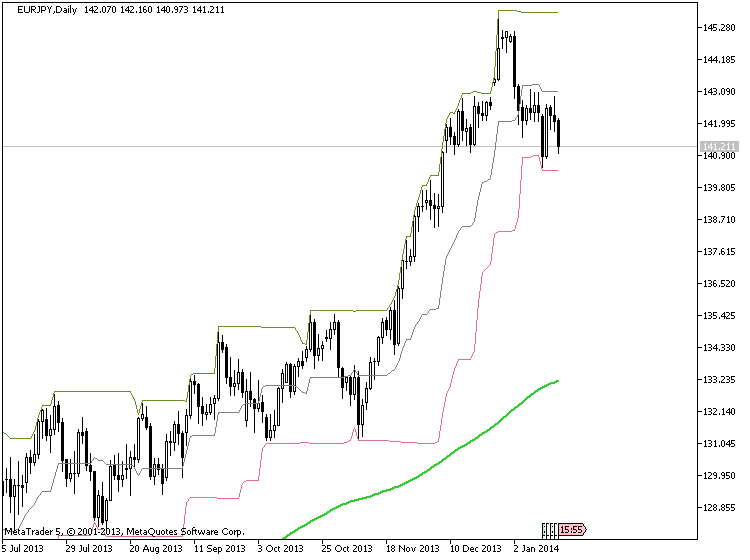
Given the information above, traders should look for opportunities to buy the EURJPY in its current uptrend as price is above the average. As well, the AUDNZD pictured below offers selling opportunities since the pair is priced under the 200 period MVA. Once we have this information, then we can plan entry placements for a potential breakout.
Trading Donchian Channels
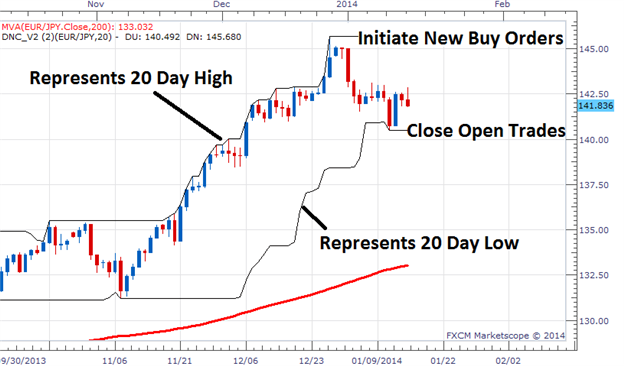
Donchian Channels are a technical tool that can be applied to any chart. They are used to pinpoint current levels of support and resistance by identifying the high and low price on a graph, over the selected number of periods. For today’s strategy we will be using 20 periods meaning that the channels will be used to identify the 20 day high and low in price.
Since the price of the EURJPY is trading above the 200 MVA, traders will want to identify new entries to buy the pair on a breakout towards higher highs. With our current 20 Day high identified by the Donchian Channels at 145.68 traders can set an entry to buy the EURJPY one pip above this value.
The process of initiating sell positions in a downtrend is exactly the opposite. Again, we will revisit the AUD/NZD Daily graph pictured below. As price is below the 200 MVA, traders will look to sell the pair in the event of price creating a new 20 Day low. Currently that low resides at .8775 and traders can look to initiate new sell positions under that value.
Setting Risk & Trailing Stops
When trading any strategy, setting stops and managing risk should be considered. When using Donchian Channels, this process can be simplified. Remember how our pricing channels (representing the 20 Day high or low), act as an area of support or resistance? In an uptrend, price is expected to move to higher highs and stay above this value. If price moves through the bottom channel, representing a new 20 Day low, traders will want to exit any long positions. Conversely in a downtrend, traders will want to place stops orders at the current 20 period high. This way, traders will exit any short positions upon the creation of a new high.
Traders may also use the Donchian Channels as a mechanism to trail their stop. As the trend continues, traders may move their stop along with the designated channel. Trailing a stop in this manner will allow you to update the stop with the position, and lock in profit as the trend continues.
Forum on trading, automated trading systems and testing trading strategies
newdigital, 2014.01.18 07:39
After reading this article (above) - you/we can open D1 chart, attached Donchian Channel indicator (see first post of this thread), attach MA with the period 200/method simple.apply to close (this indicator is default one in Metatrader 5) - and we can make some practics (when market will be open). You should have the similar charts after attaching those 2 indicators:
After that - re-read this above article using your Metatrader charts.
That's all news
- Free trading apps
- Over 8,000 signals for copying
- Economic news for exploring financial markets
You agree to website policy and terms of use
Donchian Channel:
Donchian Channel is a volatility indicator based on the calculation of the current price range with the recent highest and lowest prices.
Code is similar to Donchian Channels, but the middle line is not plotted.
Author: Johannes Hermann