I've noticed around in the forum various references to Polyline, by WHRoeder. As I understand it, it allows an EA to draw lines on a chart the way an indicator would. https://www.mql5.com/en/forum/130907
Is this correct?
Is it usuable within Strategy Tester?
What about non-standard timeframes, can it display lines for that? I am developing a rangebar library in MQL4, and as I need them, I develop modified versions of indicators that work on rangebars, but from within the library code (e.g. Moving Average, average of moving avarage - iMAOnArray). But I cannot easily display the values calculated. This is because the rangebars are calculated in memory (optional to save to file), on a standard MQ4 chart and the Time[] values are not synched to the rangebar times. Ie, the EA would NOT be running in an offline chart. I have tried the commercial indicator marketed by AZ-Invest, but tick movement during backtest was jerky, hence I'm doing it myself. I eventually hope to have a "RangeBar server" running on a VPS, collecting rangebars, and automatically download up-to-date history to my local terminal whenever it connects.
How exactly do you integrate polyline into an EA? There are a handful of variables undefined in the code, specifically Show.Objects. Dont know how to set that.
I assume a polyline is a line made up from segments so it can appear similar to an Indicator line but made from Objects. This means it can be drawn by an EA.
The best way to use someone else's code is to first understand how it does what it does, then if there are any errors you can fix them.
WHRoeder will be here soon to explain his codes. In the meantime I highly recommend playing around with the functions. There are some examples within the codes in doc_style. Test out the ma_line example and see if that works for you.
Thank you very much Raptor and ubzen
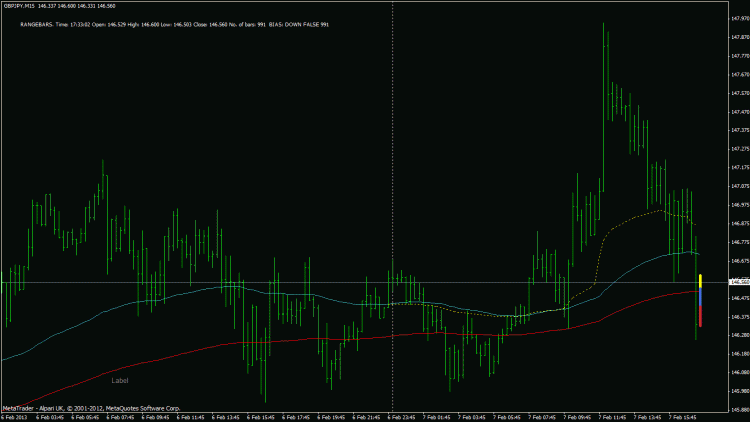
I've made some guesses at the values to be supplied in the code, result is yellow dashed line in pic below. Its supposed to be a 200 EMA on range bars if I've calculated it correctly, the red line is the "normal" 200 EMA:
@ubzen: where is the ma_line example please?
 *  Example 2:
 *  double  ELineCurr = iMA(NULL,0, ELine.Period, 0, MODE_EMA, PRICE_CLOSE, 1);
 *  string pln=Polyline("ELine", ELineCurr, Color.ELine, 1);
HarriMQL4:
it allows an EA to draw lines on a chart the way an indicator would.
Is it usuable within Strategy Tester?
What about non-standard timeframes, can it display lines for that?
- That was the point of writing it.
- Of course, There is no difference. All you have is a chart and a call to start.
- Of course, There is no difference. All you have is a chart and a call to start.
- Had you bothered to look at all the posted code you would have seen
extern bool    Show.Comments              = true;
extern bool    Show.Objects               = true;
:
int      init(){                                            OptInitialization();
:
   if(      !IsTesting())     status.chart   = CS_LIVE;
   else  if(IsVisualMode())   status.chart   = CS_VISUAL;
   else{                      status.chart   = CS_OPTIMIZER;
                              Show.Comments  = false;
                              Show.Objects   = false;                         }
- Free trading apps
- Over 8,000 signals for copying
- Economic news for exploring financial markets
You agree to website policy and terms of use

I've noticed around in the forum various references to Polyline, by WHRoeder. As I understand it, it allows an EA to draw lines on a chart the way an indicator would. https://www.mql5.com/en/forum/130907
Is this correct?
Is it usuable within Strategy Tester?
What about non-standard timeframes, can it display lines for that? I am developing a rangebar library in MQL4, and as I need them, I develop modified versions of indicators that work on rangebars, but from within the library code (e.g. Moving Average, average of moving avarage - iMAOnArray). But I cannot easily display the values calculated. This is because the rangebars are calculated in memory (optional to save to file), on a standard MQ4 chart and the Time[] values are not synched to the rangebar times. Ie, the EA would NOT be running in an offline chart. I have tried the commercial indicator marketed by AZ-Invest, but tick movement during backtest was jerky, hence I'm doing it myself. I eventually hope to have a "RangeBar server" running on a VPS, collecting rangebars, and automatically download up-to-date history to my local terminal whenever it connects.
How exactly do you integrate polyline into an EA? There are a handful of variables undefined in the code, specifically Show.Objects. Dont know how to set that.
Many thanks for your time.