How to plot line on avg. price of first five minutes every hour
Need help. How to draw H+L/2 price of the first five minutes every hour on M1 chart. Thank you for help.
- experienced MQL4 programmer offering help
- I need a 2 line moving avg that shows in a expert advisor..not an indicator. any help?
- 90 minute charts.
Get the time, get the top of the hour, get the M5 shift, get the prices of the M5 bar, draw the line.
WHRoeder:
Get the time, get the top of the hour, get the M5 shift, get the prices of the M5 bar, draw the line.
Get the time, get the top of the hour, get the M5 shift, get the prices of the M5 bar, draw the line.
Thank you WHRoeder
Problem is, that I don't know MQL4 code. I would be very thankfull if same one put in writing atleast how to get H and Low of the first five min. on every houre in M1 chart.
kirvist:
Here code for hourly median price, similar to hourly pivots
Here code for hourly median price, similar to hourly pivots
#property indicator_chart_window
#property indicator_buffers 7
#property indicator_color1 Maroon
#property indicator_color2 Maroon
#property indicator_color3 Maroon
#property indicator_color4 Blue
#property indicator_color5 Maroon
#property indicator_color6 Maroon
#property indicator_color7 Maroon

//---- buffers
double ChartUp3[];
double ChartUp2[];
double ChartUp1[];
double ChartPP[];
double ChartDown1[];
double ChartDown2[];
double ChartDown3[];

extern int Delta1=150;
extern int Delta2=170;
extern int Delta3=300;

//+------------------------------------------------------------------+
//| Custom indicator initialization function                         |
//+------------------------------------------------------------------+
int init() {
        //---- indicators
        SetIndexBuffer(0,ChartUp3);
        SetIndexBuffer(1,ChartUp2);
        SetIndexBuffer(2,ChartUp1);
        SetIndexBuffer(3,ChartPP);
        SetIndexBuffer(4,ChartDown1);
        SetIndexBuffer(5,ChartDown2);
        SetIndexBuffer(6,ChartDown3);

        SetIndexStyle(0,DRAW_LINE,STYLE_DOT);
        SetIndexStyle(1,DRAW_LINE,STYLE_DOT);
        SetIndexStyle(2,DRAW_LINE,STYLE_DOT);
        SetIndexStyle(3,DRAW_LINE,STYLE_DOT);
        SetIndexStyle(4,DRAW_LINE,STYLE_DOT);
        SetIndexStyle(5,DRAW_LINE,STYLE_DOT);
        SetIndexStyle(6,DRAW_LINE,STYLE_DOT);

        string short_name = "Hourly Pivot + Point System";
        IndicatorShortName(short_name);
        return(1);
}

//+------------------------------------------------------------------+
//| Custom indicator deinitialization function                       |
//+------------------------------------------------------------------+
int deinit() {
        ObjectDelete("30");
        ObjectDelete("17");
        ObjectDelete("15");
        ObjectDelete("PP");
        ObjectDelete("-15");
        ObjectDelete("-17");
        ObjectDelete("-30");
        Comment("");
        return(0);
}

//+------------------------------------------------------------------+
//| Custom indicator iteration function                              |
//+------------------------------------------------------------------+

double prevL=0, prevH=0;
double Down3, Down2, Down1, P = 0, Up1, Up2, Up3;
int thisHour = -1;

int start() {
        if (Period() > 60) return(0);           //Chart cannot be higher than H1

        int counted_bars=IndicatorCounted();
        if (counted_bars >0) counted_bars--;
        int limit=Bars-counted_bars;

        int period = MathCeil(60 / Period());

        for (int i = limit-1; i>=0; i--) {
                if (i + period < Bars && TimeMinute(iTime(NULL,0,i)) == 0 && thisHour != TimeHour(iTime(NULL,0,i)) ) {
                        thisHour = TimeHour(iTime(NULL,0,i));
                        prevH = High[Highest(NULL, 0, MODE_HIGH, period, i+1)];
                        prevL = Low [Lowest (NULL, 0, MODE_LOW,  period, i+1)];

        {
                                P  = (prevH + prevL)/2;
                                Up3 = P + Delta3*Point;
                                Up2 = P + Delta2*Point;
                                Up1 = P + Delta1*Point;
                                Down1 = P - Delta1*Point;
                                Down2 = P - Delta2*Point;
                                Down3 = P - Delta3*Point;

                        }
                }

                if (P > 0) {
                        ChartUp3[i] = Up3;
                        ChartUp2[i] = Up2;
                        ChartUp1[i] = Up1;
                        ChartPP[i] = P;
                        ChartDown1[i] = Down1;
                        ChartDown2[i] = Down2;
                        ChartDown3[i] = Down3;

                        drawLabel("30",Up3,Lime);
                        drawLabel("17",Up2,Lime);
                        drawLabel("15",Up1,Lime);
                        drawLabel("PP",P, Lime);
                        drawLabel("-15",Down1,Lime);
                        drawLabel("-17",Down2,Lime);
                        drawLabel("-30",Down3,Lime);
                }
        }
        return(0);
}

//+------------------------------------------------------------------+

void drawLabel (string name,double lvl,color Color) {
        if (ObjectFind(name) != 0) {
                ObjectCreate(name, OBJ_TEXT, 0, Time[10], lvl);
                ObjectSetText(name, name, 8, "Arial", EMPTY);
                ObjectSet(name, OBJPROP_COLOR, Color);
        } else {
                int x = 1 + MathCeil(10/Period());
                ObjectMove(name, 0, Time[x], lvl);
        }
}
But can't find a way to get median price for first 5 min.
How to code time for five min. every hour on M1 chart?
datetime topHour = Time[i] - Time[i] % 3600;
int      iM5     = iBarShift(NULL, PERIOD_M5, topHour);
double   HH      = iHigh(NULL, PERIOD_M5, iM5),
         LL      = iLow(NULL, PERIOD_M5, iM5);
mediumBuffer[i] = (HH+LL)/2.;
WHRoeder:
Thank You WHRoeder for your help! How to get your code in. It took me a while, but I started to get same line on M1 chart.
#property indicator_chart_window
#property indicator_buffers 1
#property indicator_color1 Maroon


//---- buffers

double ChartPP[];


//+------------------------------------------------------------------+
//| Custom indicator initialization function                         |
//+------------------------------------------------------------------+
int init() {
        //---- indicators

        SetIndexBuffer(0,ChartPP);
        SetIndexStyle(0,DRAW_LINE,STYLE_DOT);

        string short_name = "M5_M";
        IndicatorShortName(short_name);
        return(1);
}
//+------------------------------------------------------------------+
//| Custom indicator iteration function                              |
//+------------------------------------------------------------------+


int start() {
        if (Period() > 60) return(0);           //Chart cannot be higher than H1

      int i,                           // Bar index
          Counted_bars;                // Number of counted bars
          //--------------------------------------------------------------------
      Counted_bars=IndicatorCounted(); // Number of counted bars
      i=Bars-Counted_bars-1;           // Index of the first uncounted
      while(i>=0)                      // Loop for uncounted bars
      {

   datetime topHour = Time[i] - Time[i] % 3600;

   {
      int      iM5     = iBarShift(NULL, PERIOD_M5, topHour);
      double   prevH      = iHigh(NULL, PERIOD_M5, iM5),
               prevL      = iLow(NULL, PERIOD_M5, iM5);
               ChartPP[i] =  (prevH + prevL)/2.;
         i--;
        }
        }
        return(0);
}

//+------------------------------------------------------------------+
One thing so, sometimes it looks like line is there it suppose to be, but others times it's not a median price, it,s in wrong place. Way? Have no idea where to look for eror. May be some one may think of some solution. Look in picture.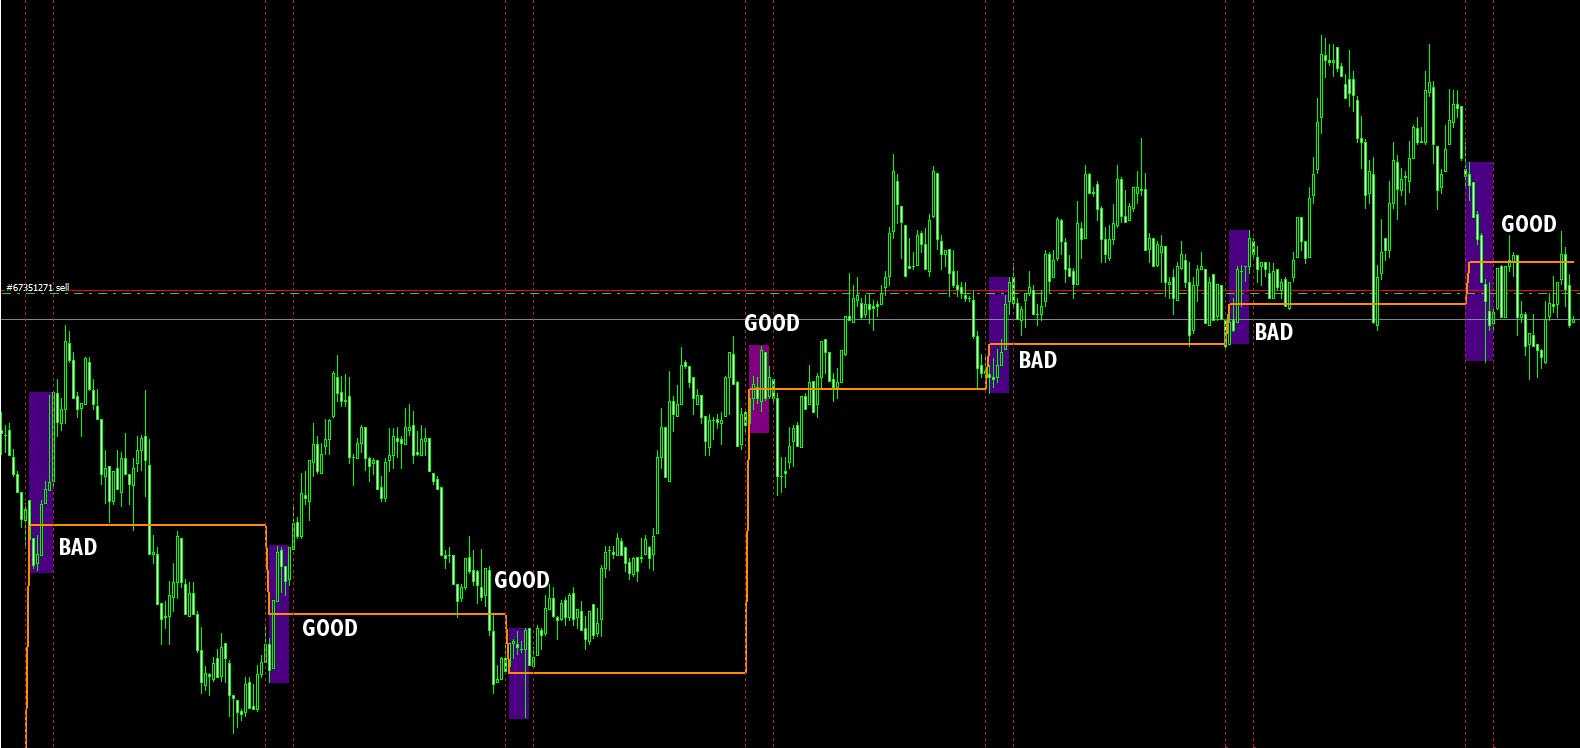
You may not have M5 history if you're using the tester. I didn't read you are running on the M1. Try
| From |
To |
|---|---|
int iM5 = iBarShift(NULL, PERIOD_M5, topHour); double prevH = iHigh(NULL, PERIOD_M5, iM5), prevL = iLow(NULL, PERIOD_M5, iM5); ChartPP[i] = (prevH + prevL)/2.; | int iTop = iBarShift(NULL, 0, topHour), iM5 = iBarShift(NULL, 0, topHour+300), iHi = iHighest(NULL,0,MODE_HIGH,iTop-iM5,iM5+1); double prevH = High[iHi], : |
You are missing trading opportunities:
- Free trading apps
- Over 8,000 signals for copying
- Economic news for exploring financial markets
Registration
Log in
You agree to website policy and terms of use
If you do not have an account, please register