You are missing trading opportunities:
- Free trading apps
- Over 8,000 signals for copying
- Economic news for exploring financial markets
Registration
Log in
You agree to website policy and terms of use
If you do not have an account, please register

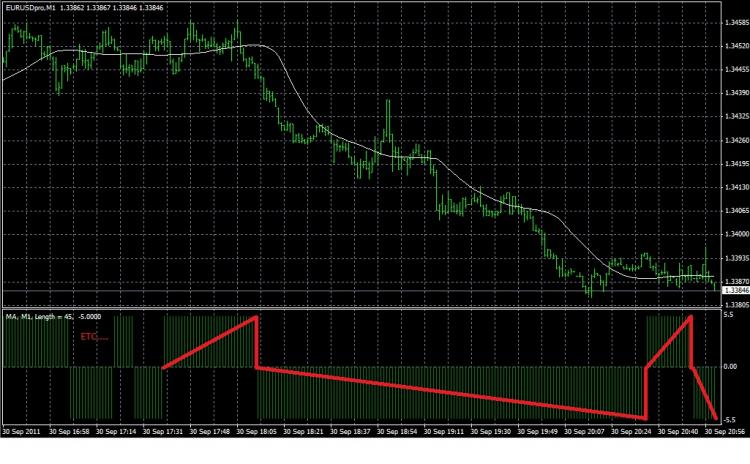
I have a MA that the slope is plotted as a Histogram bar. I am trying to Count the number of Histogram bars and plot them as the red line (see attachment).
This seems as if it would be really easy to code, and what I tried. ended up plotting the line backwards. I have looked everywhere for an example to do this, but couldn't find any.
If someone would give a hint/try, or any coding help would be greatly appreciated.