[Solved] What's the trick to using #property indicator_maximum?
#property indicator_maximum and #property indicator_minimum are being ignored in my indicator.
#property indicator_separate_window
https://www.mql5.com/en/code/7898
I understand that I can do it manually. I want to use #property indicator_maximum to set the fixed maximum, which is what it's supposed to do.
I understand that I can do it manually. I want to use #property indicator_maximum to set the fixed maximum, which is what it's supposed to do.
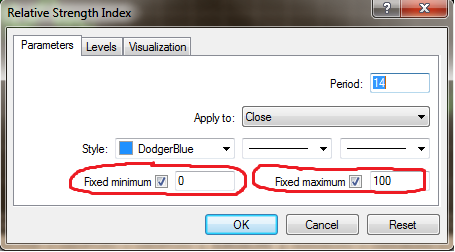
One of the things I have noticed is after I run the indicator, I will see "Fixed Minimum" and "Fixed Maximum" set to the minimum and maximum values of the Buffer, but they are unchecked so it doesn't do any good, and I need a little more room to be able to see the lines.
Yes, I'm using a separate window. Any chance you can post your code showing it working? Maybe I can see what you're doing different than me.
Sure, it's just an Indicator that I hacked for another poster on here and edited this morning to add the indicator min and max, it's not something I designed or wrote from scratch so don't go getting all critical on me ;-)
It's just assigning values to 2 buffers now, I commented the others out.
Sure, it's just an Indicator that I hacked for another poster on here and edited this morning to add the indicator min and max, it's not something I designed or wrote from scratch so don't go getting all critical on me ;-)
It's just assigning values to 2 buffers now, I commented the others out.
Thanks;
Well, I can't see anything unusual in your indicator. The only thing I can think of is that I have 6 buffers that all overlap each other so that I can get a multicolor line. Maybe that has something to do with it. I'll look into it tomorrow.
I don't understand why you gave me this link. It goes to a discussion of RSI. I don't think that has anything to do with my problem.
Yes, I'm using a separate window. Any chance you can post your code showing it working? Maybe I can see what you're doing different than me.
One of the things I have noticed is after I run the indicator, I will see "Fixed Minimum" and "Fixed Maximum" set to the minimum and maximum values of the Buffer, but they are unchecked so it doesn't do any good, and I need a little more room to be able to see the lines.
Why are you asking for a working example, when the RSI IS a WORKING Example?
You need to post YOUR code. No code posted, no good answers possible - no mind-readers here.
Are ALL your buffers in the same 1-10 range? If not use #property indicator_buffers n where the first 0-(n-1) buffers are in the 1-10 range.
I pointed to RSI because the code does exactly that.
Why are you asking for a working example, when the RSI IS a WORKING Example?
You need to post YOUR code. No code posted, no good answers possible - no mind-readers here.
Are ALL your buffers in the same 1-10 range? If not use #property indicator_buffers n where the first 0-(n-1) buffers are in the 1-10 range.
I have a calculation involving MA, Stochastic, MACD, and RSI that produces a # between Empty_Value & 9. I have no lines that show the MA, Stochastic, MACD, or RSI, just my single #. The calculation probably takes over 200 lines of code and it's mixed between include files. I don't see the point of showing you my calculations to arrive at that # because you're not going to wade through it looking for how it arrives at that #. Suffice it to say that I have verified that it always produces a # between Empty_Value & 9 (although I didn't look at all 20000 bars, I just put in a check to alert me if the # was greater than 9, and it never goes off). I then put that # into 1 of 6 different buffer arrays. Each buffer has a different color associated with it, so I get a single multicolored line in the window. And sometimes there are gaps in the line because the value at that point is Empty_Value. It works great as long as I manually type in the #s 0 and 10 in the Fixed Minimum and Maximum in the indicator properties.
I want the window that shows that multicolored line to have 0 at the bottom and 10 at the top. If the value at some point is Empty_Value but the fixed range only goes to 8, I can't tell if it's a 9 or Empty_Value.
My code to try and accomplish this is:
#property indicator_separate_window

#property indicator_minimum       0
#property indicator_maximum       10
#property indicator_buffers       8
But when I drop the indicator on a chart the window doesn't show any scale on the right and it's always blank. If I manually go into indicator properties, I can manually type in 0 and 10 in the Fixed Minimum and Maximum spaces then the window shows my indicator perfectly, but when I drop this indicator on a chart I want it to automatically use the default values of 0 & 10, but it doesn't.
Sometimes when I drop the indicator on a chart and the window is blank, I then go into the indicator properties and see that the Fixed Minimum and Maximum #s have been filled in with 0 & 6.5, or 5 & 5 or some other combination of #s less than 10, but the check boxes are never checked which means that the indicator doesn't have a fixed scale despite my telling it to fix it.
I assume that I'm doing something that is causing the indicator to ignore that code, but I have no idea what it could be. I'm hoping that someone can give me an idea of what to look for. Is it the way I assign the buffers to the lines, or the fact that each line has gaps in it where the value is Empty_Value, or that I have overlapping lines, or what?
- Free trading apps
- Over 8,000 signals for copying
- Economic news for exploring financial markets
You agree to website policy and terms of use
#property indicator_maximum and #property indicator_minimum are being ignored in my indicator.
I can set them manually, but i want to drop the indicator on more than one chart and don't want to have to do it manually.
I'm using:
#property indicator_maximum 10
#property indicator_minimum 0
PS: I saw a trick of setting a buffer that doesn't show and the window will automatically size to show those buffers, but I'm already using 8 buffers so I don't have room for more.