M5 indicator in a m15 chart?
Its for the already existing stochastic indicator and when i to visualization i pick the m5 and nothing happens.
Its for the already existing stochastic indicator and when i to visualization i pick the m5 and nothing happens.
The visualization settings are for which timeframe charts you want the indicator to appear. That is, if you only select H1 and H4, then the indicator will appear on H1 and H4 charts but not the others. It doesn't control the timeframe the indicator is plotting data from.
You need to find a multi-timeframe version of the indicator you are interested in. You can try this one I found for you but I haven't tested it. Older indicators might not support 5 digit brokers as-is.
http://www.forexfactory.com/showthread.php?p=2422359#post2422359
You need to get a multi timeframe version of the indicator to see different timeframe values.
The visualization tab has nothing to do with the values from different timeframes, it controls only the appearance of the indicator.

Unfortunately if you want to see the values from an indicator from a lower timeframe than the timeframe of your current chart, it is not possible. Here is an Example with some pictures:
Here we are using a mtf version of Bollinger Bands, and a simple indicator set up of two timeframes.
The green lines are the Bollinger Band values for the M1 (1 min) timeframe.
The red lines are the Bollinger Band values for the M5 (5 min) timeframe.
In the first example we set the chart timeframe to M1 and attach the indicators as described above. As you can see the both indicators are displayed and showing different values according to the selected timeframes in the indicator inputs.

The second screenshot represents what happens if we leave the indicator settings unchanged, and changing the timeframe of the chart to M5. As you can see in the indicators list, both indicators are still attached to the chart, but the displayed values are the same, the indicator lines are over each other. In other words the indicator with the M1 setting is now displaying the Bollinger values calculated on the current timeframe, beacuse it is higher than the period set in the indicator settings.
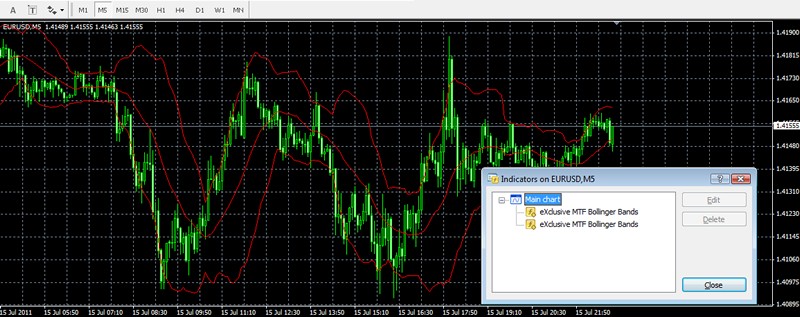
If we would change the chart timeframe to some other periods higher than M5, both indicators would display the Bollinger values for the chart timeframe, altough the indicator settings are set to a different timeframe.
A much common way to use multi timeframe indicators is to visualize the necessary values from a higher timeframe on a lower timeframe.
In your case I would suggest to open a M5 chart and apply a mtf version of your indicator on this chart with M15 timaframe setting.
- Free trading apps
- Over 8,000 signals for copying
- Economic news for exploring financial markets
You agree to website policy and terms of use
How can i make an indicator on m5 appear on a m15 chart ?