Indicators: Universal Oscillator
How Oscillators Can Show You If You (based on dailyfx article)
- The Value of Oscillators
- The Pain of Trading Against The Trend
- How Price Action & Oscillators Behave Counter-Trend
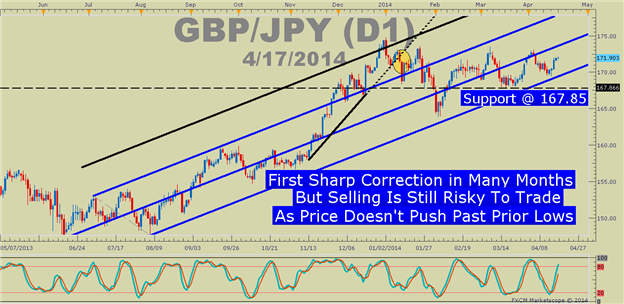
Oscillators can be one of the most valuable tools in a trader’s arsenal. A big reason for its value is that very few tools can help you see a great risk: reward set-up when a price action correction is coming to an end. Put in other words, an oscillator helps you see the exhaustion of a move so that you can enter near the exhaustion point of a prior trend.
However, it would be a disservice to you if you were led to believe that a stretched oscillator was a great entry.
Unfortunately, after many new traders learn about the benefits of oscillators, they believe they’ve received the golden key to trading profits and start buying low and selling high. A few steps back from the chart though and you’ll quickly see that only side of the trade is worth taking based on how price action reacts to an unwinding oscillator.
The Pain of Trading Against the Trend
The problem with trading against the trend is that it works every now and then. However, as a trader, it’s easy to agree with the words of John Maynard Keynes who said, “Markets can stay irrational longer than you can say solvent.” This sounds like someone who thought they had sold the top only to find they entered against a very strong trend that has no intention in stopping soon.
From talking to thousands of trader’s over the years, I’ve recognized a handful of reasons for trading against the trend. While this is not a definitive list, I’ve seen these three play out over and over again:
- The excitement of being right while everyone else is wrong
- The thought that the trend is overbought and due for a deep set-back
- The feeling that the biggest money will be made on the big turn
How Price Action & Oscillators Behave Counter-Trend
As you can see from the chart above, the oscillator often moved from extreme high to extreme low. Extreme lows are usually anything below 20 and extreme highs are usually anything over 80. Extreme highs are deemed to be overbought markets ready for a turn lower and extreme lows are deemed to be oversold and due for a bounce higher.
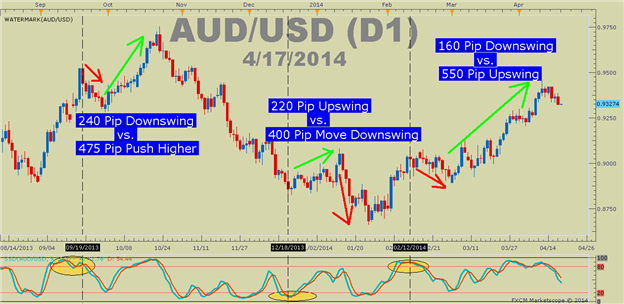
This chart brings a little more detail but the idea is clear. When you’re trading with an oscillator and you realize that price action is correcting disproportionally to the oscillator you’re trading against the trend. If you hold onto this type of trade then you could get steam-rolled when the oscillator unrolls back in the direction of the overall trend. Given the recent 500+ pip move in AUDUSD higher, if price unwinds disproportionally to the oscillator, then it may be best to get out of a short trade or consider rejoining the AUDUSD trend higher while managing your risk.
- Free trading apps
- Over 8,000 signals for copying
- Economic news for exploring financial markets
You agree to website policy and terms of use
Universal Oscillator:
The Universal Oscillator indicator can display Bears Power, Bulls Power, CCI, DeMarker, MACD, Momentum, RSI, Stochastic, William's Percent Range. Three modes of overbought / oversold levels: the constant, dynamic (MA), dynamic (Bollinger Bands). Three rendering mode: line, filling, histogram
Author: Serhii Ivanenko