Comparative analysis of 10 flat trading strategies
Alexander Fedosov | 14 August, 2018
Table of Contents
- Introduction
- Defining the task when creating a flat trading strategy
- Flat trading strategies
- Strategy #1. The Envelopes indicator with the MFI-based filter
- Strategy #2. Bollinger Bands and two Moving Averages
- Strategy #3. WSO & WRO Channel with a filter based on Fractal Dimension Ehlers
- Strategy #4. The Percentage Crossover Channel indicator and the TrendRange-based filter
- Strategy #5. The Price Channel indicator and the RBVI-based filter
- Strategy #6. The Williams Percent Range indicator and the ADX-based filter
- Strategy #7. Modified Keltner channel and the Magic Trend-based filter
- Strategy #8. Donchian channel with a confirmation by Trinity Impulse
- Strategy #9. The ATR Channel indicator and a filter based on CCI Color Levels
- Strategy #10. RSI histogram and a filter based on the Flat indicator
- Testing
- Findings
- Conclusion
Introduction
Trend following strategies are very popular and easy-to-use, especially for beginners. However, current markets have become more dynamic, while trend movements are less distinct (in terms of both range and duration). By not using the possibility of trading in flat or sideways markets, we lose potential profits. Trend following trading rules are simple: identify the signs of a trend and try to capitalize on it. Trading in flat periods differs much from that. During sideways movement, the price is in a small range and may stay unchanged for quite a long time. There is no directional movement in the market, and liquidity is low.
Defining the task when creating a flat trading strategy
In the previous article, I defined three tasks, which were required for creating a trend following strategy. Tasks required for the creation of flat trading strategies are very similar.
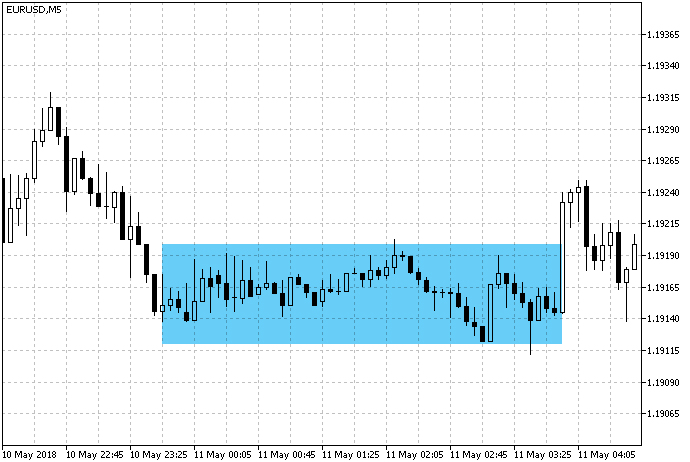
Fig. 1. Example of a sideways/flat movement.
Task 1. Identifying the presence of a flat period.
There is no general and exhaustive definition of a flat (actually there is no proper description of the concept of a trend). However, there can be certain indications of that the market is currently in a flat state. This movement is also called sideways, because there is no clear vertical movement both upwards and downwards. The price moves inside a range, approaching its lower and upper borders in waves. Another sign of a flat period can be low volume of trades in the market or low interest from market participants. This can be seen from a weak price change, as well as from the small tick volume.
Task 2. The targets of an open position.
Channel trading is often used in relation to flat trading techniques. This is the major method of using the sideways movement for the purpose of profiting. A flat channel is determined in some virtual borders. Further, the trading strategy is built based on relations between the price and the channel borders. Most often, the strategy implies buying or selling when the price bounces off the channel border (Fig. 2).
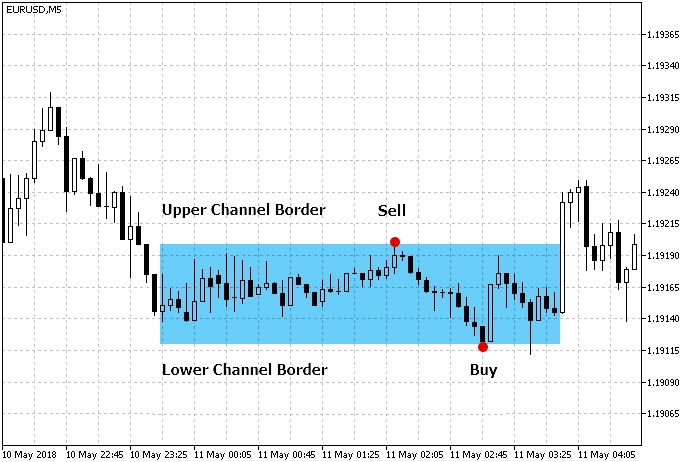
Fig. 2. Trading when price bounces off channel borders.
When selling in the upper part of the channel, we assume that the price will move towards the lower border. That will act as a take profit level. Stop loss can be set as a certain numerical value in points or in accordance with the channel border. A counter strategy is used for Buy operations: buying at the lower channel border and setting the take profit level near the upper border.
Flat trading strategies
I used the above principles when choosing flat trading strategies.
- Trading will be performed inside the channel. Therefore, we need to choose tools that will help us build a channel and determine the virtual borders of the flat zone.
- In addition to defining the channel, we need at least one more additional tool to confirm that the price will go in the right direction after rebounding from the channel border. The purpose of such a filter is to avoid false entry signals.
Strategy #1. The Envelopes indicator with the MFI-based filter
The channel borders are determined based on the Envelopes indicator. The MFI indicator is additionally used for filtering of signals.
| Indicator Parameter | Description |
|---|---|
| Used indicator | Envelopes |
| Used indicator | MFI |
| Timeframe | H1 |
| Buy conditions | The price reaches the lower channel border, and MFI is in the oversold zone (below 20) |
| Sell conditions | The price reaches the upper channel border, and MFI is in the overbought zone (above 80) |
| Exit conditions | The price reaches the opposite channel border |
Fig. 3 shows market entry conditions according to Strategy #1.
Fig. 3. Entry conditions for the flat trading Strategy #1
The code of the Expert Advisor trading this strategy is shown below:
void OnTick()
  {
//--- Checking orders previously opened by the EA
   if(!Trade.IsOpenedByMagic(Inp_MagicNum))
     {
      //--- Getting data for calculations
      if(!GetIndValue())
         return;
      //--- Opening an order if there is a buy signal
      if(BuySignal())
         Trade.BuyPositionOpen(Symbol(),Inp_Lot,close[0]-Inp_StopLoss*_Point,tp,Inp_MagicNum,Inp_EaComment);

      //--- Opening an order if there is a sell signal
      if(SellSignal())
         Trade.SellPositionOpen(Symbol(),Inp_Lot,close[0]+Inp_StopLoss*_Point,tp,Inp_MagicNum,Inp_EaComment);
     }
  }
//+------------------------------------------------------------------+
//| Buy conditions                                                   |
//+------------------------------------------------------------------+
bool BuySignal()
  {
   if(mfi[0]<20 && env_low[0]>close[0])
     {
      tp=env_high[0];
      return true;
     }
   else
      return false;
  }
//+------------------------------------------------------------------+
//| Sell conditions                                                  |
//+------------------------------------------------------------------+
bool SellSignal()
  {
   if(mfi[0]>80 && env_high[0]<close[0])
     {
      tp=env_low[0];
      return true;
     }
   else
      return false;
  }
//+------------------------------------------------------------------+
//| Getting the current values of indicators                         |
//+------------------------------------------------------------------+
bool GetIndValue()
  {
   return(CopyBuffer(InpInd_Handle1,0,0,2,mfi)<=0  ||
          CopyBuffer(InpInd_Handle2,1,0,2,env_low)<=0 ||
          CopyBuffer(InpInd_Handle2,0,0,2,env_high)<=0 ||
          CopyClose(Symbol(),PERIOD_CURRENT,0,2,close)<=0
          )?false:true;
  }
//+------------------------------------------------------------------+
Take Profit is set automatically in accordance with the set conditions, while Stop Loss is set manually depending on the timeframe.
Strategy #2. Bollinger Bands and two Moving Averages
Channel borders are determined using Bollinger Bands, and signals are filtered based on the relative position of the slow and fast MAs.
| Indicator Parameter | Description |
|---|---|
| Used indicator | Bollinger Bands |
| Used indicator | Moving Average |
| Timeframe | H1 |
| Buy conditions | The price reaches the lower channel border, the fast MA is above the slow one |
| Sell conditions | The price reaches the upper channel border, the fast MA is below the slow one |
| Exit conditions | The price reaches the opposite channel border |
Fig. 4 shows market entry conditions. The default periods of two SMAs are small: 4 and 8. Period values and smoothing methods are adjustable, so you can change the filtering sensitivity for Bollinger Bands signals.
Fig. 4. Entry conditions for the flat trading Strategy #2
Except for market entry conditions, strategy #2 is very similar to strategy #1.
void OnTick()
  {
//--- Checking orders previously opened by the EA
   if(!Trade.IsOpenedByMagic(Inp_MagicNum))
     {
      //--- Getting data for calculations
      if(!GetIndValue())
         return;
      //--- Opening an order if there is a buy signal
      if(BuySignal())
         Trade.BuyPositionOpen(Symbol(),Inp_Lot,close[0]-Inp_StopLoss*_Point,tp,Inp_MagicNum,Inp_EaComment);

      //--- Opening an order if there is a sell signal
      if(SellSignal())
         Trade.SellPositionOpen(Symbol(),Inp_Lot,close[0]+Inp_StopLoss*_Point,tp,Inp_MagicNum,Inp_EaComment);
     }
  }
//+------------------------------------------------------------------+
//| Buy conditions                                                   |
//+------------------------------------------------------------------+
bool BuySignal()
  {
   if(ma_slow[0]>ma_fast[0] && bb_low[0]>close[0])
     {
      tp=bb_up[0];
      return true;
     }
   else
      return false;
  }
//+------------------------------------------------------------------+
//| Sell conditions                                                  |
//+------------------------------------------------------------------+
bool SellSignal()
  {
   if(ma_slow[0]<ma_fast[0] && bb_up[0]<close[0])
     {
      tp=bb_low[0];
      return true;
     }
   else
      return false;
  }
//+------------------------------------------------------------------+
//| Getting the current values of indicators                         |
//+------------------------------------------------------------------+
bool GetIndValue()
  {
   return(CopyBuffer(InpInd_Handle1,1,0,2,bb_up)<=0  ||
          CopyBuffer(InpInd_Handle1,2,0,2,bb_low)<=0 ||
          CopyBuffer(InpInd_Handle2,0,0,2,ma_slow)<=0 ||
          CopyBuffer(InpInd_Handle3,0,0,2,ma_fast)<=0 ||
          CopyClose(Symbol(),PERIOD_CURRENT,0,2,close)<=0
          )?false:true;
  }
//+------------------------------------------------------------------+
Strategy #3. WSO & WRO Channel and Fractal Dimension Ehlers
The main signal indicator is WSO & WRO Channel, which is a channel based on two oscillators: WSO (Widner Support Oscillator) and WRO (Widner Resistance Oscillator). The idea of the indicator is based on the article "Automated Support and Resistance" by Mel Widner. To filter the signals, we will use the Fractal Dimension indicator, which was described in the article "Fractal Dimension as a Market Mode Sensor" by John F. Ehlers and Ric Way.
| Indicator Parameter | Description |
|---|---|
| Used indicator | WSO & WRO Channel |
| Used indicator | Fractal Dimension Ehlers |
| Timeframe | Any |
| Buy conditions | The price reaches the lower channel border, and the Fractal Dimension value is below the threshold |
| Sell conditions | The price reaches the upper channel border, and the Fractal Dimension value is below the threshold |
| Exit conditions | The price reaches the opposite channel border |
Fig. 5 shows market entry conditions. Similar to previous strategies, trading operations are performed when the price bounces off the channel borders. The filter helps find the entry points when the market is not trending.
Fig. 5. Entry conditions for the flat trading Strategy #3
The code of the Expert Advisor trading this strategy is shown below:
void OnTick()
  {
//--- Checking orders previously opened by the EA
   if(!Trade.IsOpenedByMagic(Inp_MagicNum))
     {
      //--- Getting data for calculations
      if(!GetIndValue())
         return;
      //--- Opening an order if there is a buy signal
      if(BuySignal())
         Trade.BuyPositionOpen(Symbol(),Inp_Lot,close[0]-Inp_StopLoss*_Point,tp,Inp_MagicNum,Inp_EaComment);

      //--- Opening an order if there is a sell signal
      if(SellSignal())
         Trade.SellPositionOpen(Symbol(),Inp_Lot,close[0]+Inp_StopLoss*_Point,tp,Inp_MagicNum,Inp_EaComment);
     }
  }
//+------------------------------------------------------------------+
//| Buy conditions                                                   |
//+------------------------------------------------------------------+
bool BuySignal()
  {
   if(wwc_low[0]>close[0] && fdi[0]<Inp_FdiThreshold)
     {
      tp=wwc_up[0];
      return true;
     }
   else
      return false;
  }
//+------------------------------------------------------------------+
//| Sell conditions                                                  |
//+------------------------------------------------------------------+
bool SellSignal()
  {
   if(wwc_up[0]<close[0] && fdi[0]<Inp_FdiThreshold)
     {
      tp=wwc_low[0];
      return true;
     }
   else
      return false;
  }
//+------------------------------------------------------------------+
//| Getting the current values of indicators                         |
//+------------------------------------------------------------------+
bool GetIndValue()
  {
   return(CopyBuffer(InpInd_Handle1,3,0,2,wwc_up)<=0  ||
          CopyBuffer(InpInd_Handle1,2,0,2,wwc_low)<=0 ||
          CopyBuffer(InpInd_Handle2,0,0,2,fdi)<=0 ||
          CopyClose(Symbol(),PERIOD_CURRENT,0,2,close)<=0
          )?false:true;
  }
//+------------------------------------------------------------------+
Strategy #4. The Percentage Crossover Channel indicator and the TrendRange-based filter
In this case, the channel is built at the breakout of levels by a certain percentage. We need an indicator building the channel, search for points where the price bounces off the channel borders and a signals filter. We will use the TrendRange indicator, which shows both trend and flat states. The states will be applied for filtering signals.
| Indicator Parameter | Description |
|---|---|
| Used indicator | Percentage Crossover Channel |
| Used indicator | Trend Range |
| Timeframe | Any |
| Buy conditions | The price reaches the lower channel border, and the Trend Range histogram is gray |
| Sell conditions | The price reaches the upper channel border, and the Trend Range histogram is gray |
| Exit conditions | The price reaches the opposite channel border |
Market entry conditions are shown in fig.6. The Percentage Crossover indicator has a number of specific features. The Percent parameter is the limit distance, after breaking which a new level construction begins, and the parameter is timeframe dependent. A smaller percent should be set on lower timeframes. For example, the recommended value for the hourly timeframe is 20 — 30. Higher values result in excessive selectivity of the indicator.
Fig. 6. Entry conditions for the flat trading Strategy #4
The strategy code is shown below:
void OnTick()
  {
//--- Checking orders previously opened by the EA
   if(!Trade.IsOpenedByMagic(Inp_MagicNum))
     {
      //--- Getting data for calculations
      if(!GetIndValue())
         return;
      //--- Opening an order if there is a buy signal
      if(BuySignal())
         Trade.BuyPositionOpen(Symbol(),Inp_Lot,close[0]-Inp_StopLoss*_Point,tp,Inp_MagicNum,Inp_EaComment);

      //--- Opening an order if there is a sell signal
      if(SellSignal())
         Trade.SellPositionOpen(Symbol(),Inp_Lot,close[0]+Inp_StopLoss*_Point,tp,Inp_MagicNum,Inp_EaComment);
     }
  }
//+------------------------------------------------------------------+
//| Buy conditions                                                   |
//+------------------------------------------------------------------+
bool BuySignal()
  {
   if(pcc_low[0]>close[0] && tr_flat[0]>tr_range[0])
     {
      tp=pcc_up[0];
      return true;
     }
   else
      return false;
  }
//+------------------------------------------------------------------+
//| Sell conditions                                                  |
//+------------------------------------------------------------------+
bool SellSignal()
  {
   if(pcc_up[0]<close[0] && tr_flat[0]>tr_range[0])
     {
      tp=pcc_low[0];
      return true;
     }
   else
      return false;
  }
//+------------------------------------------------------------------+
//| Getting the current values of indicators                         |
//+------------------------------------------------------------------+
bool GetIndValue()
  {
   return(CopyBuffer(InpInd_Handle1,0,0,2,pcc_up)<=0  ||
          CopyBuffer(InpInd_Handle1,2,0,2,pcc_low)<=0 ||
          CopyBuffer(InpInd_Handle2,1,0,2,tr_flat)<=0 ||
          CopyBuffer(InpInd_Handle2,2,0,2,tr_range)<=0 ||
          CopyClose(Symbol(),PERIOD_CURRENT,0,2,close)<=0
          )?false:true;
  }
//+------------------------------------------------------------------+
Strategy #5. The Price Channel indicator and the RBVI-based filter
The Price Channel indicator builds the channel, whose upper and lower borders are determined by the highest and the lowest prices over the period. False signals will be filtered out by RBVI, which determines the presence of a flat period in the market.
| Indicator Parameter | Description |
|---|---|
| Used indicator | Price Channel |
| Used indicator | RBVI |
| Timeframe | Any |
| Buy conditions | The price reaches the lower channel border, and the RBVI value is below the threshold |
| Sell conditions | The price reaches the upper channel border, and the RBVI value is below the threshold |
| Exit conditions | The price reaches the opposite channel border |
Entry conditions are shown in fig.7. RBVI threshold value is 40. The value can be changed in the Expert Advisor parameters.
Fig. 7. Entry conditions for the flat trading Strategy #5
Here is the code of the strategy:
void OnTick()
  {
//--- Checking orders previously opened by the EA
   if(!Trade.IsOpenedByMagic(Inp_MagicNum))
     {
      //--- Getting data for calculations
      if(!GetIndValue())
         return;

      //--- Opening an order if there is a buy signal
      if(BuySignal())
         Trade.BuyPositionOpen(Symbol(),Inp_Lot,close[0]-Inp_StopLoss*_Point,tp,Inp_MagicNum,Inp_EaComment);

      //--- Opening an order if there is a sell signal
      if(SellSignal())
         Trade.SellPositionOpen(Symbol(),Inp_Lot,close[0]+Inp_StopLoss*_Point,tp,Inp_MagicNum,Inp_EaComment);
     }
  }
//+------------------------------------------------------------------+
//| Buy conditions                                                   |
//+------------------------------------------------------------------+
bool BuySignal()
  {
   if(pc_low[0]>close[0] && rbvi[0]<=Inp_level)
     {
      tp=pc_up[0];
      return true;
     }
   else
      return false;
  }
//+------------------------------------------------------------------+
//| Sell conditions                                                  |
//+------------------------------------------------------------------+
bool SellSignal()
  {
   if(pc_up[0]<close[0] && rbvi[0]<=Inp_level)
     {
      tp=pc_low[0];
      return true;
     }
   else
      return false;
  }
//+------------------------------------------------------------------+
//| Getting the current values of indicators                         |
//+------------------------------------------------------------------+
bool GetIndValue()
  {
   return(CopyBuffer(InpInd_Handle1,0,0,2,pc_up)<=0  ||
          CopyBuffer(InpInd_Handle1,1,0,2,pc_low)<=0 ||
          CopyBuffer(InpInd_Handle2,0,0,2,rbvi)<=0 ||
          CopyClose(Symbol(),PERIOD_CURRENT,0,2,close)<=0
          )?false:true;
  }
//+------------------------------------------------------------------+
Strategy #6. The Williams Percent Range indicator and the ADX-based filter
Williams's Percent Range determining the overbought/oversold state is used for finding entry points. Since our purpose is to trade in flat period or when the price is supposed to return to a certain range, let's use the trend indicator ADX in order to determine the absence of a directional movement.
| Indicator Parameter | Description |
|---|---|
| Used indicator | Williams Percent Range |
| Used indicator | ADX |
| Timeframe | Any |
| Buy conditions | The WPR indicator is in the oversold zone (below -80) and the ADX value is below the threshold. |
| Sell conditions | The WPR indicator is in the overbought zone (above -20) and the ADX value is below the threshold. |
| Exit conditions | Take Profit/Stop Loss |
As can be seen in Fig. 8, the default flat area by ADX is set to 30. The value can be customized in the Expert Advisor code.
Fig. 8. Entry conditions for the flat trading Strategy #6
The strategy implementation is provided in the below listing. Here the Inp_FlatLevel variable sets the above mentioned ADX threshold value.
void OnTick()
  {
//--- Checking orders previously opened by the EA
   if(!Trade.IsOpenedByMagic(Inp_MagicNum))
     {
      //--- Getting data for calculations
      if(!GetIndValue())
         return;

      //--- Opening an order if there is a buy signal
      if(BuySignal())
         Trade.BuyPositionOpen(Symbol(),Inp_Lot,Inp_StopLoss,Inp_TakeProfit,Inp_MagicNum,Inp_EaComment);

      //--- Opening an order if there is a sell signal
      if(SellSignal())
         Trade.SellPositionOpen(Symbol(),Inp_Lot,Inp_StopLoss,Inp_TakeProfit,Inp_MagicNum,Inp_EaComment);
     }
  }
//+------------------------------------------------------------------+
//| Buy conditions                                                   |
//+------------------------------------------------------------------+
bool BuySignal()
  {
   return(wpr[0]<-80 && adx[0]<Inp_FlatLevel)?true:false;
  }
//+------------------------------------------------------------------+
//| Sell conditions                                                  |
//+------------------------------------------------------------------+
bool SellSignal()
  {
   return(wpr[0]>=-20 && adx[0]<Inp_FlatLevel)?true:false;
  }
//+------------------------------------------------------------------+
//| Getting the current values of indicators                         |
//+------------------------------------------------------------------+
bool GetIndValue()
  {
   return(CopyBuffer(InpInd_Handle1,0,0,2,wpr)<=0  ||
          CopyBuffer(InpInd_Handle2,0,0,2,adx)<=0)?false:true;
  }
//+------------------------------------------------------------------+
Strategy #7. Modified Keltner channel and the Magic Trend-based filter
Price's bouncing off the Keltner channel is checked using the Magic Trend indicator, which should identify flat zones.
| Indicator Parameter | Description |
|---|---|
| Used indicator | Modified Keltner Channel |
| Used indicator | Magic Trend |
| Timeframe | Any |
| Buy conditions | The price reaches the lower channel border and the Magic Trend line is gray |
| Sell conditions | The price reaches the upper channel border and the Magic Trend line is gray |
| Exit conditions | The price reaches the opposite channel border |
This trading strategy is visualized in figure 9. The Magic Trend value is not changed during flat, i.e. it is shown as a gray horizontal line. Hence, in addition to price's reaching the channel border, we check the condition of Magic Trend, which should be in a flat state for some time. This check will be implemented as a comparison of values on the current bar and the previous one - they should be the same.
Fig. 9. Entry conditions for the flat trading Strategy #7.
The code contains functions checking Buy/Sell conditions:
void OnTick()
  {
//--- Checking orders previously opened by the EA
   if(!Trade.IsOpenedByMagic(Inp_MagicNum))
     {
      //--- Getting data for calculations
      if(!GetIndValue())
         return;

      //--- Opening an order if there is a buy signal
      if(BuySignal())
         Trade.BuyPositionOpen(Symbol(),Inp_Lot,close[0]-Inp_StopLoss*_Point,tp,Inp_MagicNum,Inp_EaComment);

      //--- Opening an order if there is a sell signal
      if(SellSignal())
         Trade.SellPositionOpen(Symbol(),Inp_Lot,close[0]+Inp_StopLoss*_Point,tp,Inp_MagicNum,Inp_EaComment);
     }
  }
//+------------------------------------------------------------------+
//| Buy conditions                                                   |
//+------------------------------------------------------------------+
bool BuySignal()
  {
   if(kc_low[0]>close[0] && mt[0]==mt[1])
     {
      tp=kc_up[0];
      return true;
     }
   else
      return false;
  }
//+------------------------------------------------------------------+
//| Sell conditions                                                  |
//+------------------------------------------------------------------+
bool SellSignal()
  {
   if(kc_up[0]<close[0] && mt[0]==mt[1])
     {
      tp=kc_low[0];
      return true;
     }
   else
      return false;
  }
//+------------------------------------------------------------------+
//| Getting the current values of indicators                         |
//+------------------------------------------------------------------+
bool GetIndValue()
  {
   return(CopyBuffer(InpInd_Handle1,0,0,2,kc_up)<=0  ||
          CopyBuffer(InpInd_Handle1,2,0,2,kc_low)<=0 ||
          CopyBuffer(InpInd_Handle2,0,0,2,mt)<=0 ||
          CopyClose(Symbol(),PERIOD_CURRENT,0,2,close)<=0
          )?false:true;
  }
//+------------------------------------------------------------------+
Strategy #8. Donchian channel with a confirmation by Trinity Impulse
In this case, we try to catch the moments when the price bounces off the Donchian channel borders, while the Trinity Impulse indicator is in the sideways movement state.
| Indicator Parameter | Description |
|---|---|
| Used indicator | Donchian Channel |
| Used indicator | Trinity Impulse |
| Timeframe | Lower timeframes |
| Buy conditions | The price reaches the lower channel border, the Trinity Impulse value is zero |
| Sell conditions | The price reaches the upper channel border, the Trinity Impulse value is zero |
| Exit conditions | The price reaches the opposite channel border |
Market entries are shown in figure 10. The strategy is not recommended for use on higher timeframes, because the Trinity Impulse filter shows jig saw behavior, while the display of flat zones is lagging. Their width is very small, and this makes the strategy too selective. Optimally use 5 to 30-minute timeframes.
Fig. 10. Entry conditions for the flat trading Strategy #8.
Implementation of the Expert Advisor based on the above strategy:
void OnTick()
  {
//--- Checking orders previously opened by the EA
   if(!Trade.IsOpenedByMagic(Inp_MagicNum))
     {
      //--- Getting data for calculations
      if(!GetIndValue())
         return;

      //--- Opening an order if there is a buy signal
      if(BuySignal())
         Trade.BuyPositionOpen(Symbol(),Inp_Lot,close[0]-Inp_StopLoss*_Point,tp,Inp_MagicNum,Inp_EaComment);

      //--- Opening an order if there is a sell signal
      if(SellSignal())
         Trade.SellPositionOpen(Symbol(),Inp_Lot,close[0]+Inp_StopLoss*_Point,tp,Inp_MagicNum,Inp_EaComment);
     }
  }
//+------------------------------------------------------------------+
//| Buy conditions                                                   |
//+------------------------------------------------------------------+
bool BuySignal()
  {
   if(dc_low[0]>close[0] && ti[0]==0)
     {
      tp=dc_up[0];
      return true;
     }
   else
      return false;
  }
//+------------------------------------------------------------------+
//| Sell conditions                                                  |
//+------------------------------------------------------------------+
bool SellSignal()
  {
   if(dc_up[0]<close[0] && ti[0]==0)
     {
      tp=dc_low[0];
      return true;
     }
   else
      return false;
  }
//+------------------------------------------------------------------+
//| Getting the current values of indicators                         |
//+------------------------------------------------------------------+
bool GetIndValue()
  {
   return(CopyBuffer(InpInd_Handle1,0,0,2,dc_up)<=0  ||
          CopyBuffer(InpInd_Handle1,1,0,2,dc_low)<=0 ||
          CopyBuffer(InpInd_Handle2,0,0,2,ti)<=0 ||
          CopyClose(Symbol(),PERIOD_CURRENT,0,2,close)<=0
          )?false:true;
  }
//+------------------------------------------------------------------+
Strategy #9. The ATR Channel indicator and a filter based on CCI Color Levels
ATR Channel is based on ATR deviations from a moving average. CCI Color Levels is a CCI indicator displayed as a histogram of threshold values, which indicate price movement. We use this indicator to filter the channel's flat state (when CCI is between the threshold values).
| Indicator Parameter | Description |
|---|---|
| Used indicator | ATR Channel |
| Used indicator | CCI Color Levels |
| Timeframe | Any |
| Buy conditions | The price reaches the lower channel border, and the CCI Color Levels value is in the range between the thresholds |
| Sell conditions | The price reaches the upper channel border, and the CCI Color Levels value is in the range between the thresholds |
| Exit conditions | The price reaches the opposite channel border |
Fig. 11 shows the market entry. In some cases, the price may exit the channel, but the CCI-based filter in the specified range suggests that the price may return to the channel and reach the set Take Profit value.
Fig. 11. Entry conditions for the flat trading Strategy #9.
The code of the Expert Advisor trading this strategy:
void OnTick()
  {
//--- Checking orders previously opened by the EA
   if(!Trade.IsOpenedByMagic(Inp_MagicNum))
     {
      //--- Getting data for calculations
      if(!GetIndValue())
         return;

      //--- Opening an order if there is a buy signal
      if(BuySignal())
         Trade.BuyPositionOpen(Symbol(),Inp_Lot,close[0]-Inp_StopLoss*_Point,tp,Inp_MagicNum,Inp_EaComment);

      //--- Opening an order if there is a sell signal
      if(SellSignal())
         Trade.SellPositionOpen(Symbol(),Inp_Lot,close[0]+Inp_StopLoss*_Point,tp,Inp_MagicNum,Inp_EaComment);
     }
  }
//+------------------------------------------------------------------+
//| Buy conditions                                                   |
//+------------------------------------------------------------------+
bool BuySignal()
  {
   if(atr_low[0]>close[0] && cci[0]<Inp_CCI_LevelUP && cci[0]>Inp_CCI_LevelDOWN)
     {
      tp=atr_up[0];
      return true;
     }
   else
      return false;
  }
//+------------------------------------------------------------------+
//| Sell conditions                                                  |
//+------------------------------------------------------------------+
bool SellSignal()
  {
   if(atr_up[0]<close[0] && cci[0]<Inp_CCI_LevelUP && cci[0]>Inp_CCI_LevelDOWN)
     {
      tp=atr_low[0];
      return true;
     }
   else
      return false;
  }
//+------------------------------------------------------------------+
//| Getting the current values of indicators                         |
//+------------------------------------------------------------------+
bool GetIndValue()
  {
   return(CopyBuffer(InpInd_Handle1,1,0,2,atr_up)<=0  ||
          CopyBuffer(InpInd_Handle1,2,0,2,atr_low)<=0 ||
          CopyBuffer(InpInd_Handle2,2,0,2,cci)<=0 ||
          CopyClose(Symbol(),PERIOD_CURRENT,0,2,close)<=0
          )?false:true;
  }
//+------------------------------------------------------------------+
Strategy #10. RSI histogram and a filter based on the Flat indicator
RSI in the form of a histogram provides a better visualization, since the main market entry signals are generated in its overbought/oversold zones. Flat is used to filter out false signals.
| Indicator Parameter | Description |
|---|---|
| Used indicator | RSI_Histogram |
| Used indicator | Flat |
| Timeframe | Any |
| Buy conditions | RSI is in the oversold zone (below the threshold) and Flat is in the flat zone. |
| Sell conditions | RSI is in the overbought zone (above the threshold) and Flat is in the flat zone. |
| Exit conditions | Take Profit/Stop Loss |
Entry points are shown in figure 12. The histogram form of RSI provides for an easier tracking of overbought/oversold zones and of the Flat filter's flat zone.
Fig. 12. Entry conditions for the flat trading Strategy #10.
Implementation of the Expert Advisor based on the above strategy is available in the following code:
void OnTick()
  {
//--- Checking orders previously opened by the EA
   if(!Trade.IsOpenedByMagic(Inp_MagicNum))
     {
      //--- Getting data for calculations
      if(!GetIndValue())
         return;

      //--- Opening an order if there is a buy signal
      if(BuySignal())
         Trade.BuyPositionOpen(Symbol(),Inp_Lot,Inp_StopLoss,Inp_TakeProfit,Inp_MagicNum,Inp_EaComment);

      //--- Opening an order if there is a sell signal
      if(SellSignal())
         Trade.SellPositionOpen(Symbol(),Inp_Lot,Inp_StopLoss,Inp_TakeProfit,Inp_MagicNum,Inp_EaComment);
     }
  }
//+------------------------------------------------------------------+
//| Buy conditions                                                   |
//+------------------------------------------------------------------+
bool BuySignal()
  {
   return(rsi[0]<Inp_LowLevel && fl[0]<Inp_FLowLevel)?true:false;
  }
//+------------------------------------------------------------------+
//| Sell conditions                                                  |
//+------------------------------------------------------------------+
bool SellSignal()
  {
   return(rsi[0]>Inp_HighLevel && fl[0]<Inp_FLowLevel)?true:false;
  }
//+------------------------------------------------------------------+
//| Getting the current values of indicators                         |
//+------------------------------------------------------------------+
bool GetIndValue()
  {
   return(CopyBuffer(InpInd_Handle1,0,0,2,rsi)<=0  ||
          CopyBuffer(InpInd_Handle2,0,0,2,fl)<=0)?false:true;
  }
//+------------------------------------------------------------------+
Testing
Now, that we have defined 10 flat trading strategies and implemented them in the code, let's select common testing conditions.
- Testing interval: Last year.
- Currency pair: EURUSD.
- Trading mode: No delay (These are not high-frequency trading strategies, so the effect of delays would be very small).
- Testing: M1 OHLC (Pre-testing on real ticks shows nearly the same results).
- Initial deposit: 1000 USD.
- Leverage: 1:500.
- Server: MetaQuotes-Demo.
- Quotes: 5-digit.
Strategy #1 Test (the Envelopes indicator with the MFI based filter)
Preset:
input int                  Inp_StopLoss=500;                            //Stop Loss(points)

//--- MFI indicator parameters
input ENUM_APPLIED_VOLUME  Inp_applied_volume=VOLUME_TICK;              // MFI volume type
input int                  Inp_MFI_period=10;                           // MFI period
//--- Envelopes indicator parameters
input int                  Inp_ma_period=10;                            // Envelopes MA period
input ENUM_MA_METHOD       Inp_ma_method=MODE_SMA;                      // Envelopes smoothing type
input double               Inp_deviation=0.1;                           // deviation of borders from the Envelopes MA
Testing results:
Fig. 13. Flat Strategy #1. Testing results.
Strategy #2 Test (Bollinger Bands and two Moving Averages)
Preset:
input int                  Inp_StopLoss=450;                            //Stop Loss(points)

//--- Bollinger Bands parameters
input int                  Inp_BBPeriod=14;                             //BB period
input double               Inp_deviation=2.0;                           //Deviation
//--- MA slow parameters
input int                  Inp_ma_period1=12;                           //MA slow period
input ENUM_MA_METHOD       Inp_ma_method1=MODE_SMMA;                    //MA slow smoothing method
//--- MA fast parameters
input int                  Inp_ma_period2=2;                            //MA fast period
input ENUM_MA_METHOD       Inp_ma_method2=MODE_LWMA;                    //MA fast smoothing method
Testing results:
Fig. 14. Flat Strategy #2. Testing results.
Strategy #3 Test (WSO & WRO Channel with a filter based on Fractal Dimension Ehlers)
Preset:
input int                  Inp_StopLoss=500;                            //Stop Loss(points)

//--- WSO & WRO Channel parameters
input int                  Inp_WsoWroPeriod=16;                         //Wso & Wro Channel period
//--- Fractal Dimension Ehlers parameters
input int                  Inp_FdiPeriod    =  18;                      //Fractal dimension period
input double               Inp_FdiThreshold =  1.4;                     //Fractal dimension threshold
input ENUM_APPLIED_PRICE   Inp_Price        = PRICE_CLOSE;              //Applied price
Testing results:
Fig. 15. Flat Strategy #3. Testing results.
Strategy #4 Test (the Percentage Crossover Channel indicator and the TrendRange based filter)
Preset:
input int                  Inp_StopLoss=500;                            //Stop Loss(points)

//--- Percentage_Crossover_Channel parameters
input double               Inp_Percent=26.0;                            //Percentage of the limit distance
input ENUM_APPLIED_PRICE   Inp_Price=PRICE_CLOSE;                       //Applied price
//--- Trend Range indicator parameters
input uint                 Inp_PeriodTR    =  14;                       //Trend Range period
input ENUM_MA_METHOD       Inp_Method      =  MODE_EMA;                 //Smoothing method
input double               Inp_Deviation   =  1.0;                      //Deviation
Testing results:
Fig.16. Flat Strategy #4. Testing results.
Strategy #5 Test (the Price Channel indicator and the RBVI based filter)
Preset:
input int                  Inp_StopLoss=450;                            //Stop Loss(points)

//--- Price Channel indicator parameters
input int                  Inp_ChannelPeriod=12;                        //Period
//--- RBVI indicator parameters
input int                  Inp_RBVIPeriod=5;                            //RBVI period
input ENUM_APPLIED_VOLUME  Inp_VolumeType=VOLUME_TICK;                  //volume
input double               Inp_level=40;                                //flat level
Testing results:
Fig. 17. Flat Strategy #5. Testing results.
Strategy #6 Test (the Williams Percent Range indicator and the ADX based filter)
Preset:
input int                  Inp_StopLoss=50;                             //Stop Loss(points)
input int                  Inp_TakeProfit=50;                           //Take Profit(points)

//--- WPR indicator parameters
input int                  Inp_WPRPeriod=10;                            //Period of WPR
//--- ADX indicator parameter
input int                  Inp_ADXPeriod=14;                            //Period of ADX
input int                  Inp_FlatLevel=40;                            //Flat Level of ADX
Testing results:
Fig. 18. Flat Strategy #6. Testing results.
Strategy #7 Test (Modified Keltner channel and the Magic Trend based filter)
Preset:
input int                     Inp_SmoothCenter      =  11;              // Number of the periods to smooth the center line
input int                     Inp_SmoothDeviation   =  12;              // Number of periods to smooth deviation
input double                  Inp_F                 =  1.0;             // Factor which is used to apply the deviation
input ENUM_APPLIED_PRICE      Inp_AppliedPrice      =  PRICE_CLOSE;     // The center line applied price:
input ENUM_MA_METHOD          Inp_MethodSmoothing   =  MODE_SMA;        // The center line smoothing method
input ENUM_METHOD_VARIATION   Inp_MethodVariation   =  METHOD_HL;       // Variation Method
//--- Magic Trend indicator parameters
input uint                    Inp_PeriodCCI   =  60;                    // CCI period
input uint                    Inp_PeriodATR   =  5;                     // ATR period
Testing results:
Fig. 19. Flat Strategy #7. Testing results.
Strategy #8 Test (Donchian channel with a confirmation by Trinity Impulse)
Preset:
input int                  Inp_StopLoss=500;                            //Stop Loss(points)

//--- Donchian channel parameters
input int                  Inp_ChannelPeriod=12;                        //Donchian period
//--- Trinity Impulse indicator parameters
input int                  Inp_Period= 5;                               //Indicator period
input int                  Inp_Level= 34;                               //Smoothing level
input ENUM_MA_METHOD       Inp_Type=MODE_LWMA;                          //Averaging type
input ENUM_APPLIED_PRICE   Inp_Price=PRICE_WEIGHTED;                    //Price
input ENUM_APPLIED_VOLUME  Inp_Volume=VOLUME_TICK;                      //Volume type
Testing results:
Fig. 20. Flat Strategy #8. Testing results.
Strategy #9 Test (the ATR Channel indicator and a filter based on CCI Color Levels)
Preset:
//--- ATR Channel parameters
input ENUM_MA_METHOD       Inp_MA_Method=MODE_SMA;                      //MA smoothing method
input uint                 Inp_MA_Period=10;                            //MA period
input uint                 Inp_ATR_Period=12;                           //ATR period
input double               Inp_Factor=1.5;                              //Number of deviations
input ENUM_APPLIED_PRICE   Inp_IPC=PRICE_LOW;                           //Applied price
input int                  Inp_Shift=0;                                 //Horizontal shift of the indicator in bars
//--- CCI Color Levels parameters
input int                  Inp_CCI_ma_period = 14;                      // Averaging period
input double               Inp_CCI_LevelUP   = 90;                      // Level UP
input double               Inp_CCI_LevelDOWN =-90;                      // Level DOWN
Testing results:
Fig. 21. Flat Strategy #9. Testing results.
Strategy #10 Test (RSI histogram and a filter based on the Flat indicator)
Preset:
//--- RSI Histogram parameters
input uint                 Inp_RSIPeriod=12;                            // indicator period
input ENUM_APPLIED_PRICE   Inp_RSIPrice=PRICE_CLOSE;                    // price
input uint                 Inp_HighLevel=60;                            // overbought level
input uint                 Inp_LowLevel=40;                             // oversold level
input int                  Inp_Shift=0;                                 // horizontal shift of the indicator in bars
//--- Flat indicator parameters
input uint                 Inp_Smooth=10;                               // Smoothing period
input ENUM_MA_METHOD       Inp_ma_method=MODE_SMA;                      // Smoothing type
input ENUM_APPLIED_PRICE   Inp_applied_price=PRICE_CLOSE;               // Price type
input uint                 Inp_HLRef=100;
input int                  Inp_FShift=0;                                // Horizontal shift of the indicator in bars
input uint                 Inp_ExtraHighLevel=70;                       // Maximum trend level
input uint                 Inp_FHighLevel=50;                           // Strong trend level
input uint                 Inp_FLowLevel=30;                            // Weak trend level
Testing results:
Fig. 22. Flat Strategy #10. Testing results.
Findings
Testing and optimization of the analyzed strategies for trading the sideways market have produced the following results.
- Most of the strategies are based on trading inside a channel and include signal filtering, so their main weak point is a short-term channel breakout.
- Testing on very low and very high timeframes resulted in losses due to frequent market entry conditions and due to an extreme selectivity, respectively.
- No significant deviations in returns were obtained during optimization on the same currency pair and period of time. Almost all strategies showed similar results.
Thus, we can draw the main conclusion: although we selected different channel building techniques and filters, the advantages and disadvantages of all strategies are comparable.
Conclusion
Below is a summary table of the names of Expert Advisors, which were developed and used in this article, as well as auxiliary classes and a list of indicators used in the above strategies. The archive attached below contains all described files properly arranged into folders. For their proper operation, you only need to save the MQL5 folder into the terminal folder.
Programs used in the article:
| # |
Name |
Type |
Description |
|---|---|---|---|
| 1 |
Strategy_1.mq5 |
Expert Advisor |
Strategy #1. The Envelopes indicator with the MFI-based filter |
| 2 |
Strategy_2.mql5 |
Expert Advisor |
Strategy #2. Bollinger Bands and two Moving Averages |
| 3 |
Strategy_3.mq5 |
Expert Advisor | Strategy #3. WSO & WRO Channel with a filter based on Fractal Dimension Ehlers |
| 4 |
Strategy_4.mq5 |
Expert Advisor |
Strategy #4. The Percentage Crossover Channel indicator and the TrendRange-based filter |
| 5 |
Strategy_5.mq5 | Expert Advisor | Strategy #5. The Price Channel indicator and the RBVI-based filter |
| 6 |
Strategy_6.mq5 |
Expert Advisor |
Strategy #6. The Williams Percent Range indicator and the ADX-based filter |
| 7 | Strategy_7.mq5 |
Expert Advisor |
Strategy #7. Modified Keltner channel and the Magic Trend-based filter |
| 8 | Strategy_8.mq5 | Expert Advisor | Strategy #8. Donchian channel with a confirmation by Trinity Impulse |
| 9 | Strategy_9.mq5 | Expert Advisor | Strategy #9. The ATR Channel indicator and a filter based on CCI Color Levels |
| 10 | Strategy_10.mq5 | Expert Advisor | Strategy #10. RSI histogram and a filter based on the Flat indicator |
| 11 | Trade.mqh | Library | A class of trading functions |
| 13 | wwc.mq5 | Indicator | Used in Strategy #3 |
| 14 | fdi.mq5 | Indicator | Used in Strategy #3 |
| 15 | pcc.mq5 | Indicator | Used in Strategy #4 |
| 16 | trend_range.mq5 | Indicator | Used in Strategy #4 |
| 17 | price_channel.mq5 | Indicator | Used in Strategy #5 |
| 18 | rbvi.mq5 | Indicator | Used in Strategy #5 |
| 19 | customizable _keltner.mq5 | Indicator | Used in Strategy #7 |
| 20 | magic_trend.mq5 | Indicator | Used in Strategy #7 |
| 21 | donchian_channel.mq5 | Indicator | Used in Strategy #8 |
| 22 | trinity_impulse.mq5 | Indicator | Used in Strategy #8 |
| 23 | atr_channel.mq5 | Indicator | Used in Strategy #9 |
| 24 | cci_color_levels.mq5 | Indicator | Used in Strategy #9 |
| 25 | rsi_histogram.mq5 | Indicator | Used in Strategy #10 |
| 26 | flat.mq5 | Indicator | Used in Strategy #10 |