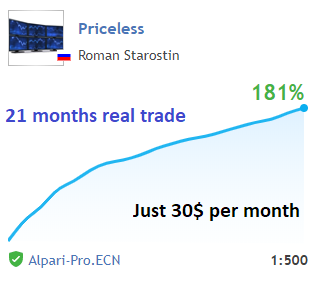
Roman Starostin
- Forex Programmer in davinci-fx.com
- Russische Föderation
- 6749
|
11+ Jahre
Erfahrung
|
9
Produkte
|
347
Demoversionen
|
|
0
Jobs
|
1
Signale
|
109
Abonnenten
|
Hi! I am a Forex trader with over 12 years of experience. Mostly I am engaged in the study of new methods of trading in the foreign exchange market, as well as programming expert advisors and indicators.
Forex for me is a job and a hobby that gives me pleasure. My colleagues and I are jointly developing profitable trading EA, some of which I offer on this site, and some of which I provide as signals.
We are also actively developing our website about Forex davinci-fx.com, where we offer free programs, lessons on the MQL4 language, books, articles for beginners and more.
Join now!


Roman Starostin


· 6
Marouane Majid
2019.02.16
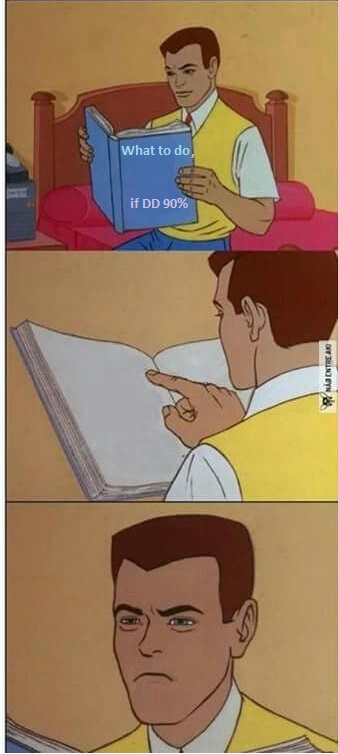
Add funds and pray for the reverse of the trend ! And always invest only the money that you're realy ready to lose