• Information
nein
Erfahrung
0
Produkte
0
Demoversionen
0
Jobs
1
Signale
1
Abonnenten
Piyush Lalsingh Ratnu
A Dow buy signal says Warren Buffett’s gold stake came too late for the precious metal: CNBC

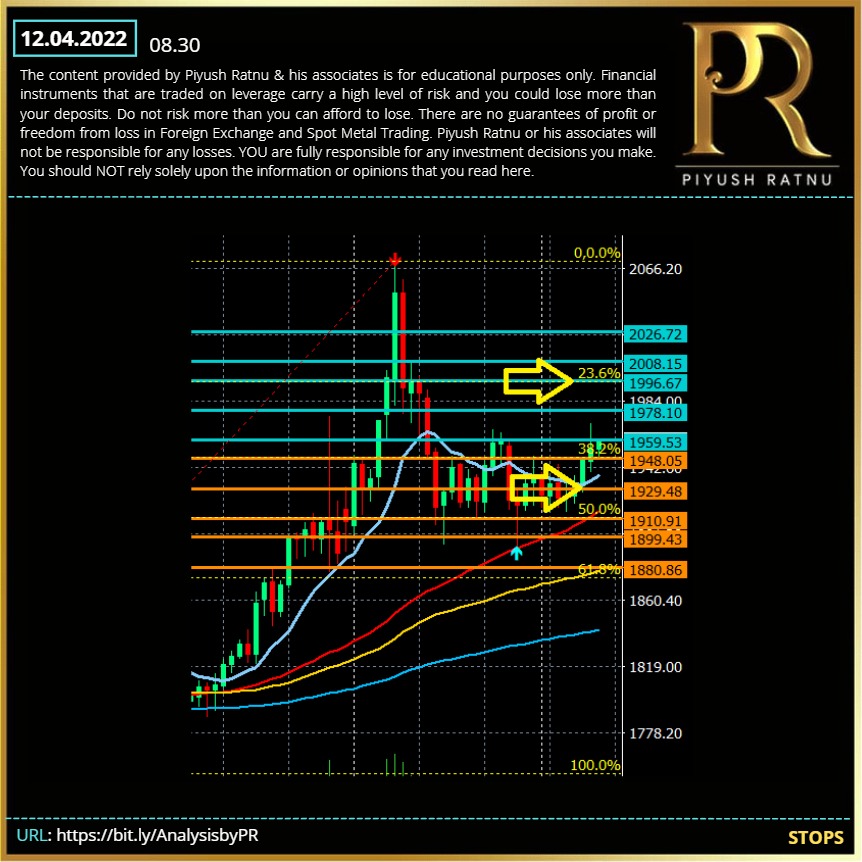
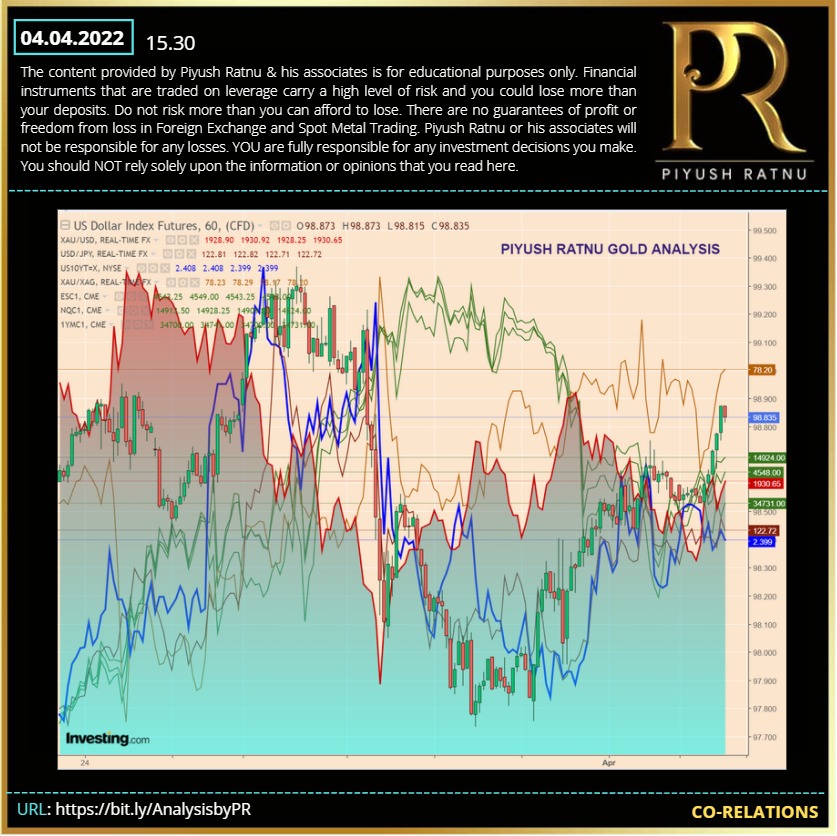
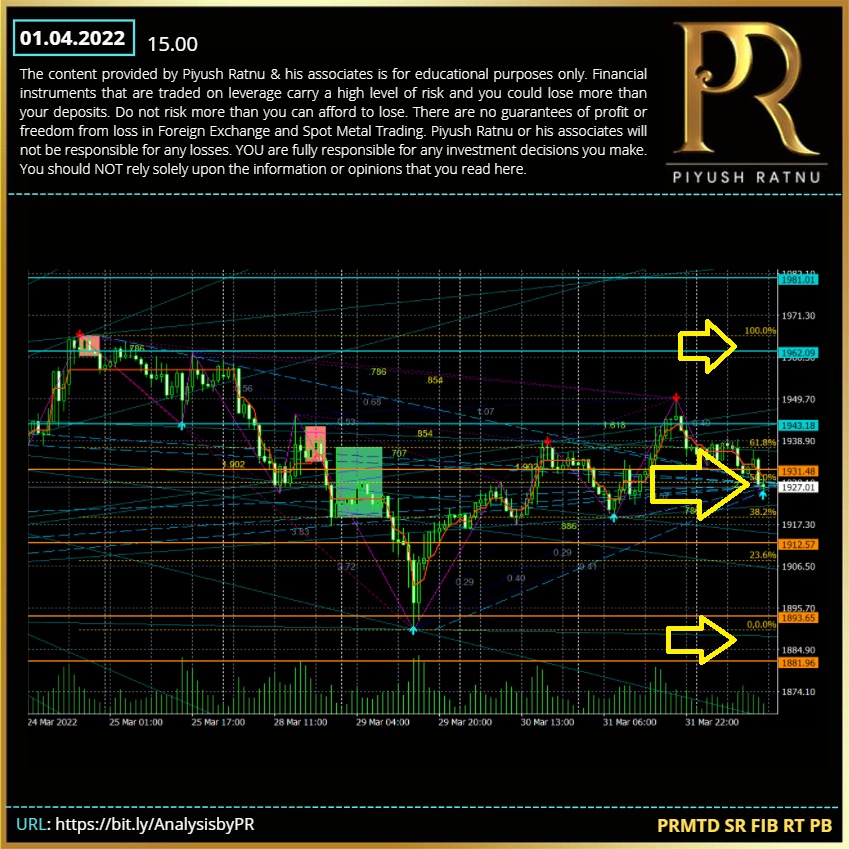
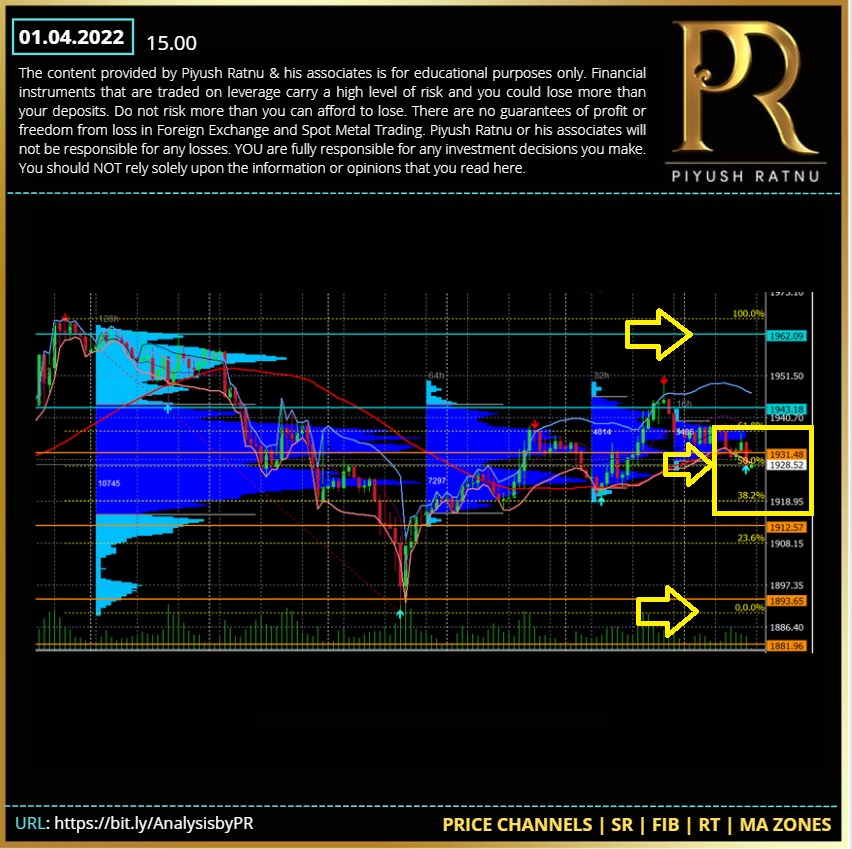
Important levels to notice:

2070-2020-2000-1981-1966/1947-1921-1910-1888/1866-1836-1818-1777-1747-1711-1696-1666

#PiyushRatnu | #Forex | #Bullion | #Trading | #Algorithms | #Gold | #Dollar
Piyush Lalsingh Ratnu
Precious Metals began a long anticipated correction a few weeks ago but it was somewhat interrupted by news of Warren Buffett buying a stake in Barrick Gold (NYSE:GOLD).

The Buffett bounce has passed and the correction could reassert itself as the path of least resistance remains to the downside.

Important levels to notice:

2070-2020-2000-1981-1966/1947-1921-1910-1888/1866-1836-1818-1777-1747-1711-1696-1666

#PiyushRatnu | #Forex | #Bullion | #Trading | #Algorithms | #Gold | #Dollar
Piyush Lalsingh Ratnu
Market Sentiment:

The investors - rightly or not - worry that mammoth injections of liquidity will translate into higher inflation one day. This is something that creates additional demand for gold as an inflation hedge, supporting its prices.

Important levels to notice:

2070-2020-2000-1981-1966/1947-1921-1910-1888/1866-1836-1818-1777-1747-1711-1696-1666

#PiyushRatnu | #Forex | #Bullion | #Trading | #Algorithms | #Gold | #Dollar
Piyush Lalsingh Ratnu
GOLD: Downside Risks As Real As $2,000 Target

If it presses on to $1,990, buyers may look for a high of $2,008 next. But failure to hold at this level can push the price back to $1,924-$1,900.

If it tests $1,860 and bounces back to cross $2,000 and enters the bullish channel, a double-bottom can be established.

This potential formation will have the height of about $150, which if added to this week’s reach of $2000-2020, gives us the much anticipated $2,150 and beyond.

Above $1,795, (the) price is indeed heading higher with a topside breach above $2,033 needed to mark resumption. Subsequent topside resistance objective at 2105 and 2179.

Important levels to notice:

2070-2020-2000-1981-1966/1947-1921-1910-1888/1866-1836-1818-1777-1747-1711-1696-1666

#PiyushRatnu | #Forex | #Bullion | #Trading | #Algorithms | #Gold | #Dollar
Piyush Lalsingh Ratnu
What would the yield-curve target imply for the monetary policy, economy and the gold market?

Well, it’s not rocket science – capping bond yields means that bond yields will remain very low for longer than they would be without the caps. The Fed would cap Treasury yields, which would allow the government to continue its spending spree and to not worry about the fiscal deficits and soaring public debt.

The yield-curve control flattens the yield curve, which hurts the commercial banks, which usually borrow short-term funds and lend long-term. So, a flat yield curve narrows their margins, impairing their lending ability, which is key to revive the economy.

Last but not least, the yield-curve control can become very easily (if it’s not already) a blunt tool to help government issue debt smoothly and cheaply. As the FOMC admitted itself in minutes of its recent meeting, “monetary policy goals might come in conflict with public debt management goals, which could pose risks to the independence of the central bank.”

#PiyushRatnu | #Forex | #Bullion | #Trading | #Algorithms | #Gold | #Dollar
Piyush Lalsingh Ratnu
In a response to the coronavirus crisis, the Fed has already cut interest rates to zero and implemented quantitative easing. But that’s not enough and the U.S. central bankers are now talking about “yield curve control.” What is it and how it could affect the market?

Normally, the central banks lower the short-term interest rate to stimulate the economy. But the federal funds rate is already at zero, so the Fed now thinks about the yield curve control. It works basically like normal open-market operations – the only difference is that under the yield curve control, the Fed would target some longer-term interest rate. As the central bank would set the short-term rates at zero and it would target also longer-term rates, it would practically control the yield curve, which explains the name. Moreover, the Fed would also promise to buy enough bonds to keep the rate from moving above the target – this is why the yield curve control is also called “interest rate caps” or “interest rate pegs.”

It might be useful to compare the yield curve control with the quantitative easing. While the latter deals with quantities or amounts of bonds (e.g., the Fed commits to buying bonds worth $1 trillion, but the market still influences the price), the former deals with bond prices. In other words, under the yield curve control, the central banks pledge to buy whatever amount of bonds the market wants to supply at the target price (instead of a particular amount of bonds at whatever the price).

Although central banks normally target short-term interest rates, the yield-curve control would not be a new policy. It was already used by the Fed during and after the World War II, when it agreed to help Treasury in financing military expenditures and cap the Treasury yields by buying any Treasury bond that yielded above the target. In a more recent history, the Bank of Japan introduced its yield-curve control in September 2016, pegging yields on 10-year Japanese Treasuries around zero percent. Interestingly, under the yield-curve target, the BoJ has been buying government bonds at a slower pace than under the QE, as the chart below shows. This is because investors accepted that the BoJ would buy whatever quantity of bonds to keep yields from rising, so it has not had to buy too many of them to set the price.

#PiyushRatnu | #Forex | #Bullion | #Trading | #Algorithms | #Gold | #Dollar
Piyush Lalsingh Ratnu
The yield-curve control can become very easily (if it’s not already) a blunt tool to help government issue debt smoothly and cheaply. As the FOMC admitted itself in minutes of its recent meeting, “monetary policy goals might come in conflict with public debt management goals, which could pose risks to the independence of the central bank.”

It should be clear now that the yield-curve control should be positive for the gold prices, even if it would reduce the pace of the Fed’s balance sheet expansion (as in the case of the BoJ’s experience). After all, the caps on the Treasury yields imply low interest rates. Importantly, if inflation rises the cap on nominal interest rates this would lead to the decline in the real interest rates, as it happened in the aftermath of the World War II. The yield-curve control also caps the government’s borrowing costs, which encourage the increase in public debt, which raises the risk of the sovereign-debt crisis. Moreover, the yield curve control could spur some worries about the central bank’s independence, which could weaken the U.S. dollar. In such a macroeconomic environment, gold should shine. So, the Fed could cap the Treasury yields, while pushing gold upwards.

#PiyushRatnu | #Forex | #Bullion | #Trading | #Algorithms | #Gold | #Dollar
Piyush Lalsingh Ratnu
#PiyushRatnu | #Forex | #Bullion | #Trading | #Algorithms

Subscribe for analysis & trading calls generated by trading algorithms powered by neural network.

Trading accuracy: 89%
Back dated data testing: 8 years

Gold, Silver, USD pairs and Euro pairs.
Analyse 28 currencies in 1 minute
Manage upto 100 accounts through trading robots and multi currency terminal

Execution in 3-5 ms | Reverse and Multiply Trades in seconds.

For more details: email at piyushratnu@gmail.com
Piyush Lalsingh Ratnu
As per analysis posted on 13.08.2020:

#Gold crashed from 1965-1932.00 and reversed back to 1947 Level. Total pips: 3200

#PiyushRatnu | #Forex | #Bullion | #Trading | #Algorithms
Piyush Lalsingh Ratnu
Trading Performance: 04 August, 2020 | XAUUSD | Spot Gold

Exit price: 2000.00$
Entry price: 1848.00

Holding time: 13 days
Profit booked: 98,000$

#GOLD | Why XAUUSD Gold is rising since 04 August 2020?

US stocks turned positive while at the same time US yields printed fresh lows helping XAU/USD.
The US 10-year yield fell to 0.515%, the lowest since mid-March.

For more details/queries, email at piyushratnu@gmail.com

#PiyushRatnu | #Forex | #Bullion | #Trading | #Algorithms
Piyush Lalsingh Ratnu
Trading Performance: 04 August, 2020 | XAUUSD | Spot Gold

#GOLD | Why XAUUSD Gold is rising today?

US stocks turned positive while at the same time US yields printed fresh lows helping XAU/USD.
The US 10-year yield fell to 0.515%, the lowest since mid-March.


For more details/queries, email at piyushratnu@gmail.com

#PiyushRatnu | #Forex | #Bullion | #Trading | #Algorithms
Piyush Lalsingh Ratnu
Trading Performance: 31 July 2020 | XAUUSD XAGUSD AUDUSD EURUSD | #Forex #Bullion

For more details/queries, email at piyushratnu@gmail.com

#PiyushRatnu | #Forex | #Bullion | #Trading | #Algorithms
Piyush Lalsingh Ratnu
Top Forex Trading Tips For Beginners

We have covered a lot of information in this article so, we’d like to conclude with an overview of our top Forex trading tips for beginners. If you take anything from this article, it should be these following tips:

Do Your Research

Generally speaking, the less you know, the more at risk you are, and there is no limit to how much you can know or risk. An endless amount of information is available on the internet free of charge, like:

Educational videos on Forex exchange trading for beginners
Educational articles and tutorials
Forex trading seminars for beginners and professionals
Forex trading webinars
If you want to know how to learn Forex trading as a beginner, simply read as much as you possibly can, and always analyse what you read – don’t just take information in good faith.

Test on a Demo Account or With Simulation Software

Every broker offers a demo account – whether you are a beginner or not, test every new strategy there first. Keep going until the results are conclusive and you are confident in what you are testing. Only then should you open a live account and use your strategy in the smallest volume trades available. Be sure to treat your demo account trades as if they were real trades.

Don’t Overcomplicate Things

Don’t overload your charts with indicators, or your strategy with handles or switches. The more complicated your trading strategy is, the harder it will be to follow, and the less likely it is to be effective. To find out how well a strategy performs on average in different markets, you need to carry out the necessary back testing and research.

Keeping it simple can be a real challenge, especially considering the multitude of supporting tools you can apply to your charts. Just remember – it’s not about the amount of tools at your disposal, but it is about being able to use a few tools in an effective way.

Be Careful in Volatile Markets

Volatility is what keeps your trading activity moving. However, if you’re not careful it can also destroy it. When volatile, the market moves sideways, which makes spreads grow and your orders slip. As a beginner Forex trader, you need to accept that once you are in the market, anything can potentially happen, and it can completely negate your strategy.

For example, the crisis with the Swiss Franc in January 2015 ended business for many traders and brokers within hours of its occurrence.

The Trend Is Your Friend

Whether you are a beginner trader or a pro, it is best to trade with what you see and not what you think. For example, you might think that the US dollar is overvalued and has been overvalued for too long. Naturally, you will want to short and you might be right eventually. But if the price is moving up, it does not matter what you think. In fact, it doesn’t matter what anybody thinks – the price is moving up and you should be trading with the trend.

The Trade Is Open Until It’s Closed

A regular Forex trading beginner concentrates on opening a trade, but the exit point is equally important. If your trading strategy does not consider the mechanism of closing a deal, it’s not going to end well, and you’re much more likely to suffer heavy losses.

Write Everything Down

A novice Forex trader must develop the mindset of a business owner. Every business requires a business plan, constant monitoring, and regular auditing. Jumping ahead without plans and processes is a sure-fire way to fail. Starting a trading journal is an absolute must.

Everyday, be sure to write the following:

Points for further research
Reasons to open or close a trade
Your achievements and mistakes.

Keep your journal handy as a point of reference when analysing your activity. A journal ensures none of your actions are in vain. Analysis of good trades will boost your trading confidence and motivate you to push harder and go further. On the other hand, analysis of bad trades will help you to extract value and improve.

For more details/queries, email at piyushratnu@gmail.com

#PiyushRatnu | #Forex | #Bullion | #Trading | #Algorithms
Piyush Lalsingh Ratnu
6 Popular Forex Strategies

Now you know the what, the why, and the how of Forex trading. The next step to to create a trading strategy. For beginner traders, the ideal scenario is to follow a simple and effective strategy, which will allow you to confirm what works and what doesn’t work, without too many variables confusing things.

Fortunately, banks, corporations, investors, and speculators have all been trading the markets for decades, which means there is already a wide range of Forex trading strategies to choose from. These include:

Forex scalping: Scalping is a trading strategy that involves buying and selling currency pairs in very short increments – usually anywhere between a few seconds and a few hours. This is a very hands-on strategy that involves making a large number of small profits until those profits add up.

Intraday trading:Forex intraday trading is a more conservative approach than scalping, with trades focusing on daily price trends. Trades may be open anywhere between one to four days, but usually focus on the major sessions for each Forex market.

Swing trading: Swing trading is a medium-term trading approach that focuses on larger price movements than scalping or intraday trading. This means that traders can set up a trade and check in on it within a few hours, or a few days, rather than having to constantly sit in front of their trading platform, making it a good option for people trading alongside a day job.

Forex hedging:Hedging is a risk management technique where a trader can offset potential losses by taking opposite positions in the market. In Forex, this can be done by taking two opposite positions on the same currency pair (e.g. by opening a long trade and a short trade on the GBP/USD currency pair), or by taking opposite positions on two correlated currencies.

The Forex martingale strategy:The martingale strategy is a trading strategy whereby, for every losing trade, you double the investment made in future trades in order to recover your losses, as soon as you make a successful trade. For instance, if you invest 1 EUR on your first trade and lose, on the next trade you would invest 2 EUR, then 4 EUR , then 8 EUR and so on. Please note that this strategy is extremely risky by nature and not suitable for beginners!

The Forex grid strategy: The grid strategy is one that uses buy stop orders and sell stop orders to profit on natural market movements. These orders are usually placed at 10 pip intervals and, by having these stop orders put in place, a trader can then automate this trading strategy.

For more details/queries, email at piyushratnu@gmail.com

#PiyushRatnu | #Forex | #Bullion | #Trading | #Algorithms
Piyush Lalsingh Ratnu
Money Management in Forex

Managing your money in Forex trading comes down to the specific measures you use to increase your profits, whilst also minimising potential losses. Successful Forex trading has far more to do with effective money management than having a handful of good trades, and is one of the secrets that separates those who successfully trade FX over the long term, from those who give up after a couple of trades.

For the moment though, here are some money management fundamentals to guide your trading:

Decide how you will finance your trading in advance:Only one kind of money is good for investing, and that’s the kind that you are willing to lose, and preferably without damaging your physical and/or mental wellbeing in the process. Every profitable trader is profitable in their own way, while every loser experiences losses exactly the same way. Remember, use every available opportunity to learn. It’s a never-ending process!
Define your investment level:One of the most common questions about trading Forex is ‘how much do I need to start trading?’ For beginner traders, it’s a good idea to start small and work your way up. Fortunately, many Forex brokers have reasonable minimum deposit levels for opening an account. Be wary of any brokers offering bonuses for certain deposit levels, as these might be scams, where it is very difficult to withdraw your money in the future.
Calculate your risk:Make sure to calculate your risk before you trade. If the potential profits of a trade are smaller than the potential risks, the trade probably isn’t a good decision. You can assess your risk with our free Forex calculator.
Determine the profits required to cover any losses: Along with calculating your risks before any trade, it’s also worth calculating how much you would need to make to regain those funds in any future trade. It’s often harder to earn money back than it is to lose it, simply because your remaining investment pool is smaller, which means you have to make a larger profit (percentage wise) to break even.For example, if you invested 5,000 EUR and lost 1,000 EUR, you will have lost 20% of your balance, leaving you with a final balance of 4,000 EUR. To bring your balance back to 5,000 EUR, you will need to make a profit of 1,000 EUR. However, with a starting balance of 4,000 EUR (after the previous loss), there is now a 25% gain, rather than a 20% one.

Start with small trades: To help you manage your risk and preserve your capital, start by trading small sums of money, rather than taking big risks with a large portion of your account balance. For instance, in the previous example, if you put your entire 2,000 EUR account balance on a single trade, it would be easy to lose it all.By contrast, if you just traded 20 EUR, a loss would not significantly affect your account balance. It would provide you with the opportunity to learn from your experience and plan your next trade more effectively. With this in mind, limiting the capital you are prepared to risk to 5% of your account balance (or lower) will put you in a better position to continue trading Forex (and improving your technique) over the long term.
Risk Management Tools and Techniques
Once you have mastered your trading psychology and money management, there are a number of trading techniques you can apply to further reduce your risk.
Diversify your portfolio:We all know the saying, ‘don’t put all your eggs in one basket’, yet many new FX traders do this when it comes to their trading. Just as it isn’t wise to put all of your funds into a single trade, relying on a single currency pair increases your level of risk, because if the pair moves in a different direction to what you expect, you could lose everything. Instead, consider opening a number of small trades across different Forex pairs.You could even consider trading other CFD instruments as well, such as shares, indices, commodities, cryptocurrencies and more, as these will further diversify your trading portfolio.
Use leverage wisely:As we’ve already mentioned, Forex CFDs allow you to trade on a margin, or by using leverage. However, just because 1:30 (or 1:500) leverage is available, it doesn’t mean that you need to use it. At some brokers, while there is a maximum amount of leverage available to our clients, they are still able to choose the amount of leverage they use when they are trading, which may be anything up to that amount.For instance, after assessing your risk, you might decide that the potential costs of trading with a 1:30 level of leverage are too great, and you are more comfortable with 1:5. Choosing a lower nominal leverage will help you to manage your risk effectively, especially if you are new to Forex trading.
Focus on the long term:The initial stages of your trading should be about preserving your capital – not trying to grow it. Minimising risk is the primary objective. One way to possibly achieve this is by utilising a long-term trading stance.What casual Forex trading beginners often fail to realise is that the most successful traders try to make a return on their investment based on long-term trends. They often hold their orders open for weeks, months and even years at a time. This way, Forex works as an investment rather than a lottery.
Use a stop loss:A stop loss is tool that traders use to limit their potential losses. Simply put, it is the price level at which you will close a trade that isn’t moving in your favour, thereby preventing any further losses as the market continues to move in that direction. You can also use a stop loss to conserve any profits you might have already made – the tool to achieve this is known as a ‘trailing’ stop loss, which follows the direction of the market.For instance, if you opened a long trade on the GBP/USD currency pair, and the pair increased in value, the price limit at which the trade should close (the stop loss) would climb alongside the price of the currency pair. If the value of the GBP/USD then started to fall, the trade would be closed as soon as it hit your stop loss, preserving any profits you had made beforehand.
Continue your Forex education:The markets are constantly changing, with new trading ideas and strategies being published regularly. To ensure you continue to develop your trading skills, it’s important to stay on top of your trading education by regularly reviewing market analysis and by learning new trading strategies. For more trading education, take a look at our Forex and CFD webinars, which are designed to grow your knowledge as you start and continue to trade.

For more details/queries, email at piyushratnu@gmail.com

#PiyushRatnu | #Forex | #Bullion | #Trading | #Algorithms
Piyush Lalsingh Ratnu
Some say that gold is one of the most difficult markets to trade and there is some truth to that – gold doesn’t move like other markets and if investors want to be successful in trading it (and it can be very rewarding), they have to keep several things in mind. Over the years of monitoring and analyzing the gold market we noticed many profitable rules and patterns. We successfully applied them and are still applying them for our precious metals trades.
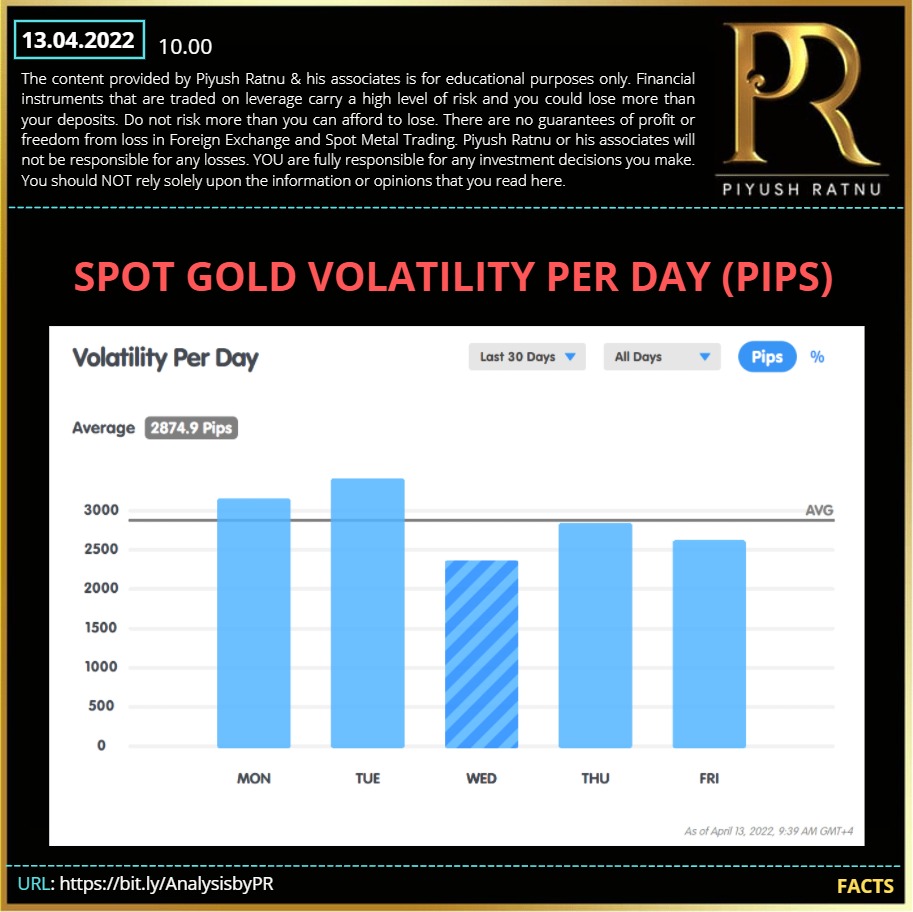
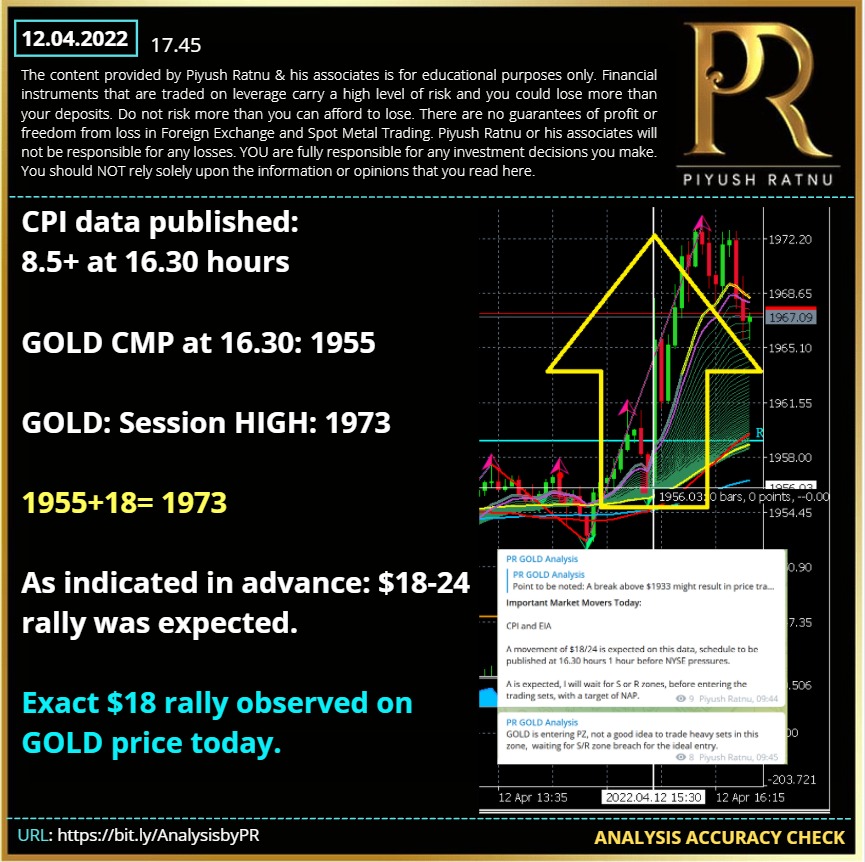
Gold has a huge daily range. Daily ranges of 400-800 pips are not uncommon and the average “small” day is 3000 pips. Gold is volatile: Gold can easily swing 60-300 pips within minutes. Large reversals are common. An order that looks very good can turn into a loser quickly and an order in draw-down can also go into profit very quickly. The speed by which the market can move and change direction requires very good pre-planning or very quick decision making. If you wait too long to see if price will reverse after touching an s/r, you can lose most of your gain. Then again, many times, it blows right through the s/r after a short pause making your win bigger. Event based rally: 18-24$ | Retracement: 30% | Possibility of rally in GOLD over War/Trade dispute/Interest Rate/Pandemic: 100-150$ in 10-12 days | 50$ in 6 hours.

Split Personality: Gold also can move a very big distance without looking back. Although pauses are made at important s/r, pullbacks on the best moves simply do not occur. It is difficult to tell when gold is “swinging” and when it is “running” until you see the actual moves

Gold Respects S/R EXTREMELY well: This is a wonderful feature. Gold can be technically traded accurately and consistently from this aspect. Pivots, manually placed horizontal s/r and trendlines, and Fibs are very well respected

Waiting for candle close is MANDATORY for decisions, especially entry: Price can reverse a long distance in the last few minutes of an hourly candle, a ½ hour candle and certainly a 4-hour candle. Jumping into a trade you “think” is going to close through a certain point can burn you badly.

Reversal Candlestick Formations Are Extremely Accurate: By combining this plus a bounce off of s/r after a move in one direction, REGARDLESS of overall trend, usually results in a move of some distance, usually back to the next s/r at least. Higher timeframe, the better the move.

Gold Trades Well Most of the Day: Really the only time gold doesn’t move very well is the last couple hours of NY session and first couple hours of Asian session. By time Tokyo opens, gold can be traded. Moves during Asian session are smaller than London, and London moves tend to be smaller than NY moves. Biggest moves occur when both London and NY are open.
Price Action Dominates: The best indicator I have found for subsequent moves is simply price action. If gold moves strong through or off of an area, particularly after a period of “quiet” price action, the resulting moves are very consistent.

Gold Can PUNISH Bad Trading: Oh boy, if you aren’t 100% good at identifying proper areas or the moves around them, gold can make you lose quickly and in both directions. Common mistakes like “shooting from the hip” by taking gut moves, or “revenge trading” which can usually be rectified after you calm down in forex, are usually too late to do anything about with gold. You need a plan, and HAVE to stick to it to even have a hope of success.

Keep the sizes of your gold, silver and mining stock trading positions small. The higher the chance of being correct, the bigger the position can be (that’s why sizes of long-term investments are bigger than sizes of short-term trades).

Pay attention to cycles and turning points – many markets have cyclical nature (for instance the USD Index and silver) and cycles can be a great help in the case of short- and long-term trades.

Check the efficiency of each indicator that you want to use on the gold market (or other markets) before applying it and trading real capital based on it.

Consider using RSI and Stochastic indicators for gold, silver and mining stocks as they have proven to be useful over many years. Other indicators can be useful as well, but be sure that you examine them before you decide to make trading decisions based on them.

If a given indicator works “almost as well” as you’d like it, but you see that it has potential, don’t be afraid to modify it. For example in case of RSI, you see good selling opportunities when this indicator moves to 65 or so instead of the classic 70 level) then it can be useful and profitable to either add additional overbought / oversold level, breaking which would generate a signal (in this case a sell signal) or to change the parameters of the indicator, deviating from the standard values.

Use moving averages only if they have been working for a given market in the past – if a given market has been ignoring a certain moving average, most likely so can you.

Keep track of the price seasonality – in our opinion its best to use True Seasonals as expiration of derivatives can also have an important impact on the price of gold, but if you can’t get access to them, it’s better to use regular seasonality than none at all.
Use trend lines and trend channels – they have often proven useful as support and resistance lines / levels in the case of gold, silver and mining stocks. The more significant lows or highs are used for creating a given trend line or channel, the stronger the support or resistance is.

The previous highs and lows can and often serve as support/ resistance levels as well – in the case of the precious metals market, the strength of the support / resistance is strength of the support / resistance created as rising or declining trend lines. The more significant the high or low is, the stronger the resistance or support.

Note that markets have not only a cyclical nature, but a fractal one, too. The rallies and declines are self-similar, which means that price patterns that we saw on a bigger scale are quite likely to be seen on a smaller scale (proportionately). This observation can be of great help when determining how low or how high gold, silver or mining stocks will move.

Pay attention to volume. The volume is a very important, yet often overlooked, piece of information. If a rally is accompanied by rising volume, then it’s likely a start of an even bigger rally. If a rally is accompanied by low or visibly declining volume, then it’s likely ending. If a decline is accompanied by high or rising volume (unless there is a day when the price visibly reverses), then the decline is likely to continue. If a decline is accompanied by low volume, then there are no meaningful implications (yes, the situation is not symmetrical in this case). The above are general guidelines, and before applying them to the current market situation, be sure to check if the above (the part of the above that currently represents the situation on the market) really worked in the way above – if it didn’t, then it’s generally better to expect the same type of reaction that previously accompanied a certain price/volume pattern.

Look for price formations (like a head and shoulders formation), but before you apply them (believe that a certain formation is “in play” and likely to cause a certain move which would cause you to enter or close a given trade) be sure to check if this kind of formation worked on this market previously. For instance “breakouts” (which are not a formation by themselves, but this example illustrates what we mean) in silver have quite often resulted in price declines (breakouts were invalidated) instead of rallies, so their real implications were the opposite of what one might have expected based on the classic definition of a breakout.

Wait for confirmations. It’s usually best to wait for breakouts / breakdowns confirmation before taking action. In the case of the precious metals market, based on our experience, it’s worth waiting for three consecutive closing prices below / above the critical price level before viewing the breakout / breakdown as “confirmed” and thus meaningful. Invalidation of a breakout is a bearish sign and invalidation of a breakdown is a bullish sign.

Analyze more than the market in which you want to trade. In today’s global economy no market can move totally independently. Gold and the rest of the precious metals sector are no exception – their price moves are often linked to the moves on the currency market, moves on the general stock market, interest rates, Fed’s comments, and performance of gold stocks and silver stocks are just the most important ones. Be sure to check what markets were moving in tune or in the opposite direction to gold before and make sure that their impact is likely to be supportive of the trading position that you are about to open. For example, if gold was moving in the exact opposite to the USD Index and you’re considering opening a long position – if you see that the USD Index is very close to a major resistance level and it’s already heavily overbought, then the odds are that the USD Index will top and contribute to or even trigger gold’s decline.

Analyze ratios. Of course, not just any ratios – the ratios that have proven to provide important signals for gold (like the gold stocks to gold ratio or gold to silver ratio – they both have a history of leading gold, but this has not been the case during the post-2011 decline), that are important due to fundamental factors (gold vs. bonds ratio – both can be seen as safe-haven assets and major bottoms and tops in this ratio take place along with major tops and bottoms in gold, so it can be used as a confirmation) or because they are often discussed (gold to oil ratio). Sometimes ratios can be utilized to see something from a non-USD perspective (gold to UDN ratio is the weighted average of gold priced in currencies other than the US dollar, with weights as in the USD Index – this ratio can be used to confirm major moves in gold or suggest that these moves are just temporary as they are only visible from the USD perspective).

Analyze other time-frames than the one that you’re focusing on. Even if you are placing a short-term trade, be sure to check the medium- and long-term trend. Generally, the longer the time frame, the stronger the support and resistance levels, so even if you analyzed the short-term picture, it can be the case that a given move will be stopped by a medium- or long-term resistance. If you’re focusing on the medium- or long-term trades, the short-term picture can help you fine-tune the moment of entering or exiting the market.

Be on the constant lookout for anomalies. When you see something odd, investigate and find the reason behind it and check if anything similar happened previously – if yes, check what happened next. If similar things were always followed by the same kind of price pattern in gold, silver and/or mining stocks, it might be a good idea to trade it. If not, then perhaps the reason behind the anomaly resulted in something else that had a more specific effect on the precious metals prices.

Monitor investor sentiment. If the vast majority (!) of precious metals investors and traders are bullish, then gold is likely close to a top (in this case it makes sense to look for selling signals and / or confirmations that the top is in and – if they are present – exit long positions and / or enter short ones). Conversely, if everyone and their brother is bearish on the market, then a bottom is very likely close to being in or already in. The ways to estimate sentiment include checking how often people look for gold-related terms (like “gold stocks”) in Google Trends, monitoring outcomes of surveys with questions like “where will gold price be in 3 months” and similar queries, and also checking the traffic of gold-related websites on Alexa. On a side note when you see that a certain, big gold-related website is very slow or crashes after a big move up or down, then it likely means that the traffic / interest in gold was enormous, which is another way of detecting that a major price extreme is well-nigh (we saw that in 2011 when gold topped).

Even if your primary approach is to trade gold, we still encourage you to consider dedicating a part of the capital to long-term investments – it should lower the overall variability of your returns and making gains more stable. There are also other benefits that we outlined in our very first report in which we discussed whether trading gold or investing in it is more profitable. Our gold portfolio report includes a sample portfolio for “Trader John”, which might serve as an example (of course, it’s not investment advice) of how traders could structure their portfolios and benefit from diversified strategies.

Before you decide to follow an analyst, be sure to check how long they have been in the business and if they are known for their good performance. Check our performance here.
GOLD TRADING IS NOT FOR BEGINNERS!
IF YOU ARE STRUGGLING AT FOREX, GOLD WILL EAT YOUR LUNCH & DINNER
IF YOU ARE NOT DISCIPLINED AND STRUCTURED CONSISTENTLY, GOLD WILL RUIN YOUR ACCOUNT | Trade SAFELY!
Tools for Analyzing Gold

When gold prices rise and fall, there are tools that aid in determining how strong the trend is. This aids in making decisions for mining company stocks and gold or gold ETFs.

Here are several key things to look for in a strong gold uptrend:

The price of gold is starting to rise or is in an uptrend.
The gold mining stocks, as measured by a gold miner’s index like the Vaneck Vectors Gold Miners ETF (GDX), is rising at a faster pace than gold.
Junior gold miners, as measured by an index like the Vaneck Vectors Junior Gold Miners ETF (GDXJ), is rising faster than GDX. In other words, the small companies are rising quicker than the larger more established mining companies.
The same concepts apply to downtrends in gold, except we reverse the expectations. In a weak gold market, the price of gold is falling, the gold miner are falling more than gold (percentage terms), and the juniors are declining even more than the larger miners. In this article, we will focus on the uptrend, as most investors are looking to buy gold, and avoid the downtrends.

Regarding the first point, gold and the mining stocks tend to move together. Although, the stocks often make the first move. For example, if gold prices are stagnant it is usually the stocks that start to rise first, followed by gold.

Once gold and the stocks are rising, this is favorable for both gold and the mining stocks. Gold should start making higher swing lows and higher swing highs. This is the definition of an uptrend.

For more details, and queries related to Portfolio Management in Forex & Commodity Trading, please email at piyushratnu@gmail.com | #PiyushRatnu | #Forex | #Bullion | #Trading | #Algorithms
Piyush Lalsingh Ratnu
XAUUSD | SPOT GOLD: $2020/ounce in 2020, POSSIBLE?