mazen nafee / Profil
- Information
|
11+ Jahre
Erfahrung
|
0
Produkte
|
0
Demoversionen
|
|
0
Jobs
|
0
Signale
|
0
Abonnenten
|
Freunde
983
Anfragen
Ausgehend
mazen nafee

mazen nafee
Kommentar zum Thema Indices Technical Analysis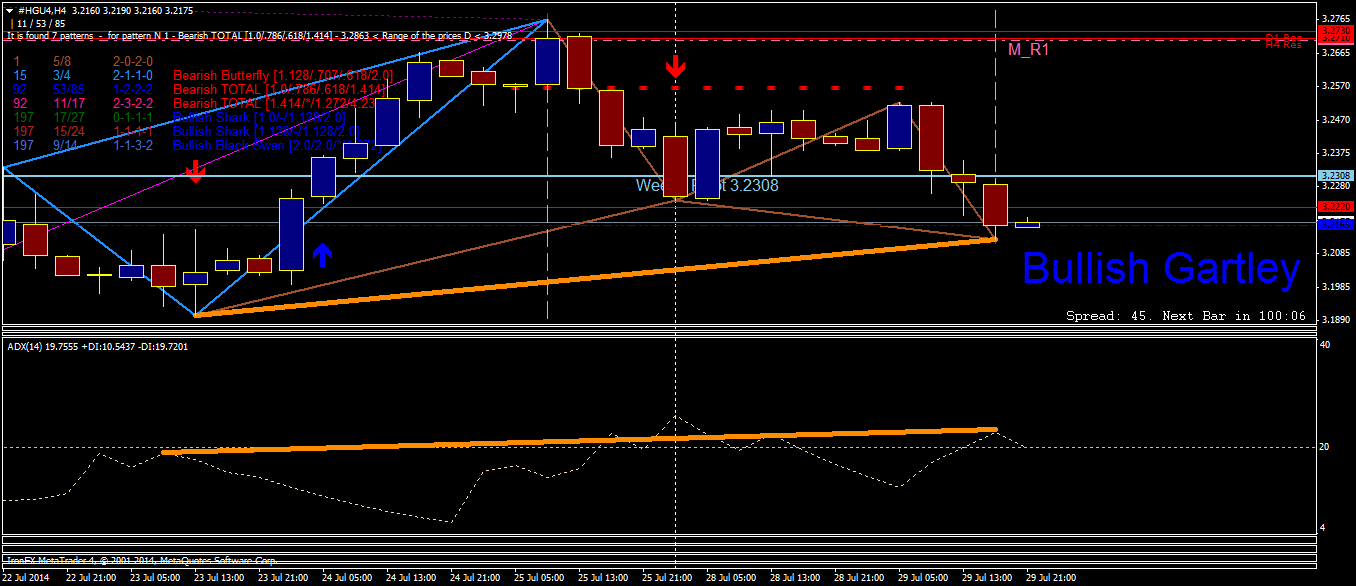
#HGU4 H4 chart ( September 2014 High Grade Copper ) Bullish Gartley [.707/.618/.5/1.414] pattern Bullish Divergence (ADX) two possible Support H4 at 3.2165

mazen nafee

mazen nafee
Kommentar zum Thema Indices Technical Analysis
#HGU4 H1 chart ( September 2014 High Grade Copper ) Bullish White Swan [.618/.618/2.0/.707] Pattern Bullish TOTAL 3 [.707/*/1.128/2.236] pattern Bullish Gartley [.707/.618/.5/1.414] pattern Bullish

mazen nafee

mazen nafee
Kommentar zum Thema Indices Technical Analysis
#KCU4 H4 ( September 2014 Arabica Coffee Futures ) Bearish Dragon Pattern Bearish Divergence (ADX) Month Resistance at 181.85 Week Resistance at 179.3

mazen nafee

mazen nafee
Kommentar zum Thema Indices Technical Analysis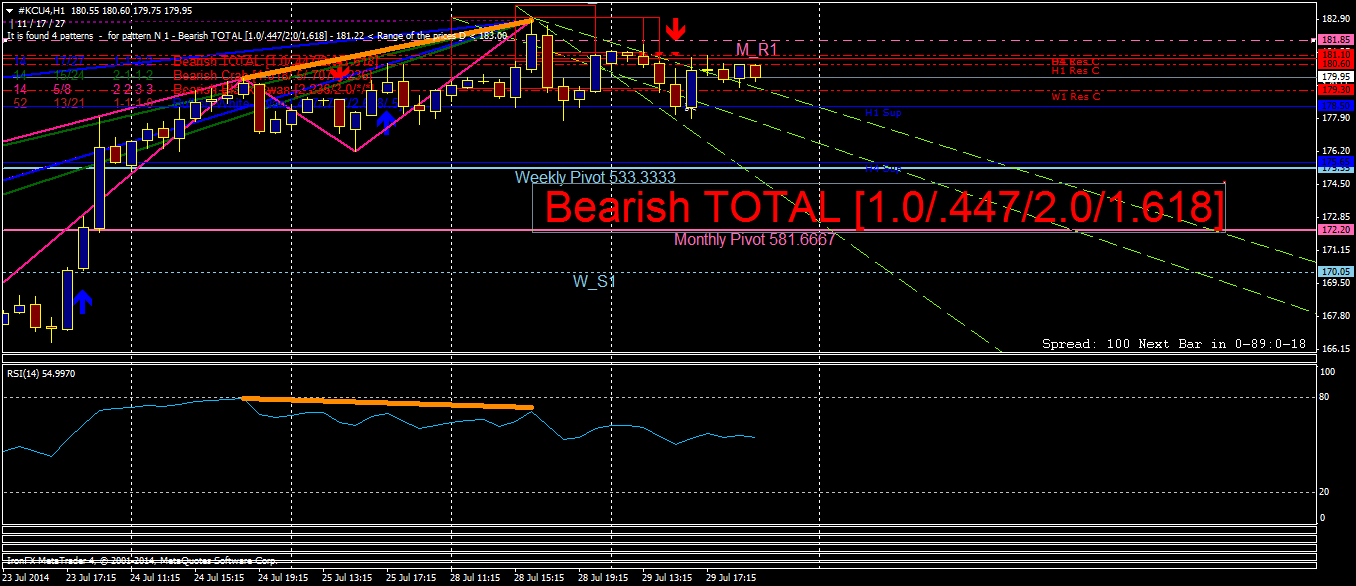
#KCU4 H1 ( September 2014 Arabica Coffee Futures ) Bearish TOTAL [1.0/.447/2.0/1.618] Pattern Bearish Divergence (RSI) Month Resistance at 181.85

mazen nafee

mazen nafee
Kommentar zum Thema Indices Technical Analysis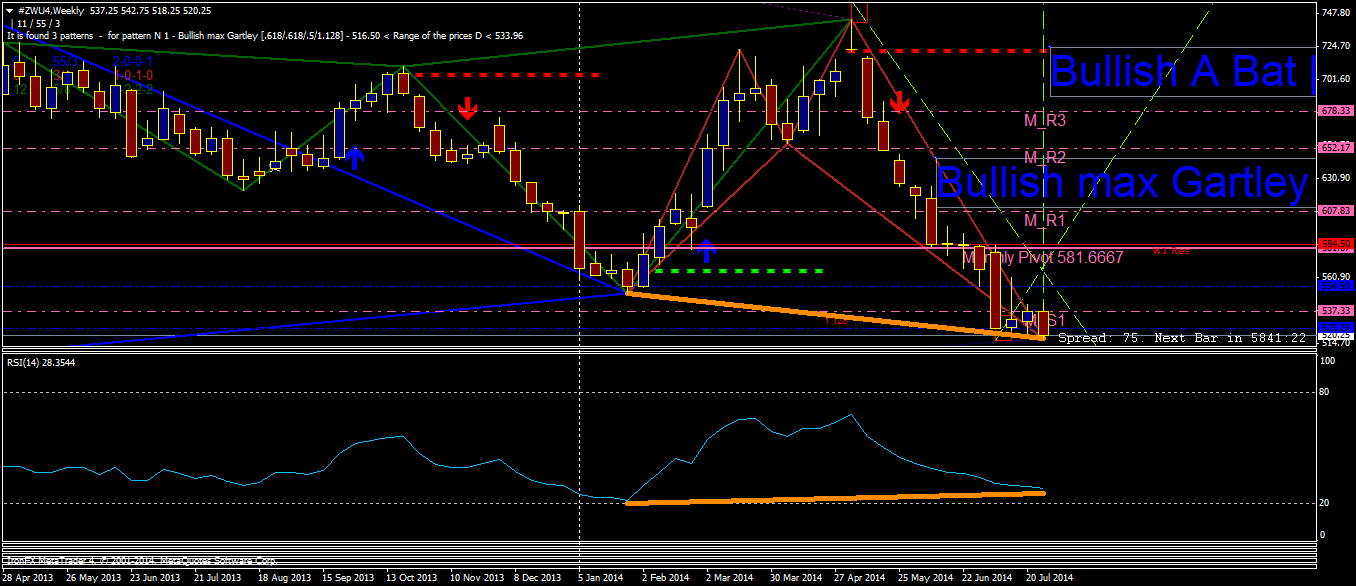
#ZWU4 Weekly Time Frame ( September 2014 Wheat Futures ) Bullish A Bat [1.128/.382/1.272/2.618] Pattern Bullish max Gartley [.618/.618/.5/1.128] Pattern Bullish Divergence (RSI) Support Month at

mazen nafee

mazen nafee
Kommentar zum Thema Indices Technical Analysis
#ZWU4 Daily Time Frame ( September 2014 Wheat Futures ) Bullish A Bat [1.128/.382/1.272/2.618] Pattern Bullish Divergence (ADX) Support Week at 525.25

mazen nafee

mazen nafee
Kommentar zum Thema Indices Technical Analysis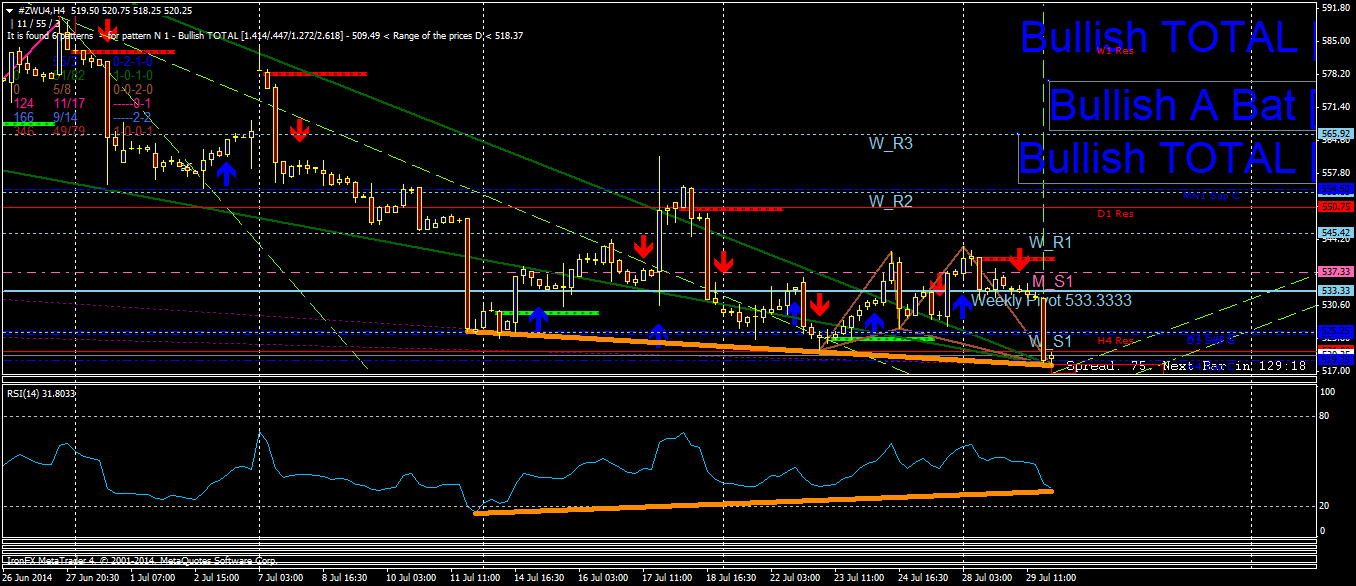
#ZWU4 H4 Time Frame ( September 2014 Wheat Futures ) Bullish TOTAL [1.128/.786/1.0/1.414] Pattern Bullish A Bat [1.128/.382/1.272/2.618] Pattern Bullish TOTAL [1.414/.447/1.272/2.618] Pattern

mazen nafee

mazen nafee
Kommentar zum Thema Indices Technical Analysis
#ZWU4 H1 Time Frame ( September 2014 Wheat Futures ) Bullish TOTAL [1.128/.786/1.0/1.414] Pattern Bullish Crab [1.414/.707/.618/3.14] Pattern Bullish Divergence (ADX) Support H4 at 519.25

mazen nafee

mazen nafee
Kommentar zum Thema Indices Technical Analysis
#ZCU4 Monthly Time Frame ( September 2014 Corn Futures ) Bullish Shark [.886/-/1.128/1.618] Pattern Bullish Divergence (ADX) Support Monthly at 415.50

mazen nafee

mazen nafee
Kommentar zum Thema Indices Technical Analysis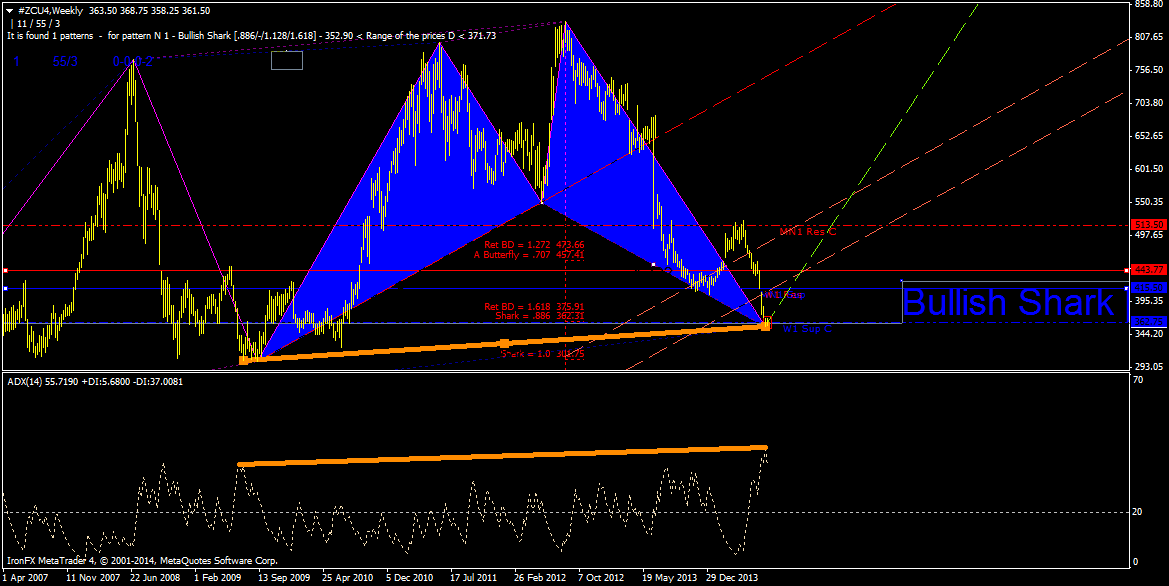
#ZCU4 WEEKLY TimeFrame ( September 2014 Corn Futures ) Bullish Shark [.886/-/1.128/1.618] Pattern Bullish Divergence (ADX) Support Week at 362.75

mazen nafee

mazen nafee
Kommentar zum Thema Indices Technical Analysis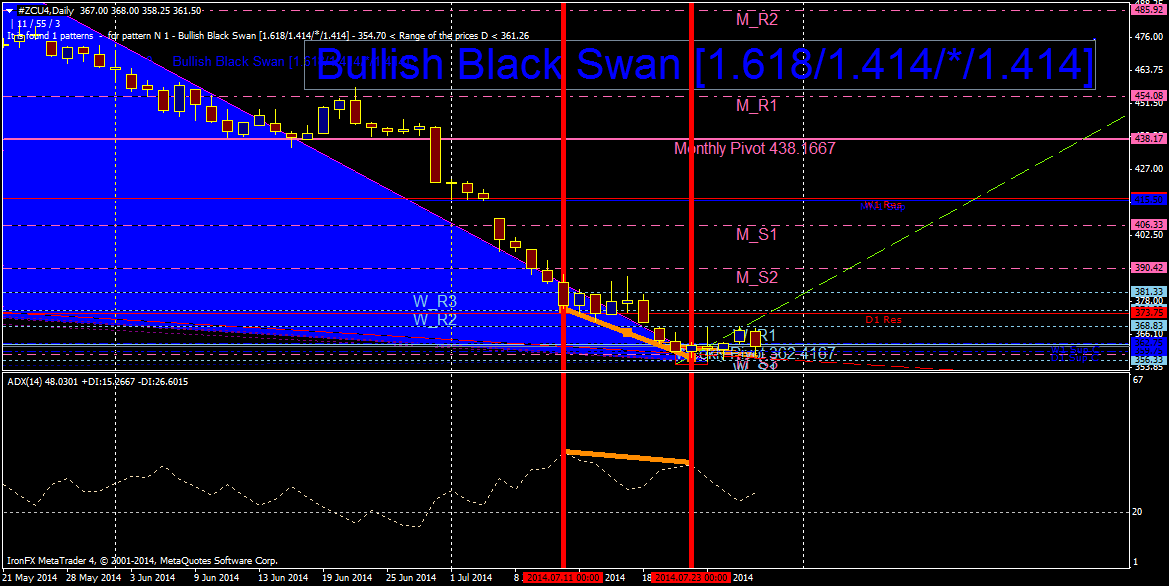
#ZCU4 Daily TimeFrame ( September 2014 Corn Futures ) Bullish Black Swan [1.618/1.414/*/1.414] Pattern Bullish Divergence (ADX) Support Month( 3) at 358.58

mazen nafee

mazen nafee
Kommentar zum Thema Indices Technical Analysis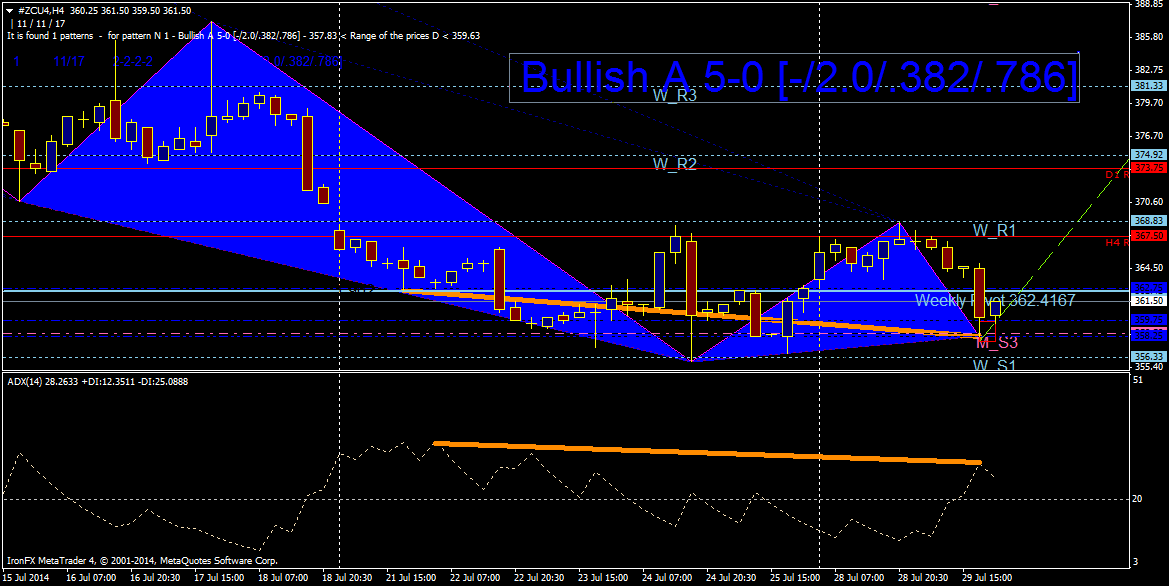
#ZCU4 H4 TimeFrame ( September 2014 Corn Futures ) Bullish A 5-0 [-/2.0/.382/.786] Pattern Bullish Divergence (ADX) Support Month( 3) at 358.58

mazen nafee

mazen nafee
Kommentar zum Thema Indices Technical Analysis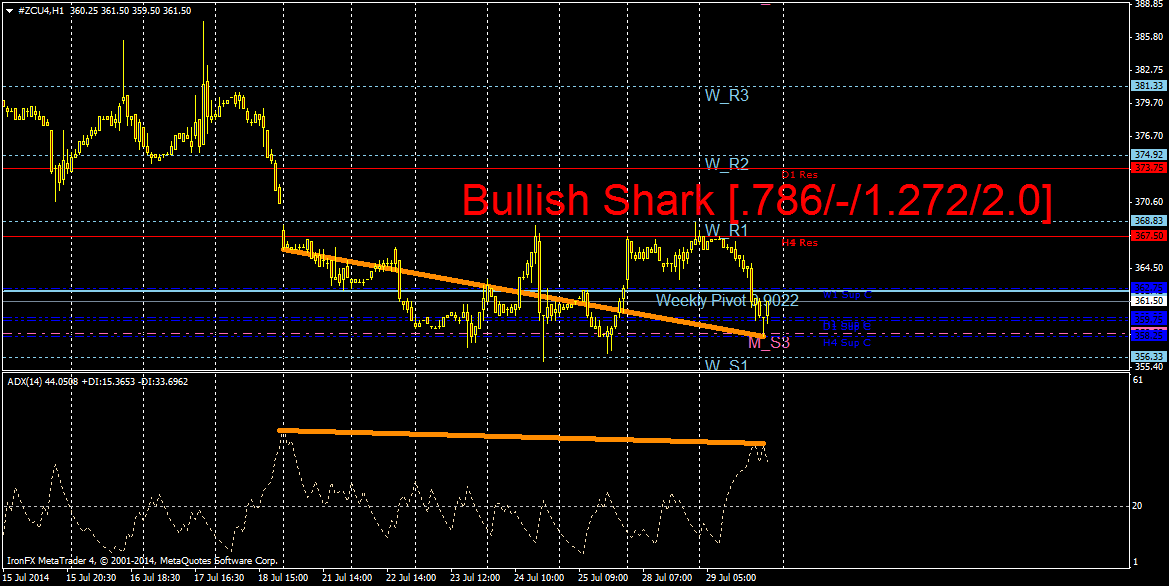
#ZCU4 H1 TimeFrame ( September 2014 Corn Futures ) Bullish Shark [.786/-/1.272/2.0] Pattern Bullish Divergence (ADX)

mazen nafee

mazen nafee
Kommentar zum Thema Indices Technical Analysis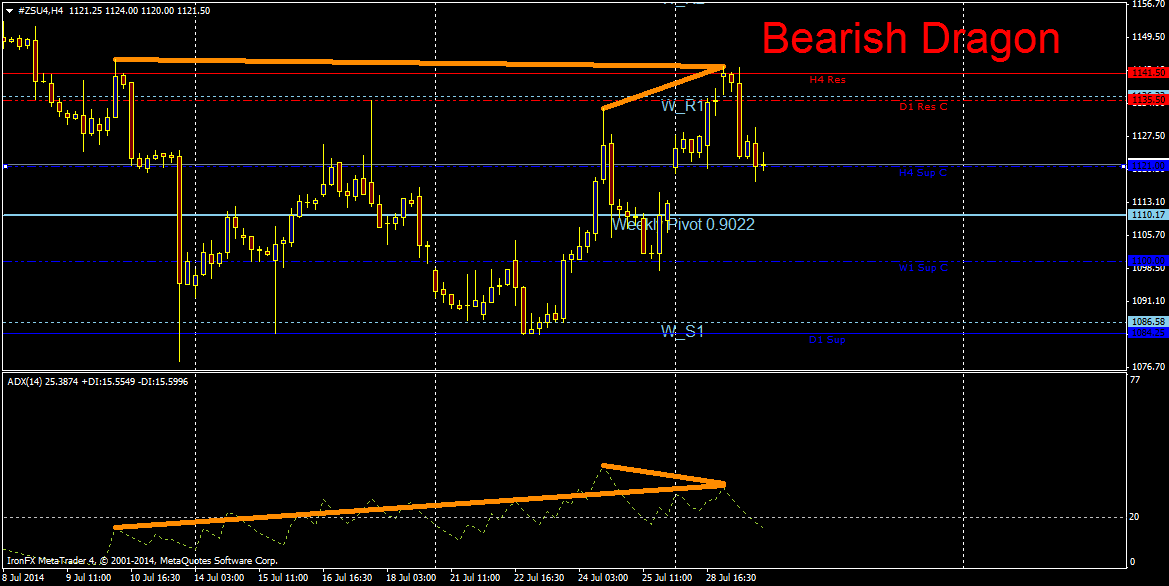
#ZSU4 H4 TimeFrame ( September 2014 Soybean Futures ) Bearish Dragon Pattern Bearish Divergence (ADX) (two possible )

mazen nafee

mazen nafee
Kommentar zum Thema Indices Technical Analysis
#ZSU4 H1 TimeFrame ( September 2014 Soybean Futures ) Bearish AB=CD Pattern Bearish Divergence (AXD)

mazen nafee

Sergey Golubev


1. Q2 2014 Advance GDP Price action should start to get interesting by Wednesday when the advance GDP report for the second quarter of 2014 is released. Due at 6:00 pm GMT, the report is anticipated to print at 3.1...
1
mazen nafee

Sergey Golubev


As many users want to make their technical/fundamental/any analysis so I have to explain about the rules how it should be going on this website. 1. Start your thread with your "technical/fundamental/any analysis/article...
1
mazen nafee
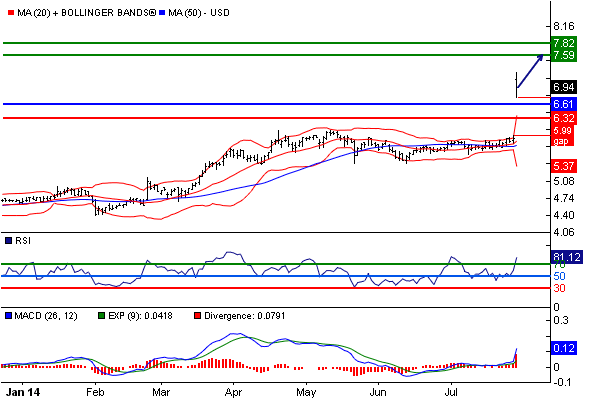
Frontier Communications ST: the RSI is overbought
Our pivot point is at 6.61.
Our preference: the upside prevails as long as 6.61 is support.
Alternative scenario: the downside breakout of 6.61 would call for 6.43 and 6.32.
Comment: the RSI is trading above 70. This could mean that either the stock is in a lasting uptrend or just overbought and that therefore a correction could shape (look for bearish divergence in this case). The MACD is above its signal line and positive. The configuration is positive. Moreover, the stock is trading above both its 20 and 50 day MA (respectively at 5.88 and 5.79). Finally, Frontier Communications is trading above its upper Bollinger band (standing at 6.39). Frontier Communications is currently trading near its 52 week high reached at 7.24 on 29/07/14.
Supports and resistances:
7.82 **
7.7 *
7.59 **
7.47
6.9435 last
6.68
6.61 **
6.43 *
6.32 **

mazen nafee
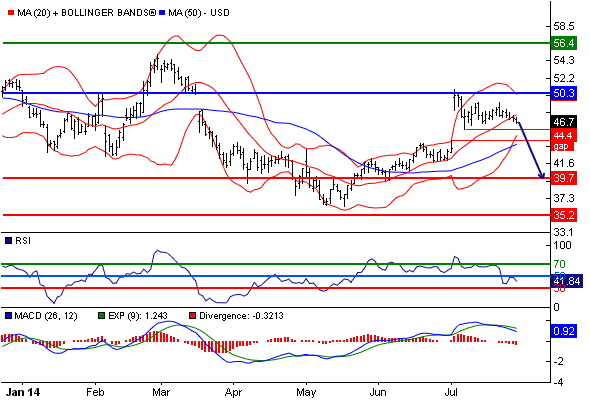
Shutterfly Inc ST: target 39.7
Our pivot point stands at 50.3.
Our preference: target 39.7.
Alternative scenario: above 50.3, look for 54.2 and 56.4.
Comment: the RSI is below 50. The MACD is positive and below its signal line. The MACD must penetrate its zero line to expect further downside. Moreover, the stock is trading under its 20 day MA (47.6) but above its 50 day MA (43.97).
Supports and resistances:
56.4 **
54.2 *
50.3 **
48.7
46.71 last
42
39.7 **
37.5 *
35.2 **

: