Keni Chetankumar Gajanan - / Verkäufer
Veröffentlichte Produkte

Ein kompletter Session Timer, der die aktuelle Zeit, Session-Informationen mit verbleibender Zeit, Chart-Anzeige der Spanne (Hoch-Tief) und des Eröffnungskurses, der aktuellen und vorherigen Sessions für die wichtigsten Märkte und die Option, eine zusätzliche Stadt hinzuzufügen, anzeigt. Eine freundliche Benutzeroberfläche mit anklickbaren Symbolen, anpassbarer Position und Format des Panels, Auswahl von Farben und Text. Die DST-Einstellungen (Sommerzeit) werden automatisch übernommen. Es zeigt
FREE
Der Indikator "Fibonacci Dimension" ermöglicht die Anzeige von voreingestellten oder benutzerdefinierten Multi-Timeframe-Fibonacci-Levels. Er nimmt automatisch das vorherige Hoch und Tief für zwei benutzerdefinierte Zeitrahmen und berechnet deren Fibonacci-Retracement-Levels. Es berücksichtigt auch das Retracement-Level, um die Expansionen bei jeder Preisänderung zu zeichnen. Eine vollständige visuelle Dimension in mehreren Zeitrahmen ermöglicht die Ableitung profitabler Strategien für die Ausfü
FREE
Der Indikator "Fibonacci Dimension" ermöglicht die Anzeige von voreingestellten oder benutzerdefinierten Multi-Timeframe-Fibonacci-Levels. Er nimmt automatisch das vorherige Hoch und Tief für zwei benutzerdefinierte Zeitrahmen und berechnet deren Fibonacci-Retracement-Levels. Es berücksichtigt auch das Retracement-Level, um die Expansionen bei jeder Preisänderung zu zeichnen. Eine vollständige visuelle Dimension in mehreren Zeitrahmen ermöglicht die Ableitung profitabler Strategien für die Ausfü
FREE

PnL Kalender ... analysieren und profitieren
PnL Calendar verwandelt Ihren Handelsverlauf in eine übersichtliche Kalenderansicht und hilft Ihnen, profitable Tage zu erkennen, Risiken in Echtzeit zu überwachen und Konten mit der neuen Multi-Broker-Datenexportfunktion zu vereinheitlichen. Kernfunktionen Kalender-Panel: Gewinnaufschlüsselung nach Tag, Woche, Monat und Jahr Konto-Panel: Kontostand, Eigenkapital, Margenwarnungen, Zusammenfassungen für mehrere Zeitrahmen, Gap-Anpassungen über Nacht R
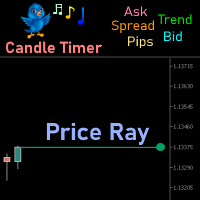
Der Preisstrahl-Indikator ist ein Dienstprogramm, das Ihre Handelsweise verbessern wird. In erster Linie zeigt er den Geld-, Brief- oder letzten Kurs als Linienstrahl an, der bis zur aktuellen Kerze, zur letzten sichtbaren Chartkerze oder zu allen Kerzenbalken reicht. Die erweiterten Funktionen dieses Indikators liefern Informationen in einem Bereich, auf den Sie sich am meisten konzentrieren, direkt neben der aktuellen Kerze. Sie können einen Text auswählen, der oberhalb oder unterhalb des Prei
FREE
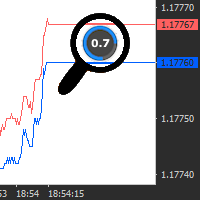
Ein einfaches und nützliches Panel für den aktuellen Kurs, das die aktuellen Geld- und Briefkurse sowie den Spread vergrößert anzeigt und mit der Maus an eine beliebige Stelle im Chartfenster verschoben werden kann. Bietet auch die Möglichkeit, den Geld- oder Briefkurs zusammen mit der Spanne an einer beliebigen Stelle des Charts als Text an einer statischen Stelle anzuzeigen. Ermöglicht die Anzeige als Pips oder Punkte zusammen mit dem Spread, der farblich hervorgehoben wird, wenn er den Schwel
FREE
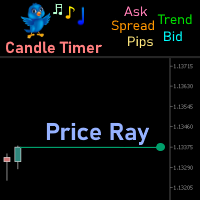
Der Preisstrahl-Indikator ist ein Dienstprogramm, das Ihre Handelsweise verbessern wird. In erster Linie zeigt er den Geld-, Brief- oder letzten Kurs als Linienstrahl an, der bis zur aktuellen Kerze, zur letzten sichtbaren Chartkerze oder zu allen Kerzenbalken reicht. Die erweiterten Funktionen dieses Indikators liefern Informationen in einem Bereich, auf den Sie sich am meisten konzentrieren, direkt neben der aktuellen Kerze. Sie können einen Text auswählen, der oberhalb oder unterhalb des Prei
FREE
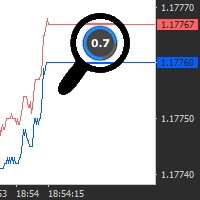
Ein einfaches und nützliches Panel für den aktuellen Kurs, das die aktuellen Geld- und Briefkurse sowie den Spread vergrößert anzeigt und mit der Maus an eine beliebige Stelle im Chartfenster verschoben werden kann. Bietet auch die Möglichkeit, den Geld- oder Briefkurs zusammen mit der Spanne an einer beliebigen Stelle des Charts als Text an einer statischen Stelle anzuzeigen. Ermöglicht die Anzeige als Pips oder Punkte zusammen mit dem Spread, der farblich hervorgehoben wird, wenn er den Schwel
FREE
Portfolio Aggregator - Ein Dashboard, totale Übersicht über alle Ihre Handelskonten.
Portfolio Aggregator fasst Kontodaten von mehreren Brokern und Währungen in einem einzigen, transparenten Dashboard zusammen. Es bietet Echtzeiteinblicke in Eigenkapital-, Margen-, Gewinn- und Verlust- sowie Risikokennzahlen und hilft Händlern, die Kontrolle und das Vertrauen in diversifizierte Strategien zu behalten. Funktionen Multiwährungskonsolidierung - Konvertiert alle Werte in eine ausgewählte Basiswähru
FREE
Portfolio Aggregator - Ein Dashboard, totale Übersicht über alle Ihre Handelskonten.
Portfolio Aggregator fasst Kontodaten von mehreren Brokern und Währungen in einem einzigen, transparenten Dashboard zusammen. Es bietet Echtzeiteinblicke in Eigenkapital-, Margen-, Gewinn- und Verlust- sowie Risikokennzahlen und hilft Händlern, die Kontrolle und das Vertrauen in diversifizierte Strategien zu behalten. Funktionen Multiwährungskonsolidierung - Konvertiert alle Werte in eine ausgewählte Basiswähru
FREE

PnL Kalender ... analysieren und profitieren
PnL Calendar verwandelt Ihren Handelsverlauf in eine übersichtliche Kalenderansicht und hilft Ihnen, profitable Tage zu erkennen, Risiken in Echtzeit zu überwachen und Konten mit der neuen Multi-Broker-Datenexportfunktion zu vereinheitlichen. Kernfunktionen Kalender-Panel: Gewinnaufschlüsselung nach Tag, Woche, Monat und Jahr Konto-Panel: Kontostand, Eigenkapital, Margenwarnungen, Zusammenfassungen für mehrere Zeitrahmen, Gap-Anpassungen über Nacht R