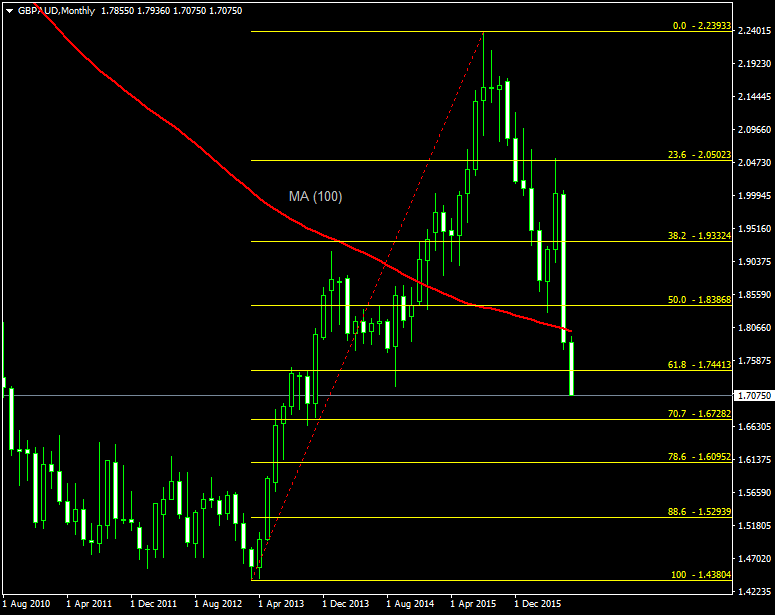
Now we can see how the price respected Fibonacci levels: Below is an image taken from the monthly chart. At the end of June the pair closed below the MA (100). The next target is around 1.6700.
GBPAUD Technical Analusis as of May 19
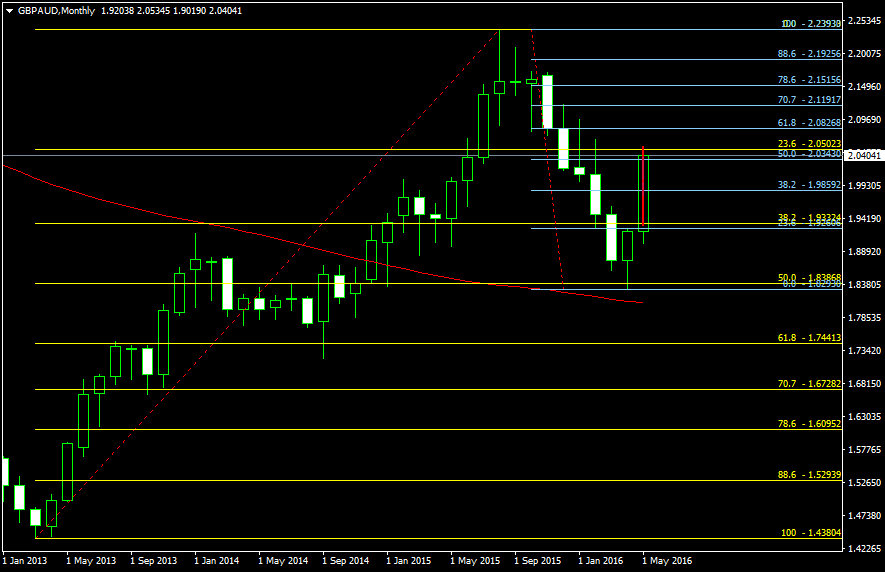
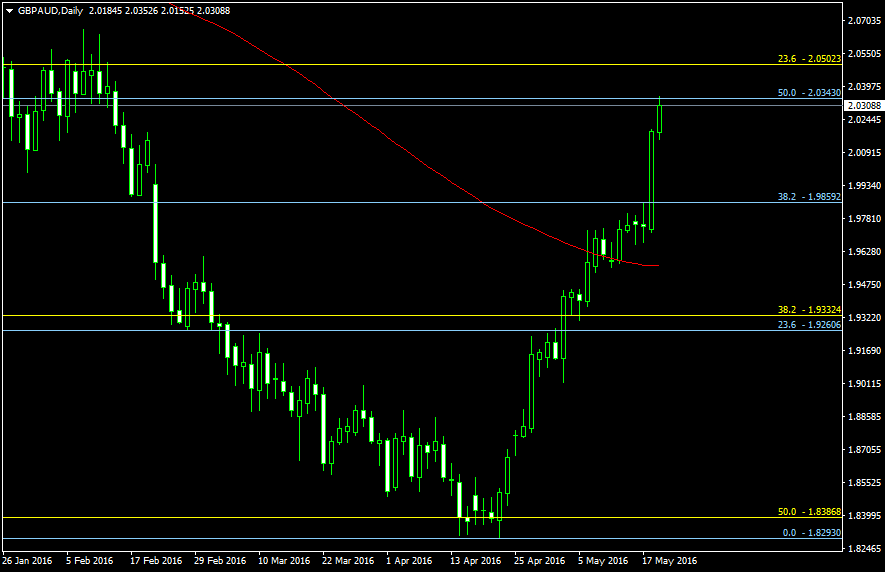
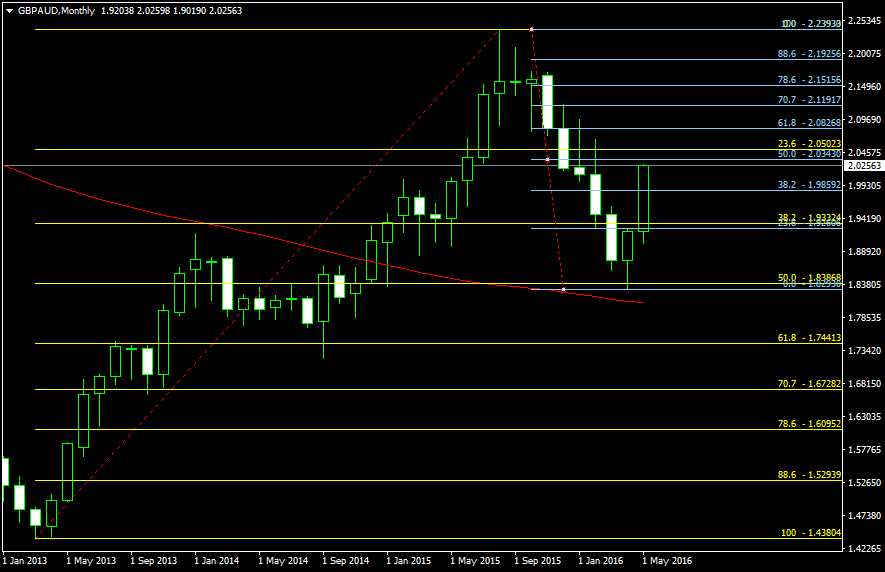
The Yellow Fibos are from Monthly chart the Blue Fibos from Weekly charts. The Monthly trend is bullish (price is above the 100 MA and 50 % Fibo. The Weekly trend was/is bearish, actually the retracement comes to the Weekly 50 % at 2.0343. There is a confluence around Monthly 23.6 % at 2.0500 and Weekly 50 % at 2.0343. It could be the next resistance area.
The Bullish Crab target is around 2.0800 (see the image below in the post of May 3, 2016), which is in confluance with Weekly Fibo 61.8 %. This is the possible second target from here.
GBPAUD Technical Analysis as of May 3, 2016
As it was expectable, the pair went over the Fibo 161.8. A bullish flag was seen on yesterday's chart and there were some other bullish signs on higher time frames too. On the monthly time frame the retracement reached the 50 % handle in April, then quickly started to lift up.
GBPAUD Technical Analysis as of May2, 2016
The pair is around the 161.2 Fibo extension. It went through all the trendlines and now is before a decision of whether to go up to 261.6 extension which is at around 1.9850 or to retrace to Fibo 100 at 1.8890. The market is spoiling at the moment, the trend is bullish.