
"FXDayHighDayLow" ist leider nicht verfügbar.
Schauen Sie sich andere Produkte von Thomas Bradley Butler an:

Signal: HFT-Hacker-Link auf meinem Profil *OPTIMIEREN SIE EA VOR DEM TESTEN UND VERWENDEN. KAUFEN SIE NUR, WENN SIE OPTIMIERT HABEN. Dies ist für Händler gedacht, die wissen, wie man optimiert, und aus eigener Kraft profitabel sein wollen. SIE STELLEN IHRE RISIKOPARAMETER EIN. Hohe Gewinnrate mit Stopps für die Trades, die nicht funktionieren, wenn Sie dies wünschen. Reduzieren Sie das Risiko für eine lange Lebensdauer. Dies funktioniert auf allen Konten und ist ein Risikomanagement-Tool. LESEN
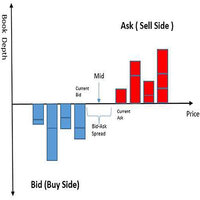
Handeln Sie, was in den Kerzen steckt. Wie viele Käufer oder wie viele Verkäufer, bullische Kerzen, bärische Kerzen. Identifizieren Sie, wer den Markt kontrolliert.
Dieser Indikator ist ein Stimmungsindikator, der Käufer- und Verkäufervolumina über eine Reihe von vergangenen Balken anzeigt. Level 2 wird aus Bids und Asks gehandelt. Viele Stimmungsindikatoren sind zu schnell und es ist schwierig, die Handelsrichtung zu bestimmen. Ich habe die Grafiken geändert, um den Daytrading widerzuspiegel

Signal: HFT-Hacker-Link auf meinem Profil *OPTIMIEREN SIE EA VOR DEM TESTEN UND VERWENDEN. KAUFEN SIE NUR, WENN SIE OPTIMIERT HABEN. Dies ist für Händler gedacht, die wissen, wie man optimiert, und aus eigener Kraft profitabel sein wollen. SIE STELLEN IHRE RISIKOPARAMETER EIN. Hohe Gewinnrate mit Stopps für die Trades, die nicht funktionieren, wenn Sie dies wünschen. Reduzieren Sie das Risiko für eine lange Lebensdauer. Dies funktioniert auf allen Konten und ist ein Risikomanagement-Tool. LESEN

Die Brokerzeiten unterscheiden sich von denen, in die die Strategie eingebaut wurde.
Crypto Net ist für den Handel mit BTCUSD in Zeitrahmen von . Es nutzt die genetische Evolution, um die Strategie zu entwickeln. Dieser EA handelt Trendfolgeindikatoren liegen ATR und Ichimoku. Dieser wurde gebaut und hat eine Reihe robuster Tests bestanden, darunter Monte Carlo und Walk Forward.
Eingänge:
Prozent des Kontos, das minimales Risiko ist. Maximale Anzahl von Losen Zeiten, um den Handel e

Book Map Order Flow shows the price and volume, processing the DOM. See the volume in a better way. See the support and resistance and the possibility of breakouts of them. Input up to 20 price levels to see where the volume is trading and what side. The indicator was made from an EA by denkir but it needed include files to work so I developed and indictor from this out of MQL5 how to cookbook article here: https://www.mql5.com/en/articles/1793 . It can be an easy and valuable tool for all.

Better version: https://www.mql5.com/en/market/product/110194 This indicator does not delete the previous zones like most supply and demand indicators, it is opensource but made into non repaint. It is comparable to any of the more expensive brands on the market. It works on any time frame. The levels will add and make more lines if time frames are switched back and forth. It is best to leave on 1 time frame and don't switch back and forth. There are only 2 inputs which are: narrow bands re
Aktualisieren! Den Ebenen 100 und 200 wurden Pfeile hinzugefügt.
Dieser Indikator ist genau für den Zugang zu Extremen und Unterstützungen für Kaufpositionen, hauptsächlich für 1-Minuten-Zeitrahmen. Andere Zeitrahmen können verwendet werden, aber die Ebenen sind unterschiedlich. Es ist ein besserer Oszillator und vergleicht sich mit anderen, um den Unterschied zu sehen.
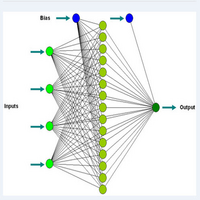
Tageshandel mit neuronalen Netzwerkkonzepten. Dieser Indikator verwendet elementare Formen von Neuronetzwerken, um Kauf-

OPTIMIEREN SIE VOR DEM TESTEN UND VERWENDEN, UM DIE BESTEN EINGABEN ZU FINDEN
Hallo ihr Händler! Möchten Sie einen hochmodernen Expert Advisor für Ihre MT4-Plattform? Dann sind Sie bei Evolved Trends genau richtig! Dieser leistungsstarke Handelsalgorithmus, der mit maschineller Lerntechnologie erstellt wurde, konzentriert sich auf den Handel mit GBP/USD in Zeitrahmen von einer Stunde. Aber hey, experimentieren Sie ruhig mit anderen Assets und Zeitrahmen zur Optimierung! Passen Sie die Eingabe

DAYTRADING nur für Aktien (CFDs).
Der Handel erfordert Arbeit. Es gibt keine Abkürzungen oder Indikatoren, die Ihnen alle Ein- und Ausgänge mitteilen. Profit kommt von der Geisteshaltung. Indikatoren sind Werkzeuge, die in Verbindung mit Geldmanagement und Erfolgspsychologie verwendet werden. Finden Sie Ungleichgewichte im Volumenprofil. Handelspreis-Volumen-Ungleichgewichte.
Viele Ungleichgewichte treten beim Schließen und Öffnen und bei Nachrichten auf. Sehen Sie sich die Käufer vs. Verkä

OPTIMIZE EA BEFORE TEST AND USE. Bitcoin M5 is for trading BTC/USD on 5 min charts. SL and TP should Start with 50000. OPTIMIZE BEFORE USE The trading strategy uses Bollinger Bands and Envelopes indicators to trade from. Trading to catch some breakout points of where the price breaches the bands and then exiting when the price crosses the envelopes. Every trade uses a fixed lot amount and has a SL and TP. The EA does not use martingale or hedging in the logic.
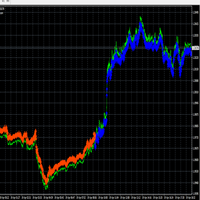
Geduld ist der Schlüssel zum stressfreien Scalping. Traden Sie die Pfeile, wenn Sie sehen, dass sie den gleitenden Durchschnitt von 200 überschreiten, und machen Sie einen Trend, indem Sie ohne gleitenden Durchschnittfilter nach außen oder vom letzten Swing-Punkt ausgehen. Schön für 1-Minuten-Zeitrahmen, um Intraday-Bewegungen aufzunehmen. Nehmen Sie mit Leichtigkeit 20 Pips oder bleiben Sie länger für größere Trends, indem Sie nachlaufende Stopps verwenden. Schauen Sie sich die Beispiele auf d

Dieser Indikator gilt nur für XAU/USD, 1-Minuten-Charts. Jedes Paar hat einzigartige Eigenschaften und Preisbewegungen.
Handeln Sie mit diesem Indikator V-förmige Umkehrungen. Scalp kauft mit Trailing Stops und vermeidet Nachrichten, da diese extremer sind und zu plötzlichen Ausverkäufen führen können.
Fügen Sie im Backtest einen Zeitrahmen von 1 Minute hinzu und sehen Sie sich die Umkehrkäufe an. Der Indikator wird niemals neu gezeichnet oder neu berechnet.
HANDEL NUR WÄHREND DER AKT

This is based on short term strength or weakness and not on moving averages. Moving averages are used for filter only. Trade supply and demand with arrows. Supply and demand breakouts and strength of the buyers or sellers . Don't trade buy arrow to sell arrow. Trade the strength with trendlines or moving averages and use stops. The arrow can have some strong moves. Trade on all time frames. Try it out in the back tester. The pips can be made with this indicator, follow the arrows and mak

Master scalping with this indicator. Trade on any time frame for scalps on buy or sells. Follow trends using a 200 moving average and stops and targets. Use with your own system. This indicator can give pips if following it correctly. Stick to rules and pick up pips daily. Use as entries in a trend, scalp for a few pips or exit on opposite signal. Best to follow higher time frame trends. Indicator doesn't repaint or recalculate. Rules: Don't trade overnight, only trade during active sessi

This indicator is good for small time frames like 1 and 5 minutes and made for day trading. The indicator never repaints or recalculates. The indicator works is for trading swing points in day trading, following bulls or bears. Its a simple to use, non cluttered indicator with a high success rate. This indicator works well to capture ranges. All indicators come with limitations and no indicator or system is always accurate. Use money management for long term trading success. Place in backte

This is the DayTradeKing for gold on a 1 minute time frame. It is a different calculation for the range. Use a 200 period moving average as a filter. Always use stops and avoid news, wait for more conformation. This looks to capture intraday ranges. Put it in the back tester on 1 minute to see the price action and how it works. Trade with trend Use filter Use stops Alerts are added for pop ups and sound.
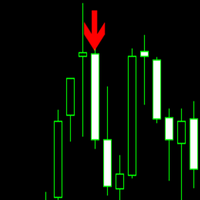
Trade trends with the Super Scalper Use on all time frames and assets it is designed for scalping trends. Works good on small time frames for day trading. The arrows are easy to follow. This is a simple no repaint/no recalculate arrow indicator to follow trends with. Use in conjunction with your own system or use moving averages. Always use stops just below or above the last swing point or your own money management system The indicator comes with push notifications, sound alerts and email
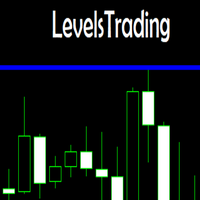
This indicator is a simple stripped down version of any advanced support and resistance indicator. All the support and resistance indicators work from a number of bars that have developed over time. Get rid of clutter and confusing levels. Find levels according to a number of bars. Look at days, session, numbers of hours, periods of consolidation. Watch levels develop and use as breakout points, or areas of buyers and sellers. Features and things to consider This indicator is for a frame of
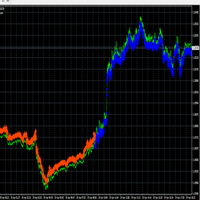
https://www.mql5.com/en/market/product/57345 Dieser EA basiert auf dem Forex Reversal Indikator. Wenn Sie es vorziehen, das System manuell zu handeln, laden Sie den Indikator herunter und probieren Sie es aus.
Der EA folgt dem Trend und eröffnet dementsprechend Positionen. Die Ergebnisse zeigen stabile Gewinne mit geringerem Drawdown, aber experimentieren Sie damit im Backtester, Optimierer und Zeitrahmen, um zu sehen, was funktioniert. Alle gezeigten Ergebnisse sind hypothetisch.
Hinweis:

Automatisieren Sie den Angebots- und Nachfragehandel. Machen Sie einen Markt.
Dieser EA wurde von dem beliebten Angebots- und Nachfrageindikator erstellt und inspiriert, den jeder verkauft und nachahmt. Der EA handelt und sichert weiter und bildet einen Markt. Kann auch auf Nicht-Hedging-Konten gehandelt werden. Man muss Risiken einschätzen und Zeitrahmen, Losgrößen und Hedging-Möglichkeiten nutzen. Ich habe es insgesamt ungefähr einen Monat lang gehandelt, und zwar mit mehreren Paaren gle

Top Trader Indicator
This is an arrow reversal indicator. This is with deviations and arrows. Trade a blue arrow for buy and trade a red arrow for sell. Change the time period and the deviations of the bands. This is similar to others but these arrows don't repaint. Load in back tester and study which periods and deviations work the best. It works on all time frames. 15 min to 1 hr would give good results for take profits. Try according to your own risk management.

Quant Bot ist für den Trendhandel im einstündigen Zeitrahmen für den EUR/USD vorgesehen. Es gibt keine festgelegte Datei, aber wenn andere Paare verwendet werden, muss sie möglicherweise optimiert werden.
Über den Bot:
Es verwendet genetische Erzeugung und verwendet ATR für den Handel. Die Walk-Forward-Periode wurde verwendet, um eine Kurvenanpassung zu verhindern Der EA verwendet Stopps bei jedem Trade. Geldmanagement ist eine Aufwärtsskalierung mit % des Guthabens Die Backset-Periode ist

FÜR XAU/USD
Dies ist ein stabiles Handelssystem, das Zufallsgenerierungen und Trendfolge-Handel verwendet. Der Experte wurde mit Qualitätsdaten rückgetestet, absolvierte einen Optimierungszeitraum zusammen mit einer Monte-Carlo-Simulation, um eine Überanpassung an XAU/USD 1-Stunden-Zeitrahmen zu vermeiden. Stop-Loss und Take-Profit werden verwendet. Der EA hat mehrere Konfigurationen und es gibt nichts anderes zu tun, als herauszufinden, wie viele Lots gehandelt werden sollen.
Feature:

*EA VOR DER VERWENDUNG OPTIMIEREN*
Optimierte Forex-Handelsstrategie für EUR/USD
Mit einem Expert Advisor (EA) innerhalb von ein oder zwei Jahren ein beträchtliches Vermögen zu erreichen, ist eine unrealistische Behauptung. Backtesting und realer Handel konzentrieren sich auf das Währungspaar EUR/USD.
Über diese Strategie:
Dies stellt die erste Iteration unserer Strategie dar, mit dem Potenzial für weitere Fortschritte. Es wurde streng mit 100 % Qualitätsdaten getestet und ist frei von

Down Under handelt das AUD/USD-Paar in einem Zeitrahmen von 1 Stunde.
Dieser EA handelt mit ATR und OHLC. Es ist für dieses Paar in diesem Zeitrahmen formatiert. Compoundierung wird mit einer min. Losgröße und max. Losgröße. Der Prozentsatz des Guthabens wird auf den Gewinn von Trades aufgezinst. Wenn der Saldo schwankt, schwankt auch die Losgröße.
Einstellungen:
mm Risiko % mm Lose maximale Lose Es gibt nichts mehr zu ändern. Dies hat keine Martingal- oder Hedging-Fähigkeiten. Die ei

GBP/USD 1 hr.
Dieser EA handelt Momentum und Sitzungen. Dies hat eine feste Chargenkomponente und wird das TP im Laufe seiner Entwicklung weiter modifizieren.
Einstellungen:
Losgröße
Es gibt nichts mehr zu ändern. Dies hat keine Martingal- oder Hedging-Fähigkeiten. Die einzige andere Funktion, die geändert werden muss, ist, wenn Sie CFDs von GBP/USD handeln. Ändern Sie dies durch die Dezimalstelle auf der Broker-Plattform.
Risikohinweis
Futures, Optionen und Devisenhandel hab

Euclidean ist ein einzigartiger Handelsalgorithmus, den ich vor 8 Jahren entwickelt habe. Dieser EA ist Teil dieses Systems. Es funktioniert als geschlossenes System. Der EA initiiert einen Kauf, wenn der Winkelgrad richtig ist, um einen Trend zu erkennen. Der Stop-Loss beträgt 10 % vom Winkel. So einfach ist das.
Eingänge: % des Saldos in Lots 1 Micro-Lot für 1.000 $ % des Restbetrags in Losen Volume Upper Lots = die maximale Anzahl an Lots Take-Profit-Level = Standard ist 50 Pips Wie und

EIN INDIKATOR FÜR ALLE Pip Scalper dient zum Scalping von Trends. Bleiben Sie mit diesem Indikator länger im Trend. Es funktioniert in allen Zeitrahmen und Assets. Holen Sie sich mit diesem Tool täglich Pips. Verwenden Sie den gleitenden Durchschnitt von 200, um Trades zu filtern. Kleinere Zeitrahmen empfohlen. Verwenden Sie für Daytrading.
Über und wie zu verwenden:
Pips Scalper basiert auf längerfristigem Trendhandel. Kaufen Sie auf Blau Verkaufen Sie auf Rot Verwenden Sie den gleiten

Trade any Forex combine out there. Many prop firms offer challenge or instant funding combines. The biggest problem is controlling the loss. With this indicator you can get a visual system that can limit loss and teach discipline. This uses the MACD and the strategy is scalping. You can determine the risk and reward. Visually follow small trends for scalps. Trade during active sessions. It's just a simple system to instill discipline while limiting loss and scalping pips with the paramet

Holy Grail arrow is for scalping. The period you use will determine the trend. You can try different time frames and periods to see what works best for your strategy. Filters can be applied like a moving average or trendlines. The 1 minute works good for scalps and always trade during active periods and avoid consolidation times. Using other indicators to determine trends is recommended but this can also be a free flowing scalping system alone with tp and sl.
Inputs: Period = trend period