Young Ho Seo / Profil
- Information
|
10+ Jahre
Erfahrung
|
62
Produkte
|
1182
Demoversionen
|
|
4
Jobs
|
0
Signale
|
0
Abonnenten
|
https://www.mql5.com/en/market/product/4488
https://www.mql5.com/en/market/product/4475
https://algotrading-investment.com/portfolio-item/harmonic-pattern-plus/
Non Repainting and Non Lagging Harmonic Pattern Indicator – Customizable Harmonic + Japanese Candlestic Pattern Scanner + Advanced Channel + Many more
https://www.mql5.com/en/market/product/41993
https://www.mql5.com/en/market/product/41992
https://algotrading-investment.com/portfolio-item/profitable-pattern-scanner/
Supply Demand Indicator – Multiple Timeframe Scanning Added + Non Repainting + Professional Indicator
https://www.mql5.com/en/market/product/40076
https://www.mql5.com/en/market/product/40075
https://algotrading-investment.com/portfolio-item/ace-supply-demand-zone/
Momentum Indicator – Path to Volume Spread Analysis
https://www.mql5.com/en/market/product/30641
https://www.mql5.com/en/market/product/30621
https://algotrading-investment.com/portfolio-item/excessive-momentum-indicator/
Elliott Wave Indicator for the Power User
https://www.mql5.com/en/market/product/16479
https://www.mql5.com/en/market/product/16472
https://algotrading-investment.com/portfolio-item/elliott-wave-trend/
Forex Prediction - Turn Support and Resistance to the Advanced Strategy
https://www.mql5.com/en/market/product/49170
https://www.mql5.com/en/market/product/49169
https://algotrading-investment.com/portfolio-item/fractal-pattern-scanner/
MetaTrader 4 and MetaTrader 5 Product Page: https://www.mql5.com/en/users/financeengineer/seller#products
Free Forex Prediction with Fibonacci Analysis: https://algotrading-investment.com/2020/10/23/forex-prediction-with-fibonacci-analysis/
Free Harmonic Pattern Signal: https://algotrading-investment.com/2020/12/17/harmonic-pattern-signal-for-forex-market/
============================================================================================================================
Here are the trading education books. We recommend reading these books if you are a trader or investor in Forex and Stock market. In the list below, we put the easy to read book on top. Try to read the easy to read book first and try to read the harder book later to improve your trading and investment.
First Link = amazon.com, Second Link = Google Play Books, Third Link = algotrading-investment.com, Fourth Link = Google Books
Technical Analysis in Forex and Stock Market (Supply Demand Analysis and Support Resistance)
https://www.amazon.com/dp/B09L55ZK4Z
https://play.google.com/store/books/details?id=pHlMEAAAQBAJ
https://algotrading-investment.com/portfolio-item/technical-analysis-in-forex-and-stock-market/
https://books.google.co.kr/books/about?id=pHlMEAAAQBAJ
Science Of Support, Resistance, Fibonacci Analysis, Harmonic Pattern, Elliott Wave and X3 Chart Pattern (In Forex and Stock Market Trading)
https://www.amazon.com/dp/B0993WZGZD
https://play.google.com/store/books/details?id=MME3EAAAQBAJ
https://algotrading-investment.com/portfolio-item/science-of-support-resistance-fibonacci-analysis-harmonic-pattern/
https://books.google.co.kr/books/about?id=MME3EAAAQBAJ
Profitable Chart Patterns in Forex and Stock Market (Fibonacci Analysis, Harmonic Pattern, Elliott Wave, and X3 Chart Pattern)
https://www.amazon.com/dp/B0B2KZH87K
https://play.google.com/store/books/details?id=7KrQDwAAQBAJ
https://algotrading-investment.com/portfolio-item/profitable-chart-patterns-in-forex-and-stock-market/
https://books.google.com/books/about?id=7KrQDwAAQBAJ
Guide to Precision Harmonic Pattern Trading (Mastering Turning Point Strategy for Financial Trading)
https://www.amazon.com/dp/B01MRI5LY6
https://play.google.com/store/books/details?id=8SbMDwAAQBAJ
http://algotrading-investment.com/portfolio-item/guide-precision-harmonic-pattern-trading/
https://books.google.com/books/about?id=8SbMDwAAQBAJ
Scientific Guide to Price Action and Pattern Trading (Wisdom of Trend, Cycle, and Fractal Wave)
https://www.amazon.com/dp/B073T3ZMBR
https://play.google.com/store/books/details?id=5prUDwAAQBAJ
https://algotrading-investment.com/portfolio-item/scientific-guide-to-price-action-and-pattern-trading/
https://books.google.com/books/about?id=5prUDwAAQBAJ
Predicting Forex and Stock Market with Fractal Pattern: Science of Price and Time
https://www.amazon.com/dp/B086YKM8BW
https://play.google.com/store/books/details?id=VJjiDwAAQBAJ
https://algotrading-investment.com/portfolio-item/predicting-forex-and-stock-market-with-fractal-pattern/
https://books.google.com/books/about?id=VJjiDwAAQBAJ
Trading Education Book 1 in Korean (Apple, Google Play Book, Google Book, Scribd, Kobo)
https://books.apple.com/us/book/id1565534211
https://play.google.com/store/books/details?id=HTgqEAAAQBAJ
https://books.google.co.kr/books/about?id=HTgqEAAAQBAJ
https://www.scribd.com/book/505583892
https://www.kobo.com/ww/en/ebook/8J-Eg58EDzKwlpUmADdp2g
Trading Education Book 2 in Korean (Apple, Google Play Book, Google Book, Scribd, Kobo)
https://books.apple.com/us/book/id1597112108
https://play.google.com/store/books/details?id=shRQEAAAQBAJ
https://books.google.co.kr/books/about?id=shRQEAAAQBAJ
https://www.scribd.com/book/542068528
https://www.kobo.com/ww/en/ebook/X8SmJdYCtDasOfQ1LQpCtg
About Young Ho Seo
Young Ho Seo is an Engineer, Financial Trader, and Quantitative Developer, working on Trading Science and Investment Engineering since 2011. He is the creator of many technical indicators, price patterns and trading strategies used in the financial market. He is also teaching the trading practice on how to use the Supply Demand Analysis, Support, Resistance, Trend line, Fibonacci Analysis, Harmonic Pattern, Elliott Wave Theory, Chart Patterns, and Probability for Forex and Stock Market. His works include developing scientific trading principle and mathematical algorithm in the work of Benjamin Graham, Everette S. Gardner, Benoit Mandelbrot, Ralph Nelson Elliott, Harold M. Gartley, Richard Shabacker, William Delbert Gann, Richard Wyckoff and Richard Dennis. You can find his dedicated works on www.algotrading-investment.com . His life mission is to connect financial traders and scientific community for better understanding of this world and crowd behaviour in the financial market. He wrote many books and articles, which are helpful for understanding the technology and application behind technical analysis, statistics, time series forecasting, fractal science, econometrics, and artificial intelligence in the financial market.
If you are interested in our software and training, just visit our main website: www.algotrading-investment.com
Finally we have double Harmonic Volatility Indicator for Meta Trader 5 is out now.
Please check it out.
https://www.mql5.com/en/market/product/23769
For Meta Trader 4, you can find out here:
https://www.mql5.com/en/market/product/23779
Never trade without having the full picture of the market volatility.
https://www.mql5.com/en/users/financeengineer/seller#products
http://algotrading-investment.com/
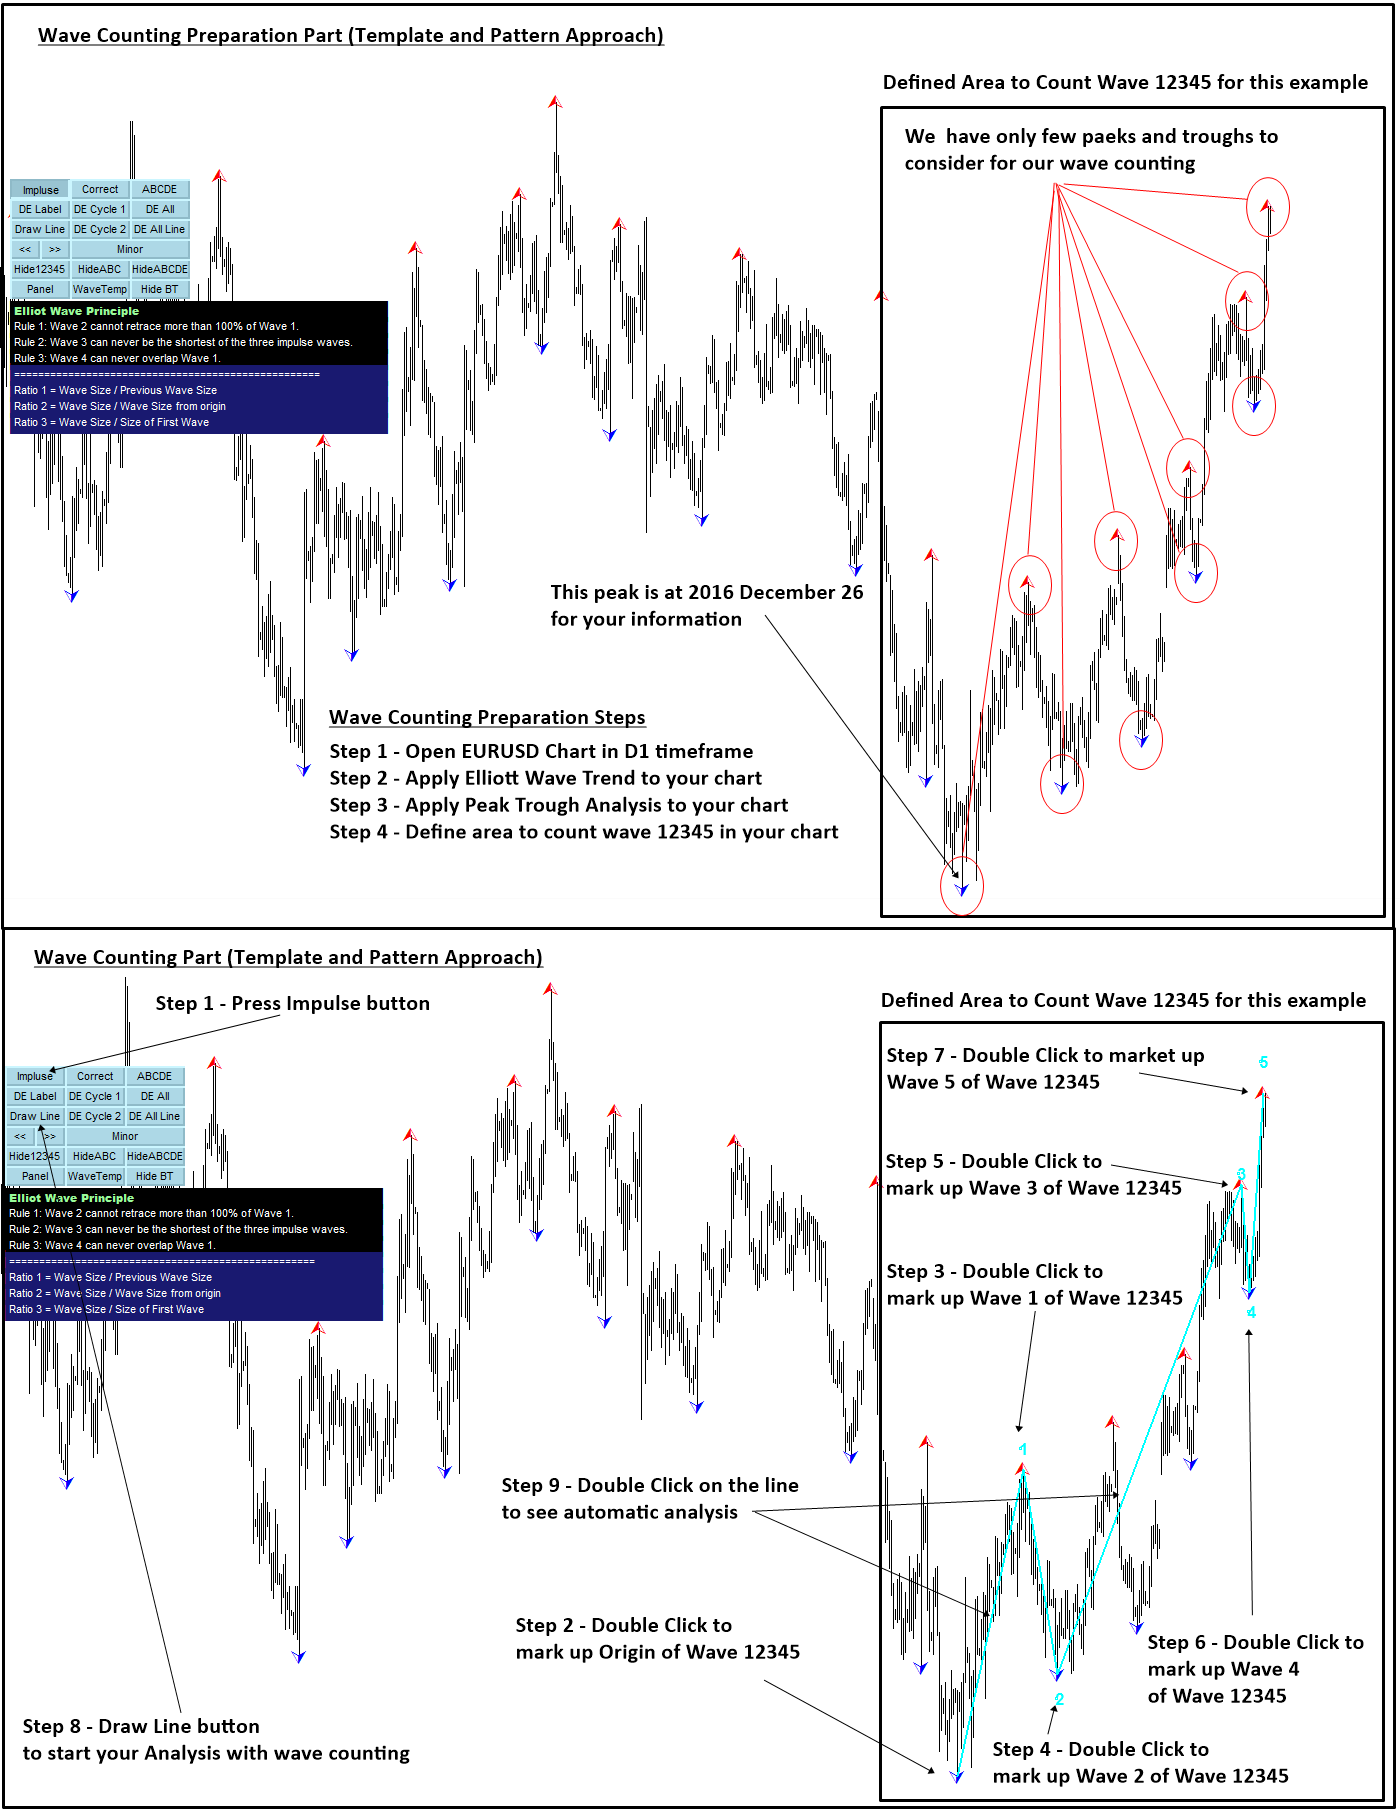
In this article we will explain how to start Elliott Wave Trend in Brief. This is the brief guideline of the Template and Pattern Approach towards the Scientific Elliott Wave Counting described in this book: Practical Price Action and Pattern Trading: 2nd Training in Price Action and Pattern Trading Course
https://www.amazon.com/gp/product/B071V7CXGM/ref=oh_aui_d_detailpage_o00_?ie=UTF8&psc=1
If you are starters and new to Elliott Wave Trend, please download the peak-trough analysis before starting this tutorial. Here is download link for MT4 and MT5 respectively:
https://www.mql5.com/en/market/product/23797
https://www.mql5.com/en/market/product/22420
To prepare wave counting, follow these four steps first.
Step 1 - Open EURUSD Chart in D1 timeframe
Step 2 - Apply Elliott Wave Trend to your chart
Step 3 - Apply Peak Trough Analysis to your chart
Step 4 - Define area to count wave 12345 in your chart
Then follow the rest of instruction from the screenshots.
You will find that more you do this, more comfortable with your wave counting.
You will also find that you can almost eliminate the subjectivity in your wave counting.
In addition use Wave Score to perfect your wave counting.
There are also two more articles you can read for further guidance for our Elliott Wave Trend.
http://algotrading-investment.com/2017/02/18/basic-tutorial-elliott-wave-1-2-3-4-pattern-identification/
http://algotrading-investment.com/2017/02/18/introduction-elliott-wave-trend-wave-structural-score/
https://www.mql5.com/en/users/financeengineer/seller#products
Introduction to Double Harmonic Volatility Indicator Use of the Fibonacci analysis for financial trading can nearly go back to 85 years from today since the birth of Elliott Wave Theory by R. N. Elliott. Until now, traders use the Fibonacci analysis to identify the patterns in the price series. Yet, we could not find any one attempted to use Fibonacci analysis for the Volatility. Harmonic Volatility Indicator was the first technical analysis applying the Fibonacci analysis to the financial
EURUSD is running along with the weekly Harmonic Volatility Line past few days.
This would ends quite good entry for many swing traders for the short selling opportunity which we have described in our latest article about harmonic volatility indicator here:
http://algotrading-investment.com/2017/06/21/next-generation-technical-indicator/
Now, the EURUSD have not changed its direction entirely but stay tuned for further action. The tactical level have not broken yet on EURUSD. :)
https://www.mql5.com/en/users/financeengineer/seller#products
http://algotrading-investment.com/
Current performance of our Pure Algo Trading EA on live test.
Please note that this is medium frequency trading robots. Only expecting to have realistic profit and drawdown. Risk is fully controlled.
https://www.mql5.com/en/signals/103405
https://www.mql5.com/en/signals/312954
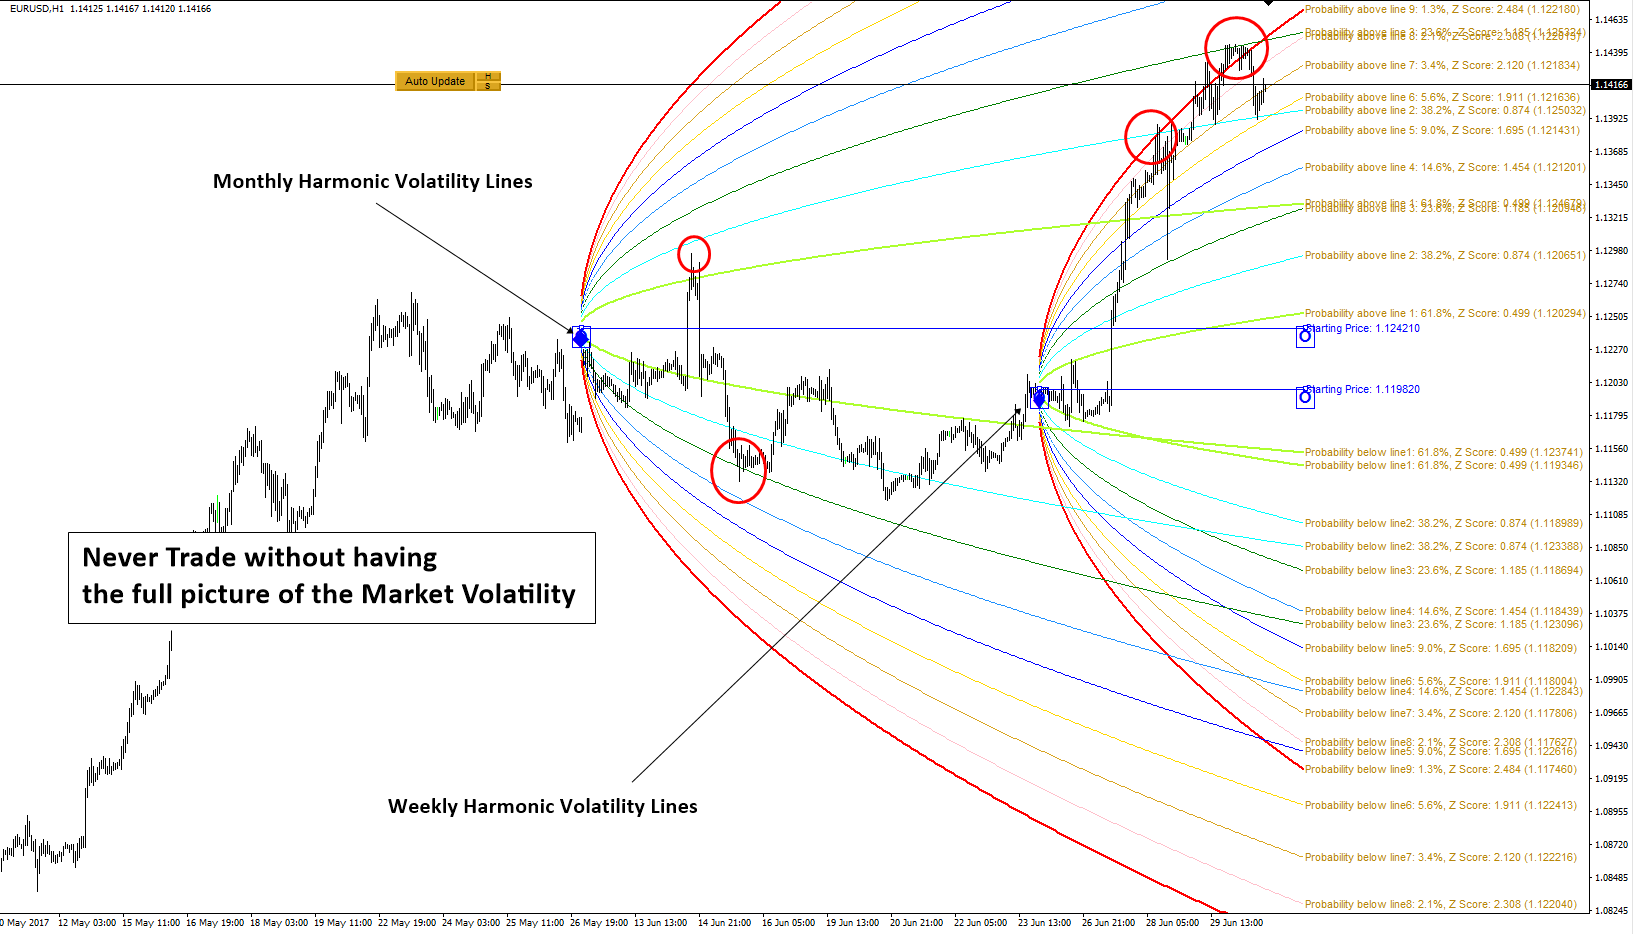
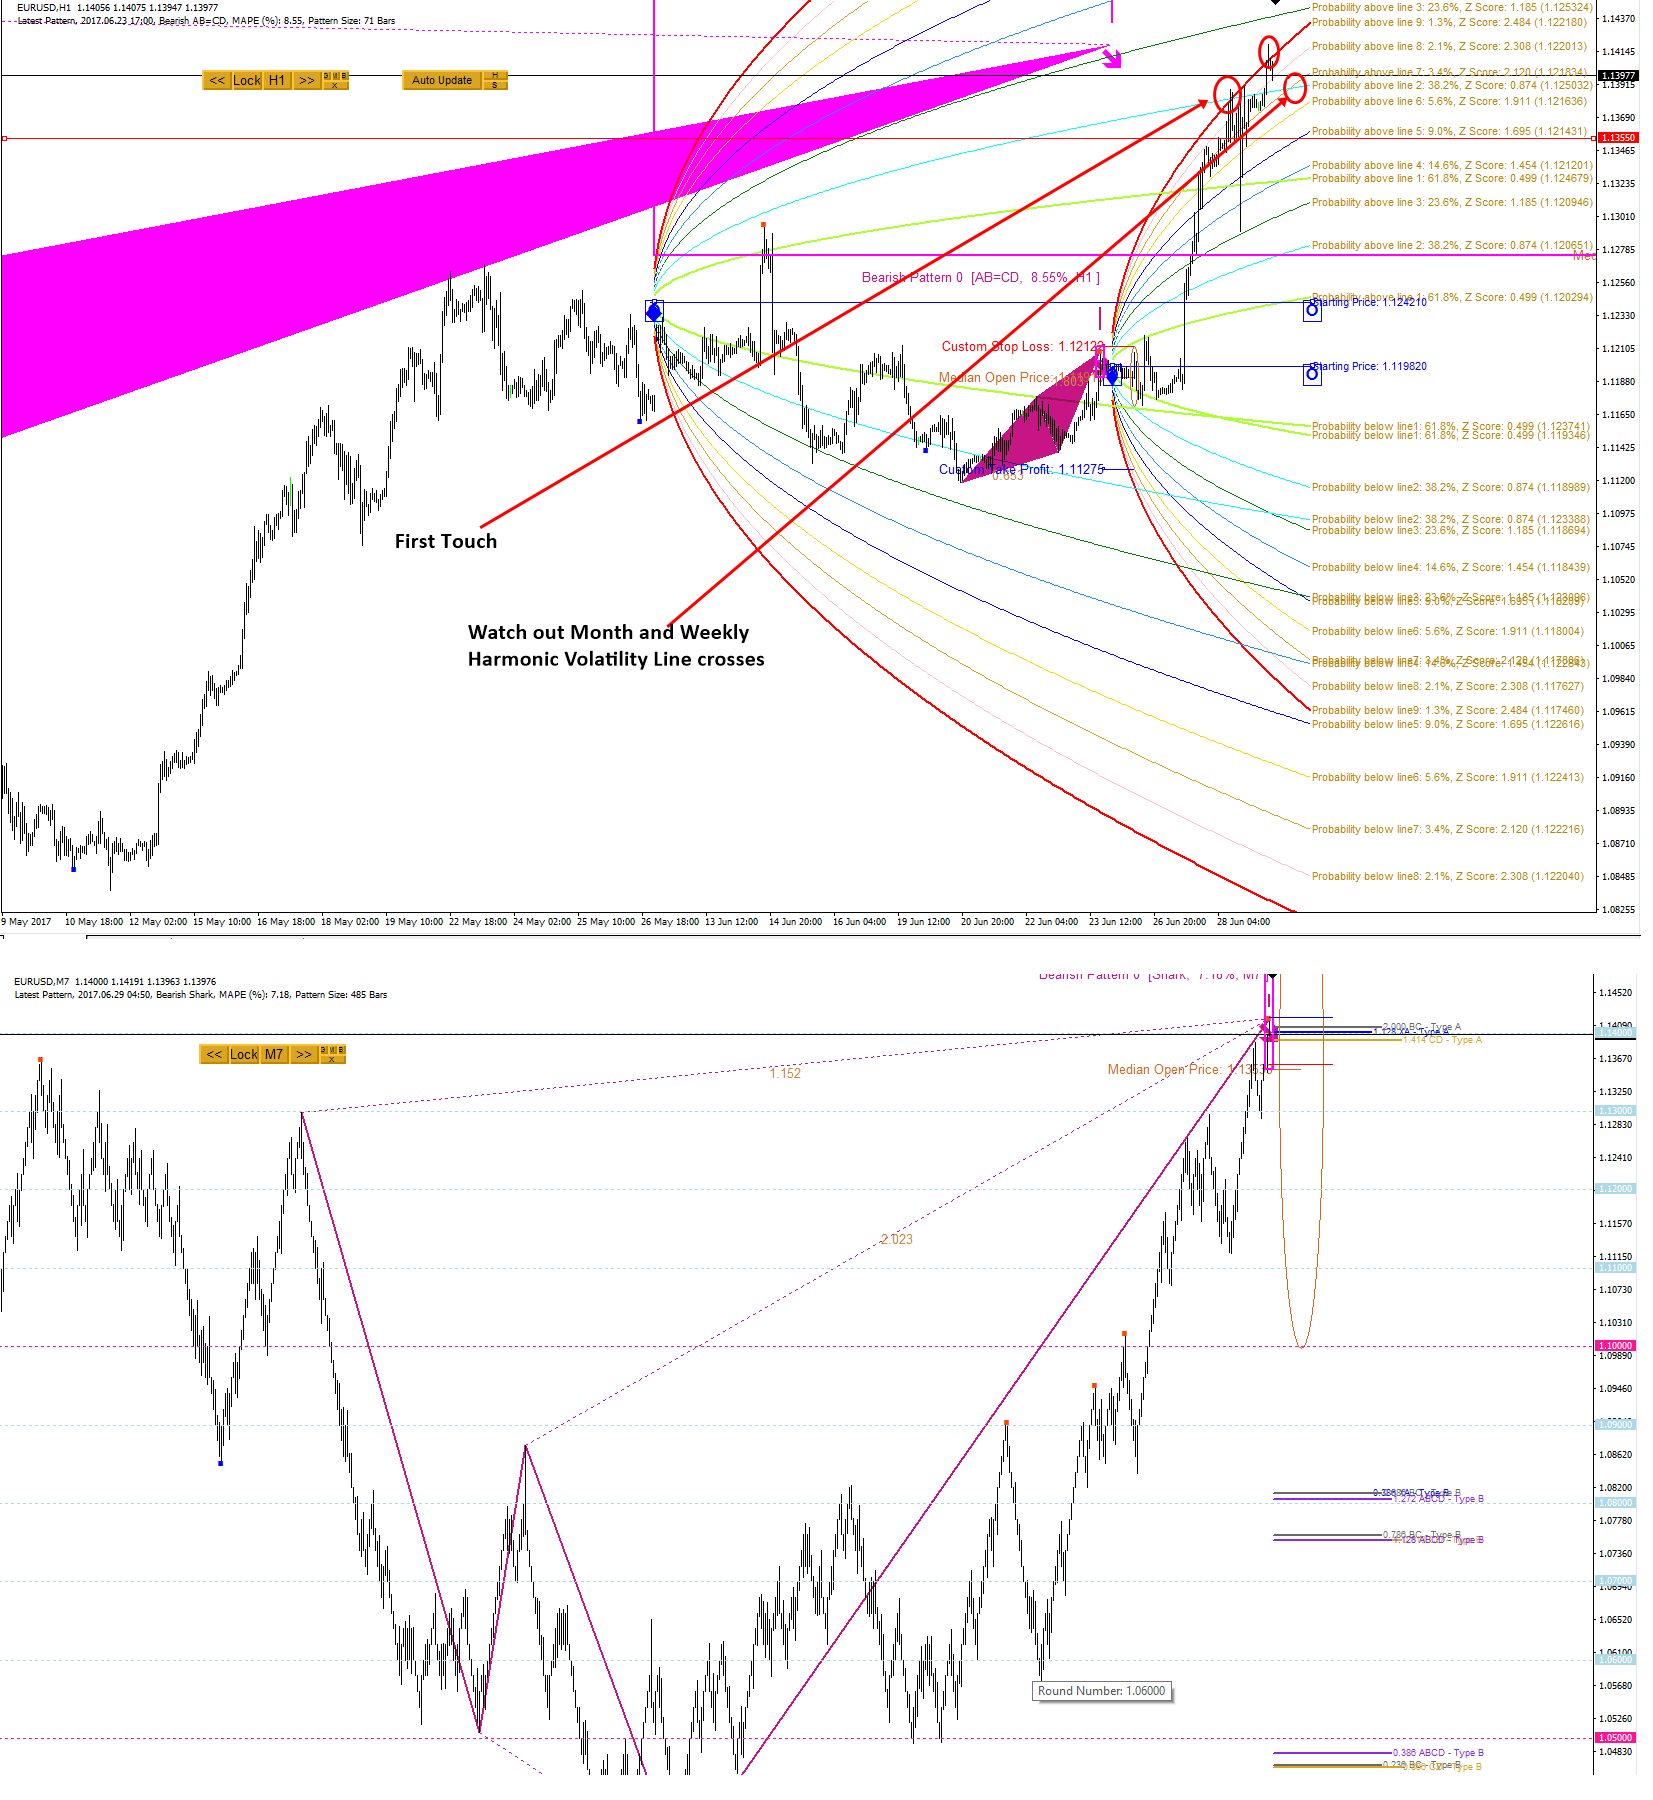
Currently EURUSD is running in the quite stretched volatility mode keep touching the top most harmonic Volatility line two times already. In first touch, there was strong reaction about 80 pips.
Now it have been touching again the top most harmonic volatility line.
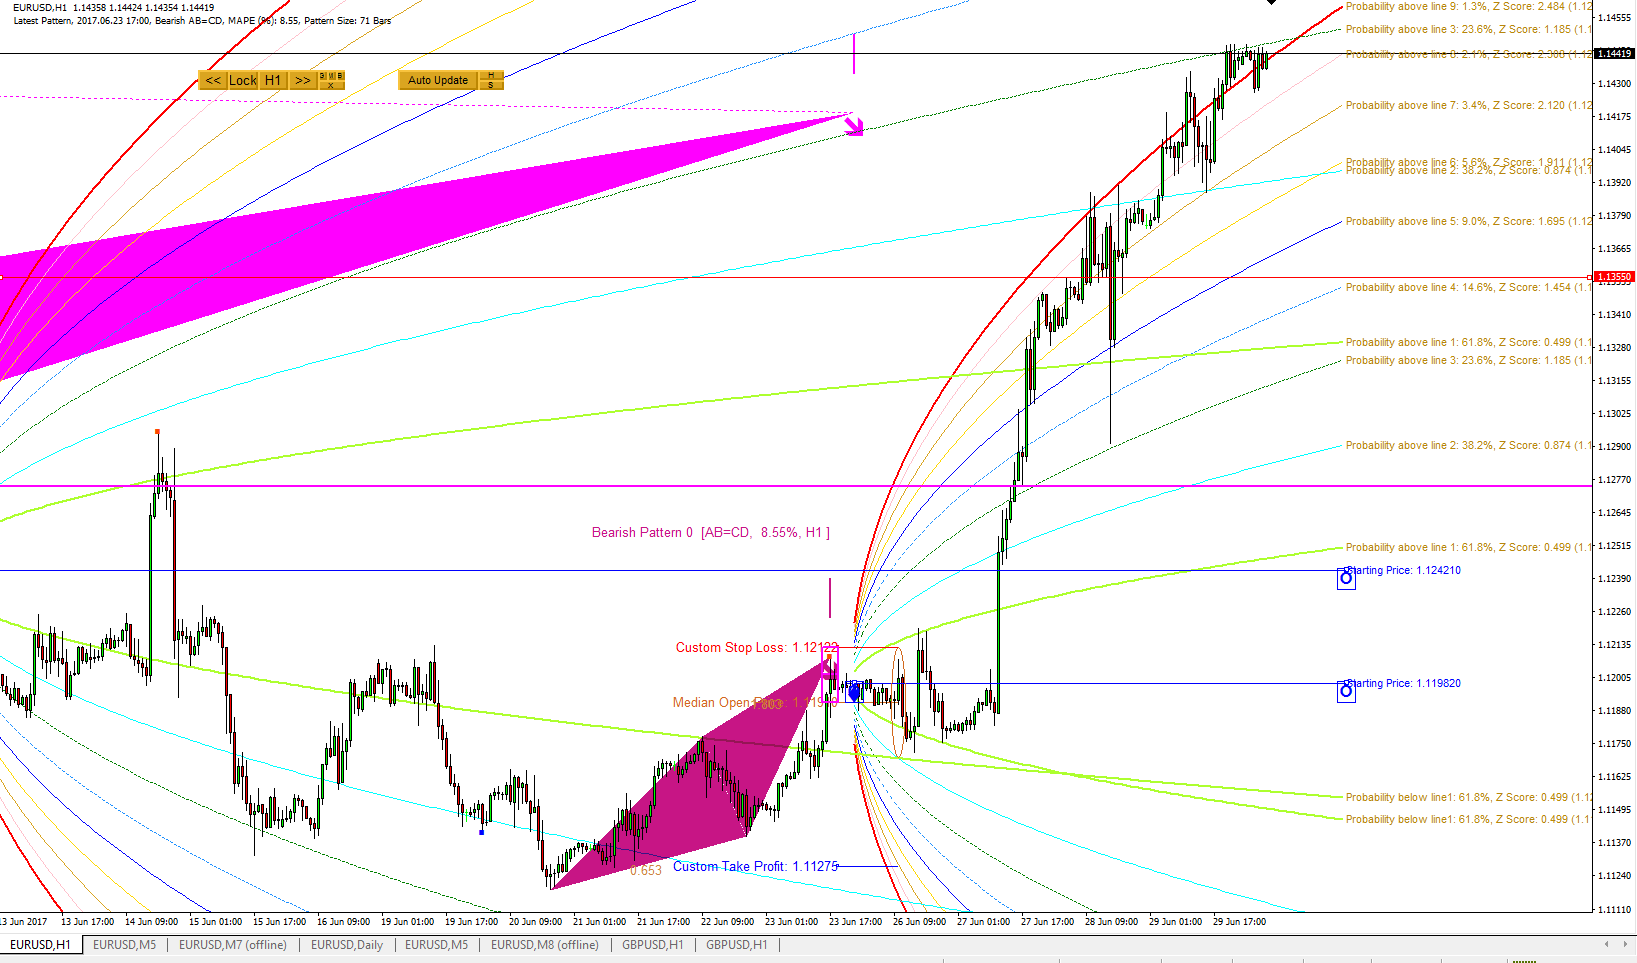
There is also weekly Harmonic BAT Pattern supporting this reaction too. I have just locked the pattern in weekly timeframe and this screenshots is in fact in H1 timeframe. Therefore, it is not easy to see the entire pattern but you can see the final point D at 1.14176 and the Median open price line at 1.12746.
Also the Renko chart, we have Shark patterns at the same place as the Harmonic BAT Pattern.
First tactical place to watch out is to level where two harmonic volatility lines are crosses at 1.13888 (monthly and weekly).
Hope this analysis is helpful for your trading.
https://www.mql5.com/en/users/financeengineer/seller#products
http://algotrading-investment.com/
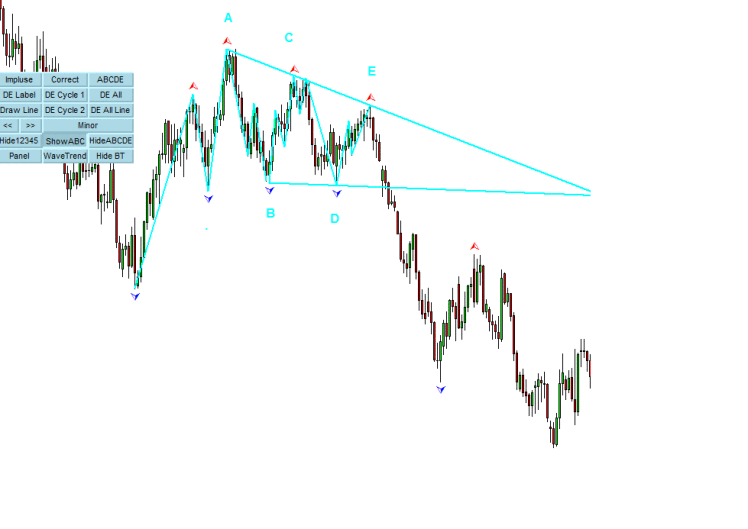
Before using the peak trough analysis tool properly, few things you might need to know. Price Pattern are complex for the financial market. What price patterns are there to make up the path of the price in the financial market? We have listed the potential price patterns you can encounter in the Financial market here and in the book too.
https://algotradinginvestment.wordpress.com/2017/04/27/price-pattern-table-for-equilibrium-fractal-wave-process/
Especially we have emphasized that the price patterns in Forex market are strongly dominated by the Pattern (2,5), (3, 5) and (4,5) in the table or mostly the Pattern in the fifth column in the table.
Unlike the Patterns made up with Wave process (i.e. the patterns in the column 2, 3 and 4), it is not easy to develop a straight forward predictive algorithm or model for the patterns made up from Fractal Wave process.
To deal with such a complex patterns for your trading, the Peak trough tool is effective.
Here are three important application for your trading at least you can conduct with this peak trough analysis.
1.Tradable Pattern Detection - Connect peaks to define the top envelop of the patterns and connect troughs to define the bottom envelops of the patterns.
2.Substantial scenario reduction in Elliott Wave Counting - the Peak trough analysis can help you to eliminate thousands of potential scenarios for your Elliott Wave counting in first place. Instead of considering any random price bar for your wave counting, just focus on the peak and trough presented by Peak-Trough Analysis. Save a lot of time and efforts for your wave counting.
3.Ratio analysis- Conduct ratio analysis between peaks and trough to detect repeating price patterns (this might require further automated tools.)
The download link is here for Meta Trader 4:
https://www.mql5.com/en/market/product/23797
The download link is here for Meta Trader 5:
https://www.mql5.com/en/market/product/22420
You can also download it from here:
Algotrading-Investment.com
Peak Trough Analysis is the great tool to detect peaks and troughs in your chart. Peak Trough Analysis tool can use three different peaks and troughs detection algorithm. The three algorithm include the orignal Fractals Indicator by Bill Williams, the Modified Fractals indicator and ZigZag indicator. You can use this peak and trough analysis tool to detect the price pattern made up from Equilibrium Fractal-Wave process. For further usage, there are good guide line on how to use this peak trough
Peak Trough Analysis is the great tool to detect peaks and troughs in your chart. Peak Trough Analysis tool can use three different peaks and troughs detection algorithm. The three algorithm include the orignal Fractals Indicator by Bill Williams, the Modified Fractals indicator and ZigZag indicator. You can use this peak and trough analysis tool to detect the price pattern made up from Equilibrium Fractal-Wave process. For further usage, there are good guide line on how to use this peak trough
Here we show you very simple tip to effectively use our Double Harmonic Volatility Indicator.
Double harmonic Volatility Indicator can be run in more than 4 different modes. One of them can be monthly or weekly mode. You can simply use the default setting of Double harmonic Volatility Indicator to check the volatility of monthly or weekly. Sometimes, you might want to place the Harmonic Volatility Indicator in the previous month or even the month before the previous month. In that case, you can simply use Time Box Indicator because Time Box Indicator can show the month open for any chosen period. You can do the same for week price too.
When the time box indicator show the month price, simply drag the Harmonic Volatility Indicator in your chart to that open price. It is simple as ABC really. See the screenshot for better understanding.
Hope you enjoyed this simple tip.
https://www.mql5.com/en/users/financeengineer/seller#products
http://algotrading-investment.com

Powerful Free tool, Time Box Indicator was released. This free tool is free for everyone. Feel free to use it for your trading.
Here we provide simple instruction for your trading. With our Time Box Indicator, you can extend any significant line for your trading. Set them as your support and resistance and watch out for the potential trading entry.
Unless you are using the Time Box Indicator with any other tools, its basic trading option is simply applying the typical support and resistance knowledge for your trading.
Since the time box indicator marks up for monthly, weekly and daily box in your chart, you can combine it with any other trading system.
For example, you can even use this Time Box Indicator to allocate the Harmonic Volatility Indicator to monthly or weekly open price for your trading. We will explain this deeper in our next article.
If you are looking for the powerful trading system, do not hesitate to visit our website. You can also download the Time Box Indicator from our website or from MQL5.com too.
http://algotrading-investment.com/
https://www.mql5.com/en/users/financeengineer/seller#products

Our Price Breakout Pattern Scanner are serving many Professional traders for their live trading each day, some of them are the official Commodity trading advisors. One very obvious reason for this popularity is because it makes your trading decision so efficient. Precision is good for you. If the precision can be achieved with less efforts, then we call this as marvellous.
Sometimes, my manual analysis misses few important patterns. Remember that Human traders are not perfect and we are emotional. I feel very secured when the price breakout pattern scanner remind me some important patterns which I have missed in my manual analysis.
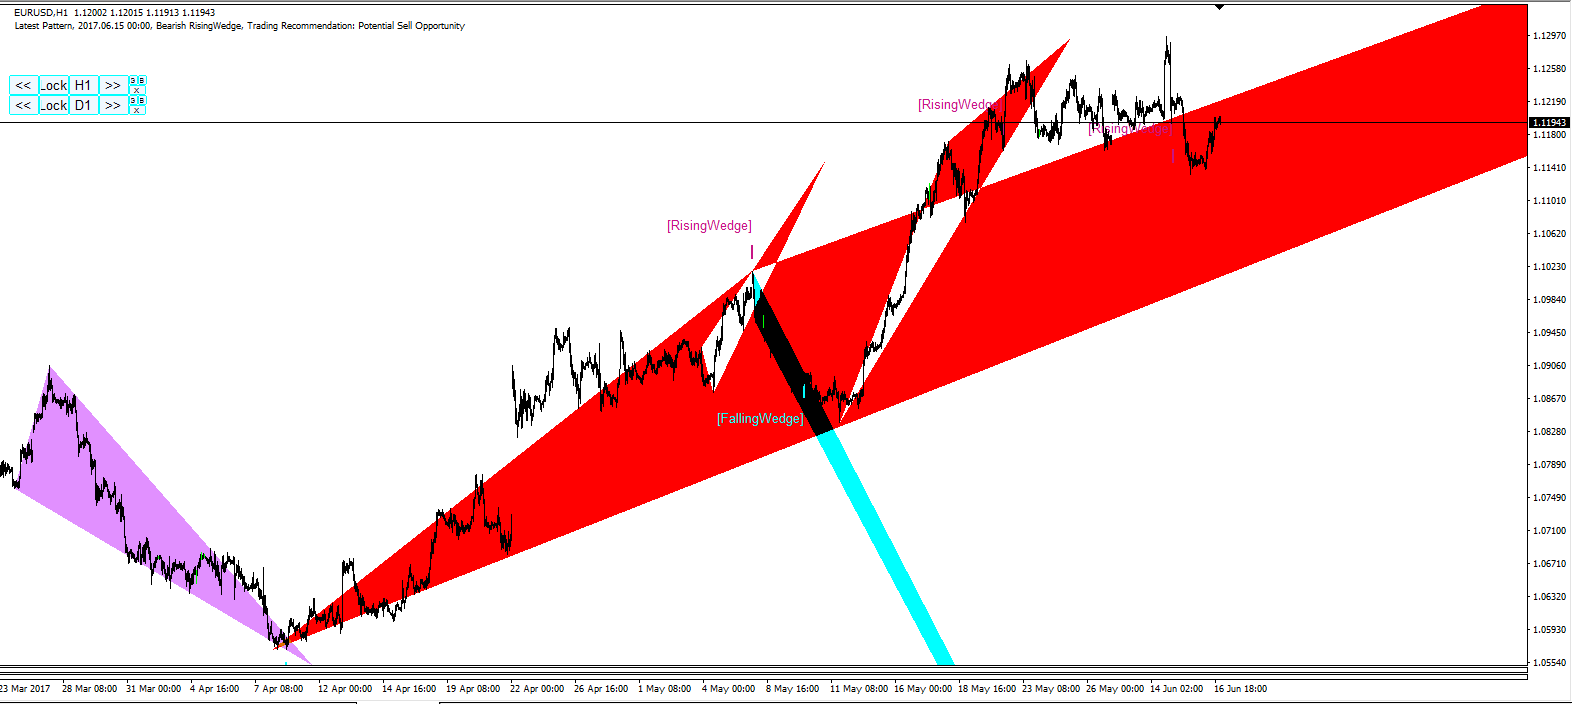
Here we will show you how to use this powerful tool for even more powerful trading. With Price Breakout Pattern Scanner, you can save any price patterns which you believe that is important. You can even check the pattern in daily timeframe, then save the pattern for your hourly analysis. How cools is this?
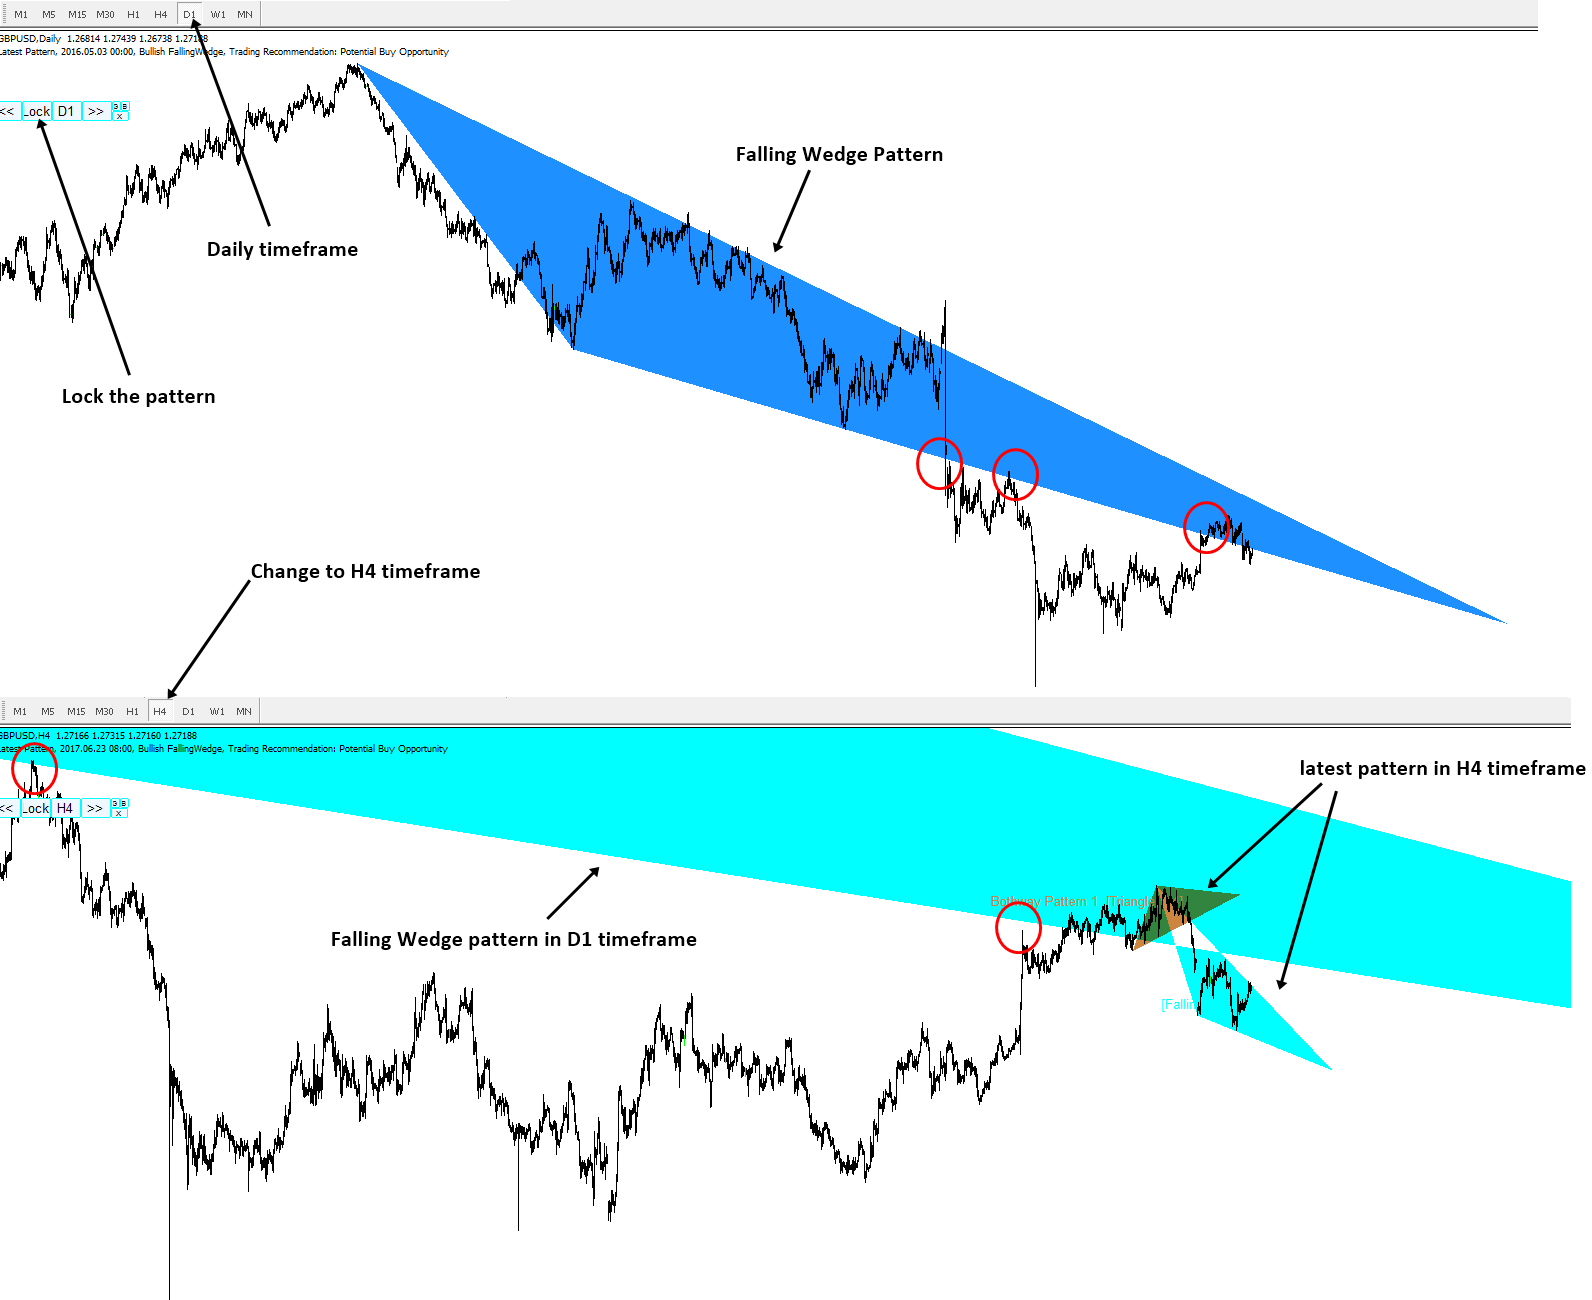
Let us learn the basic steps of saving patterns in your chart. As in the Harmonic Pattern Plus, you can save the patterns in your chart by just click on the Lock button. Click x button in your chart will remove all the saved patterns in your chart. When you remove all the saved patterns in H1 timeframe, it is important to remember that it will only remove the saved pattern in the H1 timeframe.
Now let us do little exercise of saving a pattern in D1 timeframe, then move back to H4 timeframe to make the bird eye view for your trading decision. In EURUSD we have found the falling wedge pattern. You can see that this falling wedge patterns continuously act as very important support and resistance levels in the daily chart. I have circled in red for such moment. Now let's lock this pattern in D1 timeframe since we want to have another analysis in H4 timeframe. In H4 timeframe, you can find two important patterns. You can also lock these patterns in your chart for your trading. As you can see the sub timeframe have their own movement always. It is important for traders to know both of these movement for your trading. Many average traders misses this often.
This is just a simple example for starters. Some experienced traders often conduct through analysis for more timeframe and they make through trading decision.
https://www.mql5.com/en/users/financeengineer/seller#products
http://algotrading-investment.com
If you are starters, you need a structured training course. Feel free to contact us for our official Price Action and Pattern training today. Our training will save you a lot of money before you lose all you capital in the wrong hands. Email: admin@algotrading-investment.com
We are still working to release following products and update on mql5.com.
Price Breakout Pattern Scanner version 6.8 for MT5 version.
Double Harmonic Volatiltiy Line Indicator for MT5 version.
Time Box Indicator for MT4 and MT5 version.
Peak Trough Analysis for MT4 and MT5 version.
Lots of update and release news.
If you need powerful trading system, do not hesitate to visit our website for the best products.
http://algotrading-investment.com/
https://www.mql5.com/en/users/financeengineer/seller#products
We have been developing the technology in the Financial trading and investment application over a decade. Our products and services are the main work horse for many traders and investors across the internet. If you believe that our technology can help you to success for your business, you can always contact us. If you are an individual or firm, feel free to suggest for any constructive business relationship between us.
We are currently providing three existing opportunities for you:
•Profit Sharing for sales and distribution of our products and services as our Affiliate Member
•Signal Providing Opportunity for professional trader with proven track record
•Mutual Business Promotion (Contact us at admin@algotrading-investment.com)
Besides above opportunities, you can contact us for any other business relationship. We are also open to hear from the Entrepreneurs and Investors who are looking to setup the technology venture. In addition, if you are looking to distribute our products and services exclusively to your country or continent, you can negotiate the terms and conditions. Please contact us at admin@algotrading-investment.com.
http://algotrading-investment.com/business-partner/
https://www.mql5.com/en/users/financeengineer/seller#products

With our Harmonic Pattern Plus and Harmonic Pattern Scenario Planner, you can perfectly control the repainting and redrawing issues of the classic Price Action and Pattern Trading. Beside this powerful feature, the highly precise pattern recognition feature of our Harmonic Pattern Plus and Harmonic Pattern Scenario Planner makes these tools to stand out from rest.
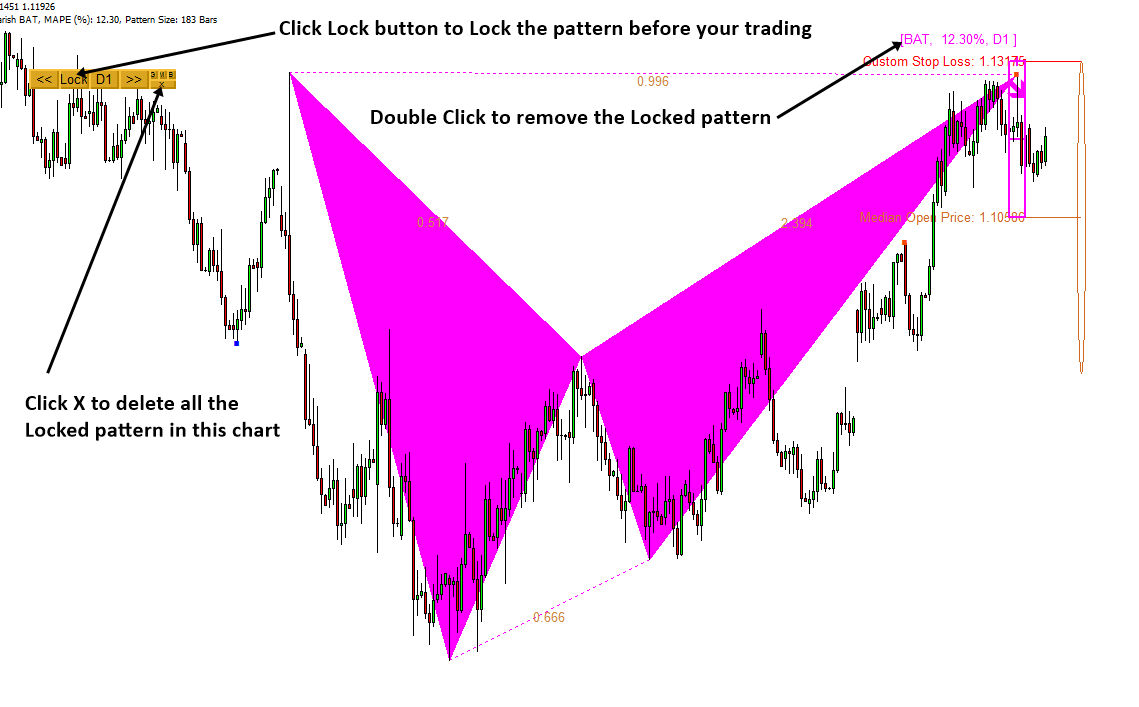
Let us show the simple steps to save the Harmonic Pattern in your chart for future reference purpose. Firstly press "Lock" button in your chart to save the Harmonic Patterns. If you want to remove the locked patterns from your chart, then there are two ways of doing it.
Firstly you can click X button to remove the entire locked patterns. Secondly, you can double click over the name of the patterns to remove the individual patterns from your chart. You might remove the individual patterns by double click on the edge of the pattern occasionally (However, somehow, in MetaTrader, this feature is not perfect. Try to click the edge of the pattern not inside. )
Now here is some advanced trading tips. Saving (locking) the pattern in your chart is very useful because you can take them to lower or higher timeframe too. This naturally reinforce your multiple timeframe pattern analysis. If you want to double confirm your trading signal in both lower and higher timeframe, this feature is very useful.
As usual, this tips are applicable to both Harmonic Pattern Plus and Harmonic Pattern Scenario Planner.
Do not miss our Powerful Trading system which can help your trading enormously.
http://algotrading-investment.com
https://www.mql5.com/en/users/financeengineer/seller#products
Trading and investment is one of the oldest occupation. Plus it is highly rewarded occupation too. Why do you think you can master trading & investment over the night or over the week ?
Please have a read this article for your own good. There are some steps required.
https://algotradinginvestment.wordpress.com/2017/06/24/demo-and-live-trading/
https://www.mql5.com/en/users/financeengineer/seller#products

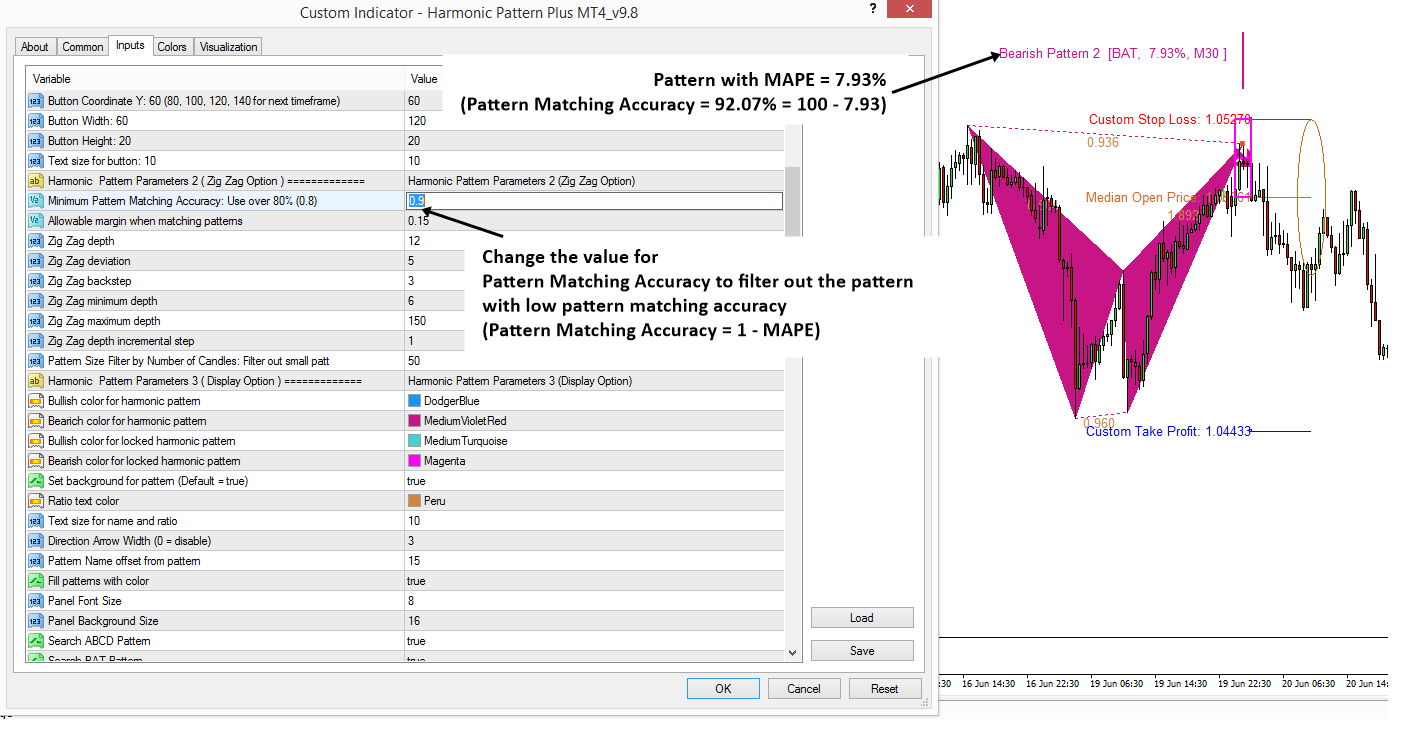
This is applicable to both Harmonic Pattern Plus and Harmonic Pattern Scenario Planner. Here is how to filter out the pattern with low pattern Matching accuracy.
Go to your Input setting and then set the minimum Pattern Matching Accuracy for your trading. In the screenshots, we have set to 0.9 (90%) for our trading.
This means that Harmonic Pattern Plus (or Harmonic Pattern Scenario Planner) will only show the pattern with pattern matching accuracy greater than 90% (0.9).
Typically you can set the minimum pattern matching accuracy over 80% according to your preferences. Remember that if you set the Pattern Matching accuracy too high, then you will not have many patterns to trade.
For your information, Pattern Matching Accuracy = 1 - MAPE (Mean Absolute Percent Error) in our Harmonic Pattern Plus (and Harmonic Pattern Scenario Planner).
Enjoy all the advanced features in our Harmonic Pattern Plus and Harmonic Pattern Scenario Planner for your superb trading performance.
https://www.mql5.com/en/users/financeengineer/seller#products
http://algotrading-investment.com
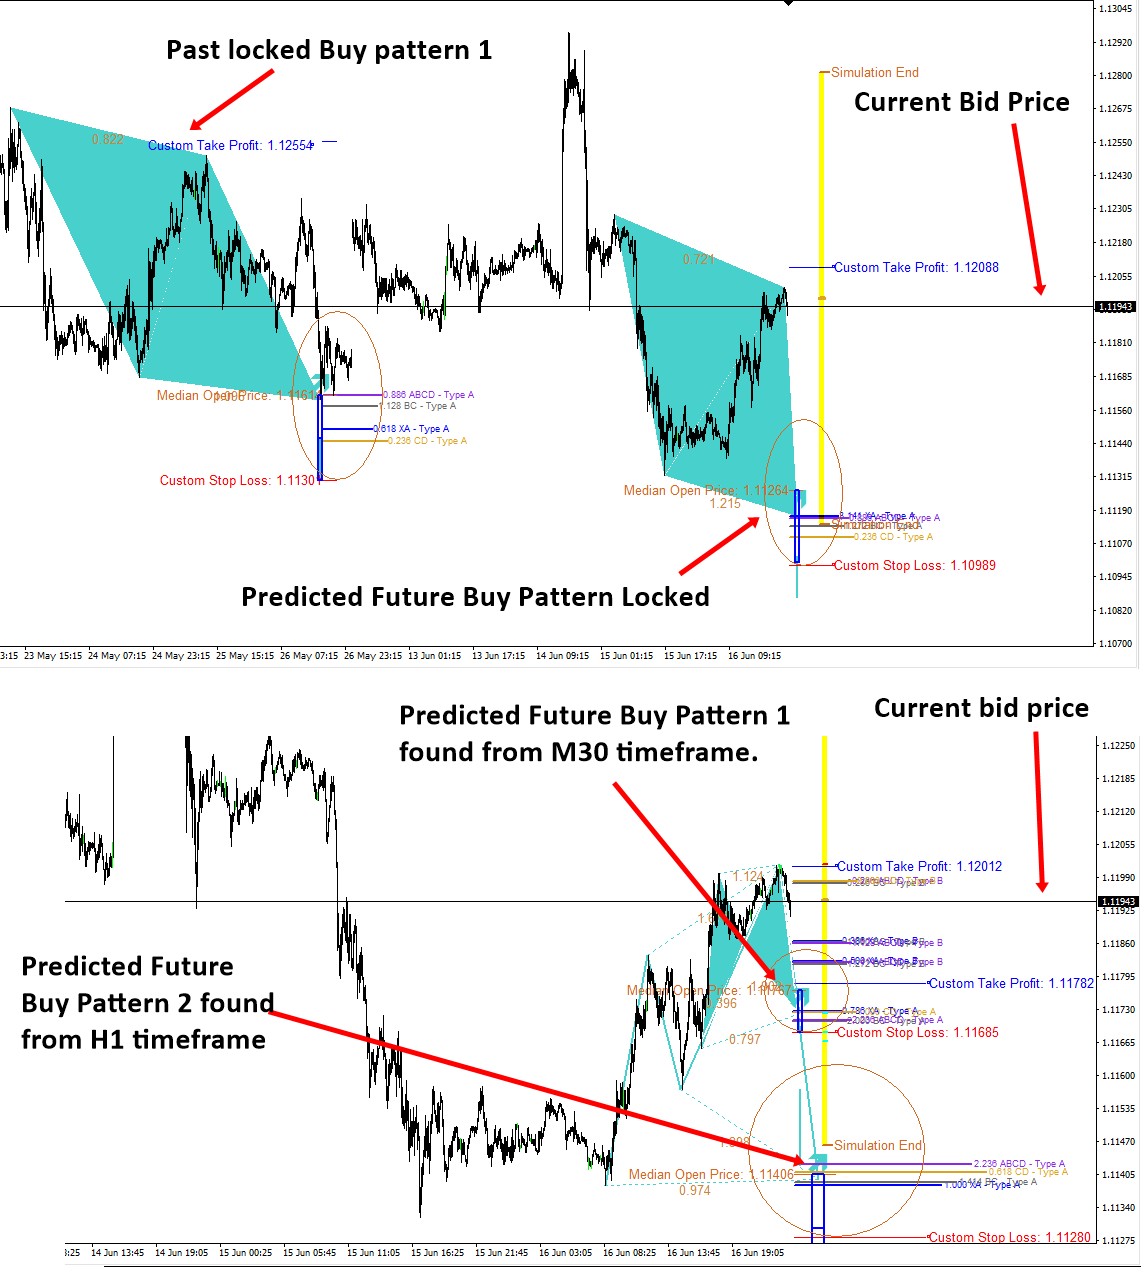
With our Price Action and Pattern Trading, you can fully control the Repainting and Redrawing issue of classic Price Action Trading.
Download the latest version with advanced trading features for the following products.
Price Breakout Pattern Scanner MT4 Version 6.8
Harmonic Pattern Plus MT4/MT5 Version 9.8
Harmonic Pattern Scenario Planner MT4/MT5 Version 9.8
https://www.mql5.com/en/users/financeengineer/seller#products
http://algotrading-investment.com/
https://www.mql5.com/en/market/product/23779
Never trade without the full picture of the market volatility. It is like jumping on the airplane without parachute.
Save your trading today from trading against the Market volatility.
It is also available from http://algotrading-investment.com

Following Products are updated on MQL5.com.
Pair Trading Station MT4/MT5 Version 6.1
Price Breakout Pattern Scanner MT4 Version 6.8
Harmonic Pattern Plus MT4/MT5 Version 9.8
Harmonic Pattern Scenario Planner MT4/MT5 Version 9.8
Please download the latest version for your own goods. All our MT4/MT5 products include free future update.
For your information we are still working on Price Breakout Pattern Scanner MT5 Version 6.8
http://algotrading-investment.com/how-to-update-your-products/
https://www.mql5.com/en/users/financeengineer/seller#products
Kind regards.
