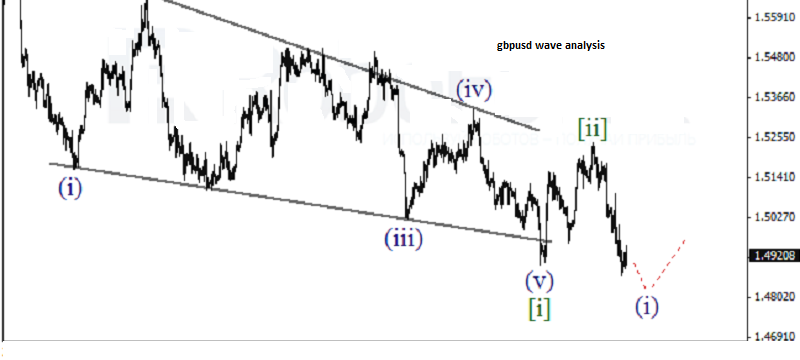
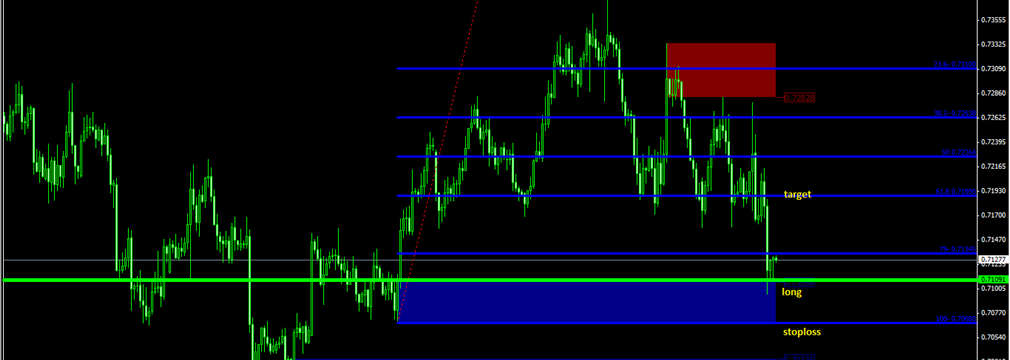
GBP USD, “Great Britain Pound vs US Dollar”Pound has finished the wave [ii]. Earlier, the price completed the descending wedge in the wave [i]. In the nearest future, the pair may finish the wave (c) of [iii] and start a local ascending correction...
Lot size choosing tips: 1,Trade risk should be 3 to 5% on every trade. 2, lot size should be choosed based on stoploss pips not by profit pips Example : capital is 1000$.. then u r risk capital is 30(3%) to 50$(5%) Formula choosing lot size : (Risk
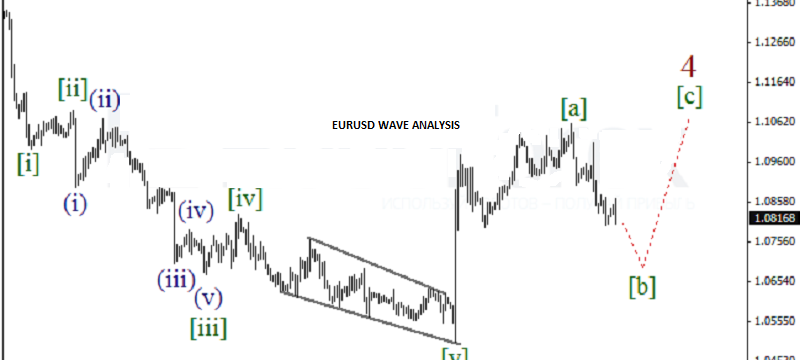
EUR USD, “Euro vs US Dollar” Eurodollar is still forming the wave [b] of 4. Earlier, after finishing the diagonal triangle in the wave [v], the pair formed the ascending wave [a]. In the nearest future, the price may continue falling, but later it is expected to start growing in the wave [c] of 4...
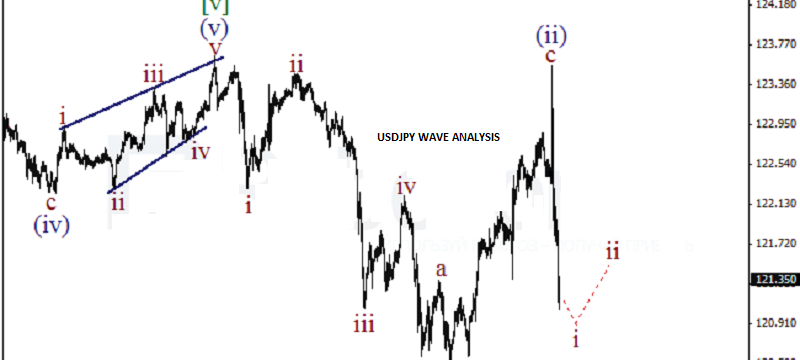
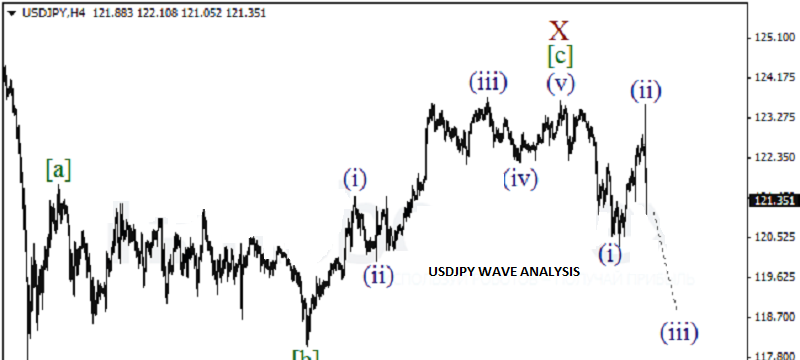
USD JPY, “US Dollar vs Japanese Yen” After finishing the zigzag in the wave X, the price has formed the bearish impulse in the wave (i) and the correction in the form of the flat in the wave (ii). During the next several days, the market may continue falling in the wave (iii...
USD JPY, “US Dollar vs Japanese Yen” It looks like Yen his starting a new decline. After finishing the zigzag in the wave X, the price has formed the bearish impulse in the wave (i) and the correction in the form of the flat in the wave (ii...
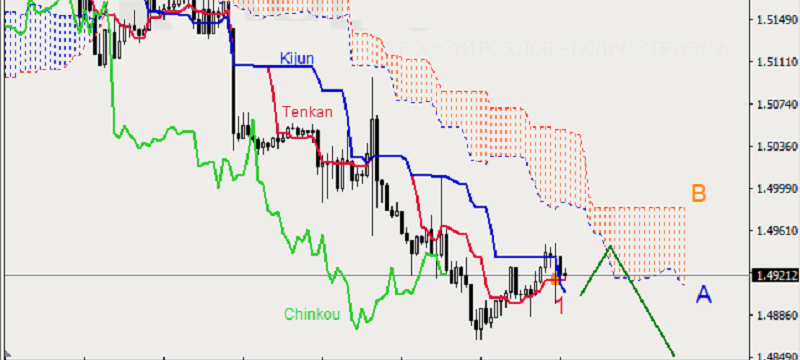
GBP USD, “Great Britain Pound vs US Dollar” GBP USD, Time Frame H1. Indicator signals: Tenkan-Sen and Kijun-Sen are intersecting and forming “Golden Cross” (1). Ichimoku Cloud is going down (2) and widening; Chinkou Lagging Span is on the chart...
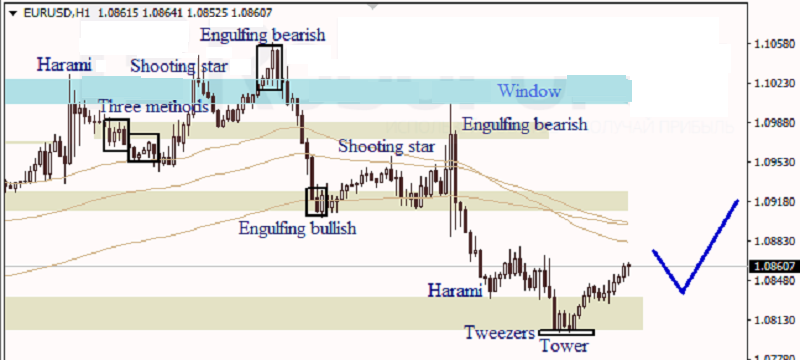
EUR USD, “Euro vs. US Dollar” At the H1 chart of EUR USD, Tower and Tweezers patterns indicated an ascending correction. Three Line Break chart and Heiken Ashi candlesticks confirm a bullish direction...
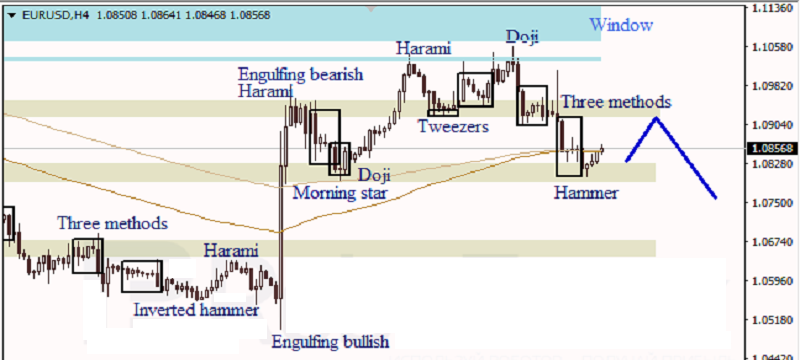
EUR USD, “Euro vs. US Dollar” At the H4 chart of EUR USD, Hammer pattern indicates an ascending movement. Three Line Break chart shows a bearish direction; Heiken Ashi candlesticks confirm a bullish pullback...
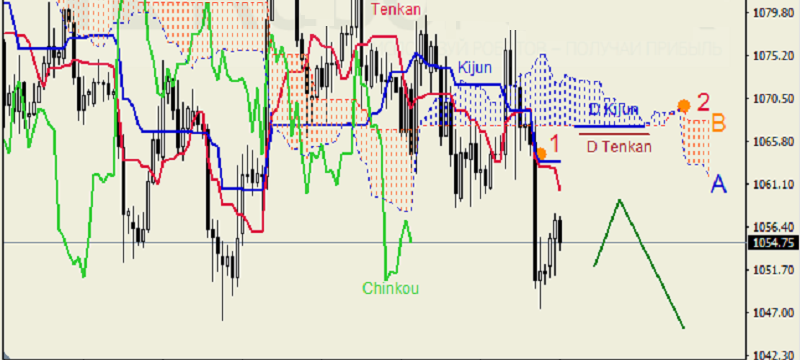
XAU USD, “Gold vs US Dollar” XAU USD, Time Frame H4. Indicator signals: Tenkan-Sen and Kijun-Sen intersected and formed “Dead Cross” (1); Tenkan-Sen and Senkou Span A are directed downwards...
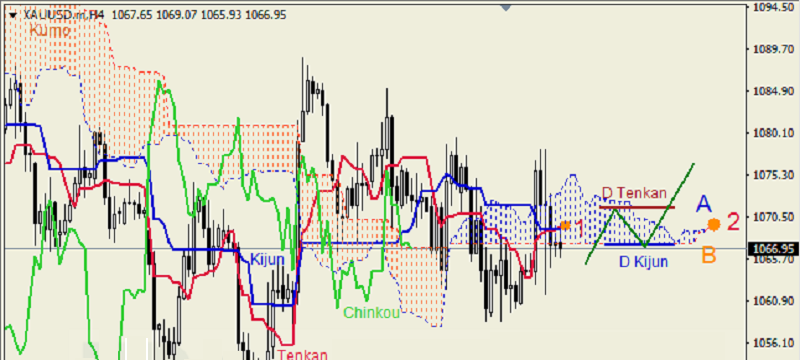
XAU USD, “Gold vs US Dollar” XAU USD, Time Frame H4. Indicator signals: Tenkan-Sen and Kijun-Sen ran into one another inside Kumo Cloud (1). Chinkou Lagging Span is below the chart; Ichimoku Cloud is closed (2...
RoboOption is announcing a pre-holiday week with special trading conditions! Every day (except for Saturday and Sunday) from December 16th to 23rd 2015, you have the opportunity to trade on your RoboOption accounts and receive incredibly high payouts for some particular assets of "Binary" type...