I'm an architect, I love the lines. I am passionate about financial trading, foreign exchange, investment projects, and especially studying the nature of the financial markets.
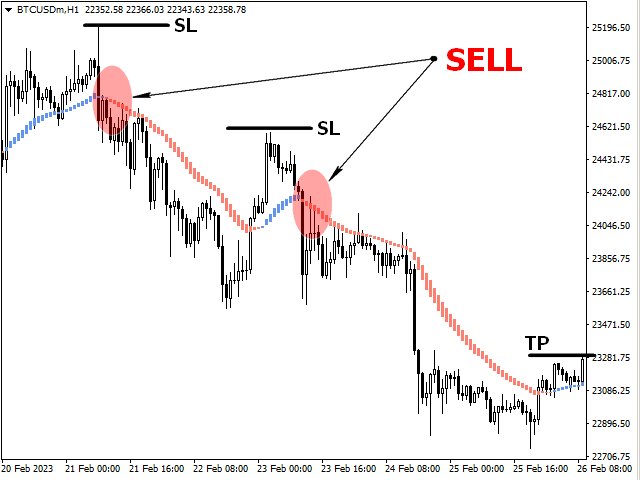
The Next MA Target for MT4 is an indicator that is built for the traders that work with the Meta Trader 4 charting platform during their trading day and it is built for a singular reason which is to help the Trader using it to predict the next price target on the current timeframe or currency pair that the trader attaches it to. This inidicator uses simple moving average (SMA) 20,50,100,200 to see the next target area it will touch so you know where its going... So if it break ma 20 next
Stochastic Filter Buy Sell Signals indicator identifies consecutive High candles and consecutive Low candles. The first candle must have an (x) pip long adjustable body for the first condition to be met, the candle must also be below or equal to the 20 stochastic level for consecutive High candles or above or equal to the 80 stochastic level for consecutive Low candles. You can set your own stochastic levels. If the above conditions are met, then the indicator looks at candle 2. Candle 2 must
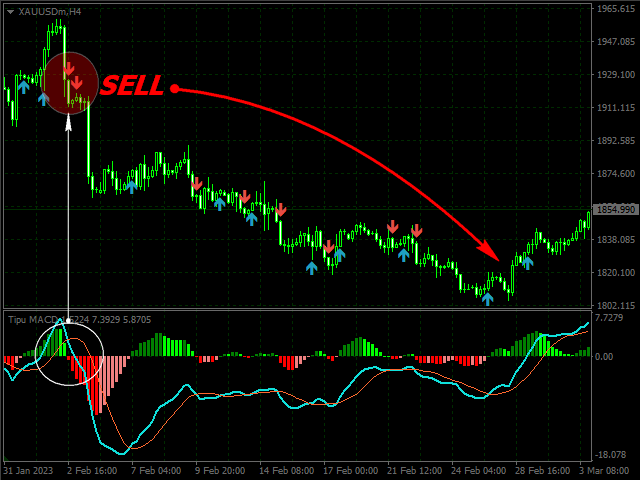
TipuMACD Generates Buy Sell Arrow Signals indicator MT4 is one the popular indicators in the market. It is based on the MACD Oscillator that was devised by Gerald Appel in late 1970s. MACD is a Momentum Oscillator that is calculated by subtracting the two price moving averages calculated on the price. It is one of the simplest indicators that provides best of both trend and momentum. As with all MACD indicators, the calculation is based on the main line and the signal line. The blue line in the
By means of RSI Table All Time Frames indicators, you can not switch the periods of the schedule in MetaTrader. As all the periods will be at you before eyes. ---------------------- The full RSI is Relative Strength Index – an important signal to increase the confidence of traders before deciding to enter an order. ( RSI ) is a momentum indicator that measures the magnitude of recent price changes to analyze overbought or oversold conditions. It is also scaled from
The ADX x Bollinger Waddah Attar Indicator For MT4 combines the Average Directional Index (ADX) and Bollinger Band width to create a simple trend strength indicator. Green bars signify that the current trend is bullish, while Red bars suggest bearish price action. The greater is an indicator bar, the stronger is the corresponding price trend. Key Points Finds the best buy/sell trends Beginner friendly indicator Can be combined with other tools Well worth adding to your indicator
The MACD and OsMA Indicator For MT4 combines the Moving Average Convergence Divergence (MACD) and the colored Moving Average of Oscillator (OsMA) indicators to create a unique trend following, momentum oscillator. When the OsMACD Indicator For MT4 rises above 0, the trend is deemed to have turned bullish. Contrarily, when indicator values drop below 0, the trend is assumed to have changed to down. 1/ Buy Aggressively Image (1) - when the market is in an oversold zone you
Daily lines of week indicator MT4 like period Separator each new day will gets its line at starting. Above this line you can read the text what day of the week is starting. The lines can be dotted, solid , dash .... and also the width can be chosen. The text is placed pixels you choose from pricemax. Everytime you change the chart the lines will correct themselves so the output keeps the same. Choosing the first day of the week different color makes you see easily weekly Separators also
https://www.mql5.com/en/market/product/94949 ▶ This indicator is one of the best trend following indicators. And it’s straightforward. You only need to look at the color of the indicator bars. When red, it signifies the trend is bearish, while the blue bar is in rising movement.
This indicator is a leader in trend following technical tools with a demonstration process akin to the moving average. It uses a 12-day smoothed moving average from closing prices data over a period. This is an effective trading solution used by both seasoned and new traders for scalping and intra-day trading. It is, therefore, suitable for 5 min, 15 min, 30 min, and 1 hour timeframes. The indicator reacts quickly to price changes and lags less than the conventional moving averages
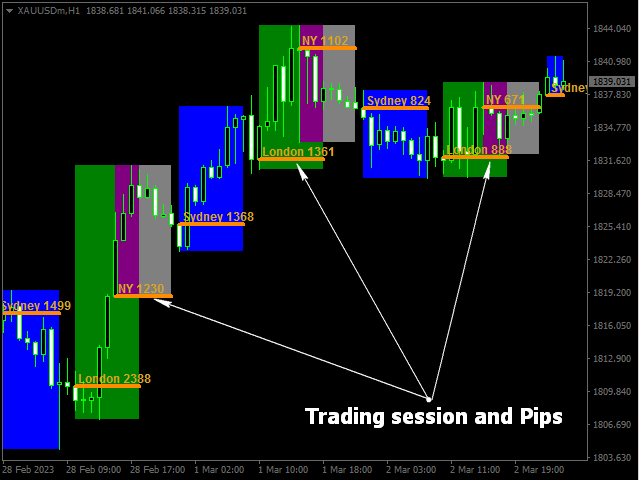
https://www.mql5.com/en/market/product/94943 ➤ Knowing the market's operating time, Forex trading hours in the local time zone, and active sessions will help traders proactively arrange their time and choose the best trading times of the day.
Knowing the market's operating time, Forex trading hours in the local time zone, and active sessions will help traders proactively arrange their time and choose the best trading times of the day. Forex is a 24-hour market, but generally, currency pairs are more active during the daytime of the countries they belong to. Take for example the AUD/NZD pair — this pair is particularly active in the Asian session while it is more "quiet" during the European and US sessions. Basically, all trading
Here are five forex books for beginners: "Currency Trading for Dummies" by Kathleen Brooks and Brian Dolan "The Little Book of Currency Trading" by Kathy Lien "Forex Trading: The Basics Explained in Simple Terms" by Jim Brown "The 10 Essentials of Forex Trading" by Jared Martinez "How to Make a L...
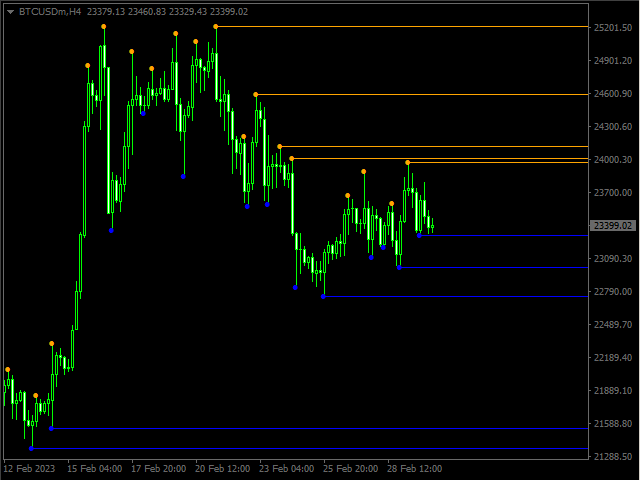
https://www.mql5.com/en/market/product/94917 ➤ What is special about this Support Resistance only Active indicator is that the highs and lows that were tested once will no longer show support and resistance lines, as they have been liquidated.
If you're a forex trader who uses Metatrader 5 as your trading platform, you may find the Arc Channel indicator helpful for drawing channels on your charts. With this indicator, you can easily draw an arc channel by yourself without having to rely on manual drawing or other tools. To use this indicator, follow these simple steps: Download and install the Arc Channel indicator on your Metatrader 5 platform. Open a chart and select the currency pair and time frame that you want to analyze. The Arc
Ehlers suggests usage as signals on zero line cross. This version instead adds floating levels and, implicitly, makes it an adaptive indicator. To reflect the additions, now you have a choice when to change colors of the indicator : change when the slope of RMO changes change when the RMO crosses outer floating levels (default) change when the RMO crosses the middle (dynamic "zero") level Usage: 1. Identify the main market trend: Buy only when the main trend is up, only sell short when the main
MACD double Histogram RSI Signal indicator for MetaTrader 5 is a calculation of the RSI based on the values of the MACD indicator . The resulting values are more smoothed than the MACD indicator values. The indicator can be used to detect the direction of the trend. The colors of the indicator (green and orange) help you spot the direction. Values are shifted by -50 in order to have additional cross over a such zero line. It would in original be value 50 of the RSI. It can help a
Creation of a trend line using linear regression is based on the least squares method. This method assumes that a straight line is created that pass through the price points so that the distance between the prices points to the line is as short as possible. In an attempt to predict tomorrow prices, it is logical to assume that they will be located close to the values of today's prices. If there is an uptrend, the best guess would be that the price value will be close to the