I'm an architect, I love the lines. I am passionate about financial trading, foreign exchange, investment projects, and especially studying the nature of the financial markets.
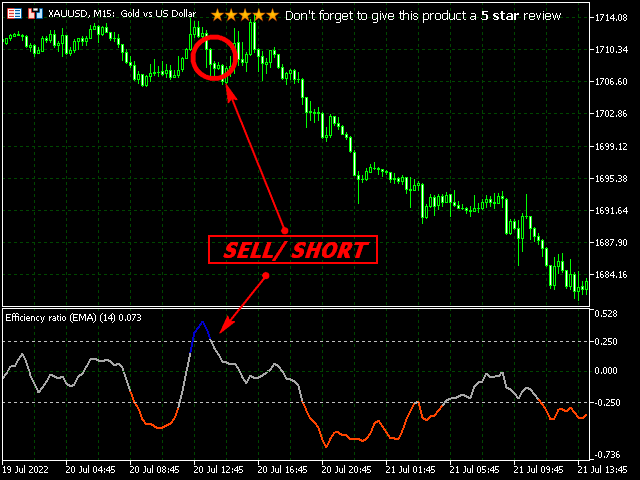
Don't miss out on the opportunity to revolutionize your trading strategy - purchase "Efficiency Ratio Trending" today or download free trial to experience the power of indicator for yourself! https://www.mql5.com/en/market/product/96113
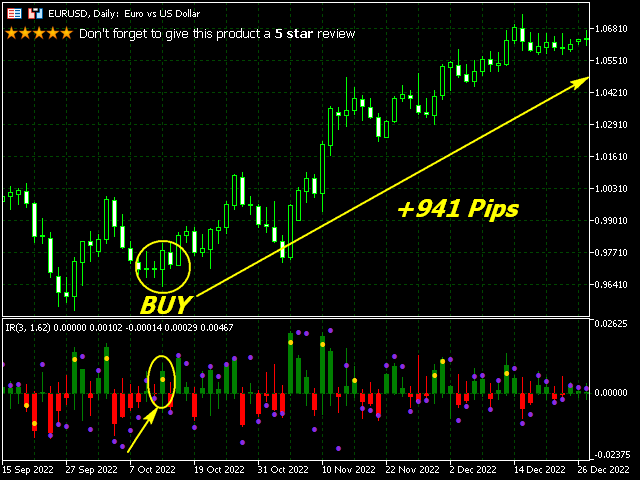
The original efficiency ratio is not showing the direction / trend of the price changes. This version is showing the direction and is adding a levels criteria to estimate if the market is trending or ranging. That way the indicator becomes a tool not only to show if the market is trending but to show the direction of the market as well. To help the estimation, smoothing option is added. With very mild smoothing, it is much easier to estimate the trend and a lot of false signals are
Don't miss out on the opportunity to improve your trading strategy and increase your profits with the powerful this indicator. Take the first step towards smarter trading decisions by download demo for a free trial today or purchasing the product now.
With its unique features, the "Stochastic ATR filling Signals" is a valuable addition to any trader's toolkit.
Don't wait any longer to take your trading to the next level - act now and start seeing results!
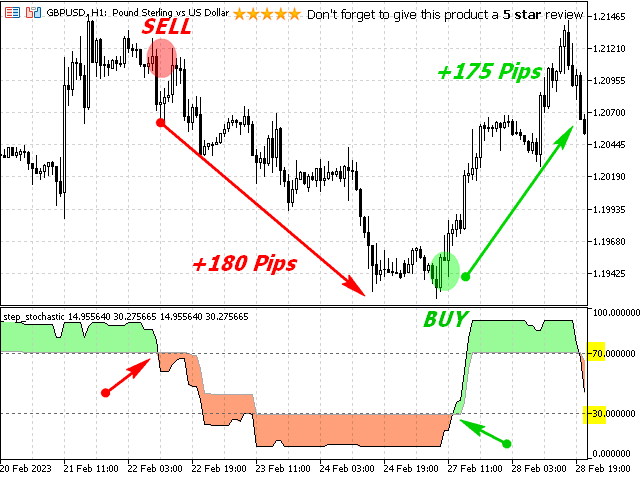
Maximize Your Profits with the Accurate Buy and Sell Signals of "Stochastic ATR filling Signals" Indicator "Stochastic ATR filling Signals" -- The indicator is a technical indicator used in forex trading to measure the momentum of price movements. The indicator consists of two lines that oscillate between 0 and 100 and indicate whether an asset is overbought or oversold. The "Stochastic ATR filling Signals" is calculated based on the closing price of an asset over a given period of time. The
"Revolutionize your trading with this oscillator! This cutting-edge indicator accurately predicts market trends and delivers clear signals to help you make confident trades. Backed by years of research and development, this is a must-have tool for any serious trader. Get your hands on it now and start seeing results!"... https://www.mql5.com/en/market/product/96004
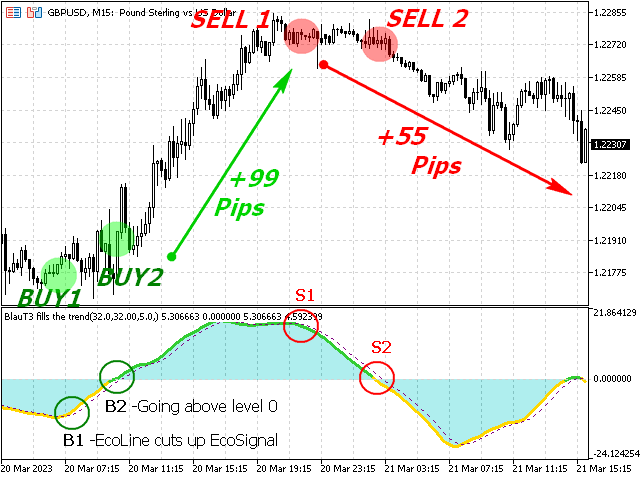
The indicator is called "Blau T3 fills the trend" and is used to display trends in currency pairs. The indicator uses the T3 moving average to calculate the difference between the close and open prices, as well as the difference between the high and low prices. It then divides the two values to create an oscillator, which is smoothed by another T3 moving average to create the final indicator. The indicator has three plots: "eco trend", "eco", and "eco signal". "Eco trend" is displayed as a
The Smooth Line Standard Deviation indicator is a powerful tool for traders looking to analyze market volatility. With its intuitive display, it provides a clear picture of market trends and helps identify potential trading opportunities. By smoothing out the standard deviation, it reduces noise and increases the accuracy of your analysis. Whether you're a beginner or an experienced trader, this indicator can help you make more informed trading decisions. Give it a try and see the difference for yourself!... https://www.mql5.com/en/market/product/95918
Smooth Line Standard Deviation - The indicator uses a smoothing algorithm to calculate a standard deviation for a selected price type. The standard deviation is then used to adapt the smoothing period, resulting in a smoother version of the price chart. The indicator also has the ability to color the chart based on the smoothed price movements, which can help traders to identify trends and potential trading opportunities. The indicator has the following input parameters: Calculation period
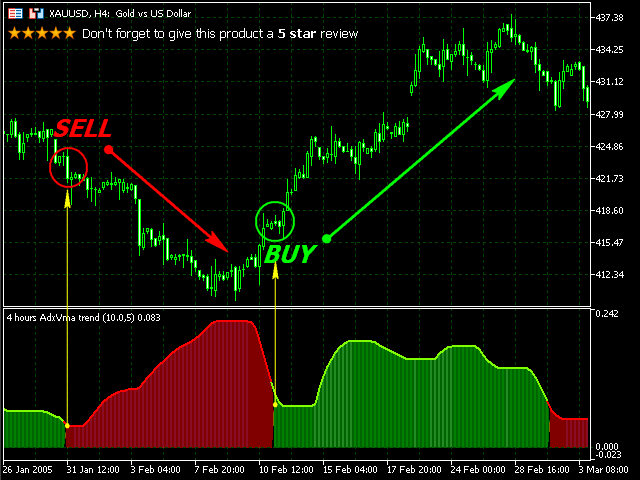
The indicator is called "ADX trend VMA" and it combines the Average Directional Movement Index (ADX) and the Volume-weighted Moving Average (VMA) to identify trends in the market... https://www.mql5.com/en/market/product/95910
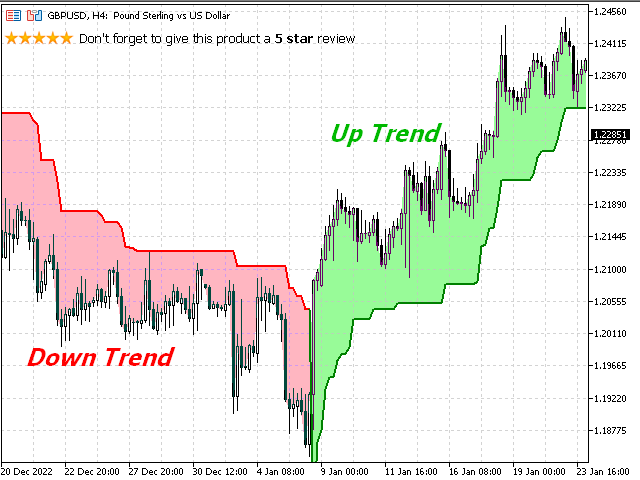
This is a MetaTrader 5 custom indicator called " Filling Trend ". The indicator draws two plots on the chart, a "Filling" plot and a "Trend" plot. 1/ The " Filling " plot is drawn using the DRAW_FILLING indicator type, which fills the space between two lines with a color gradient. In this case, the two lines are drawn using two buffers called "Filled_a" and "Filled_b". The color gradient is defined by the colors LightPink and PaleGreen. 2/ The " Trend " plot is drawn using the DRAW_COLOR_LINE
"The Dynamic Confidence Level" indicator is a tool designed to help traders identify potential price reversals based on an unusual impact in price changes. When the price-change exceeds the possible volatility limits, the indicator generates a signal, indicating that an inverse reaction may be imminent... https://www.mql5.com/en/market/product/95838
" The Dynamic Confidence Level " indicator is a tool designed to help traders identify potential price reversals based on an unusual impact in price changes. When the price-change exceeds the possible volatility limits, the indicator generates a signal, indicating that an inverse reaction may be imminent. The indicator's main feature is the Dynamic Confidence Level (DCL), which is calculated as the product of the Moving Average of Absolute Changes and a coefficient (Coef) that can be adjusted
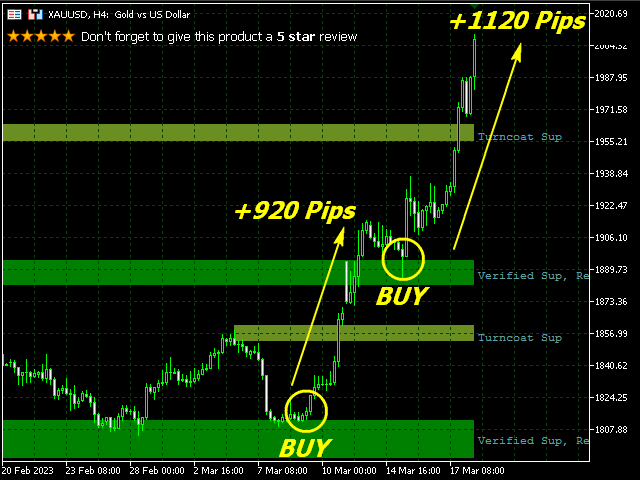
Supply and Demand zones are levels near which one could observe increased activity in the Forex market earlier. The levels are built on the basis of those zones of supply and demand, from which a sufficiently strong purposeful movement has already occurred... https://www.mql5.com/en/market/product/95761
For convenience, all figures on the chart have a short text description, so you will not have problems understanding what the highlighted level means... https://www.mql5.com/en/market/product/95761
The indicator code is a custom implementation of a Relative Strength Index (RSI) with dynamic support and resistance levels. The indicator consists of three plots: two lines representing the dynamic support and resistance levels, and a line representing the RSI value. The indicator takes three inputs: RsiPeriod: the period used for calculating the RSI value. RsiPrice: the price used for RSI calculation. The indicator can use different price types such as open, high, low, close, etc
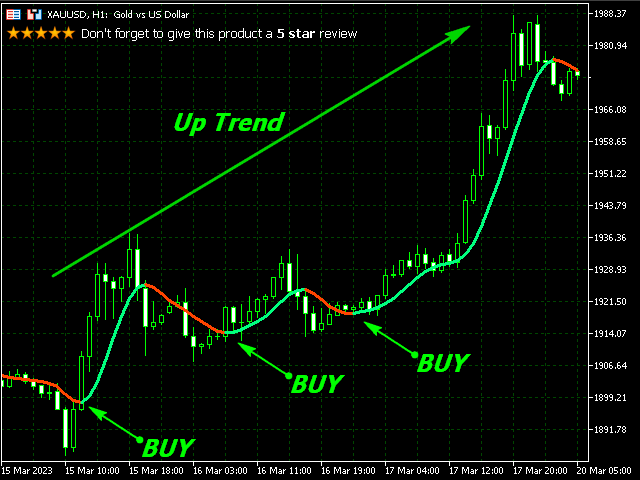
The indicator calculates and displays an Adaptive Laguerre Moving Average (ALMA) on a price chart. ALMA is a type of moving average that adjusts its smoothing factor based on market volatility... https://www.mql5.com/en/market/product/95750
Adaptive Laguerre MA Smoothing - The indicator calculates and displays an Adaptive Laguerre Moving Average (ALMA) on a price chart. ALMA is a type of moving average that adjusts its smoothing factor based on market volatility. The indicator also includes options to use different price types, such as open, high, low, and close, and to customize the calculation period, sigma, and sample. The indicator uses two indicator buffers to store the ALMA and color values. It is designed to be