ALFRED MURIITHI
- Product Testing 在 Innovicient Limited
- 肯尼亚
- 10498
|
12+ 年
经验
|
26
产品
|
216
演示版
|
|
0
工作
|
0
信号
|
0
订阅者
|
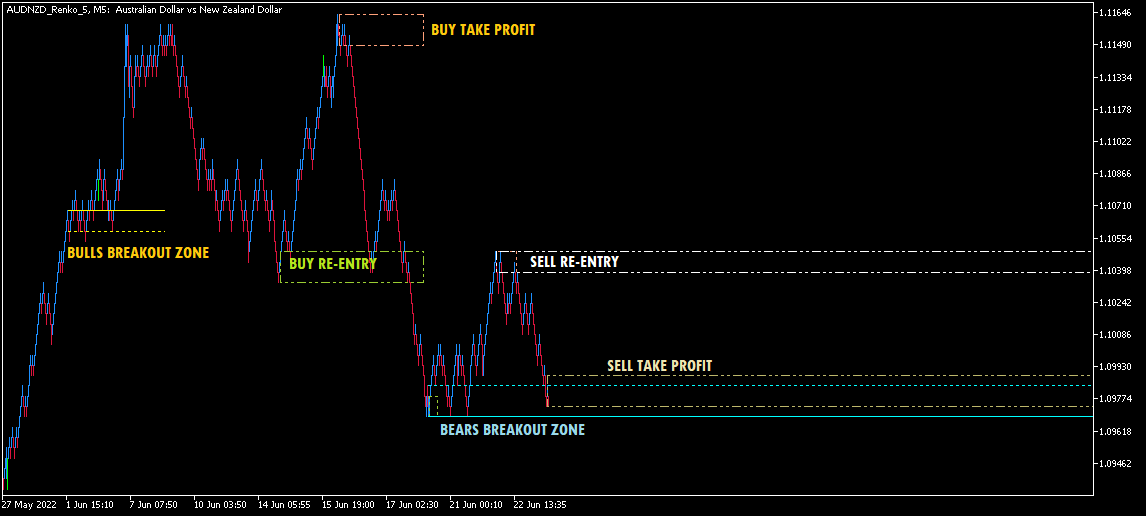
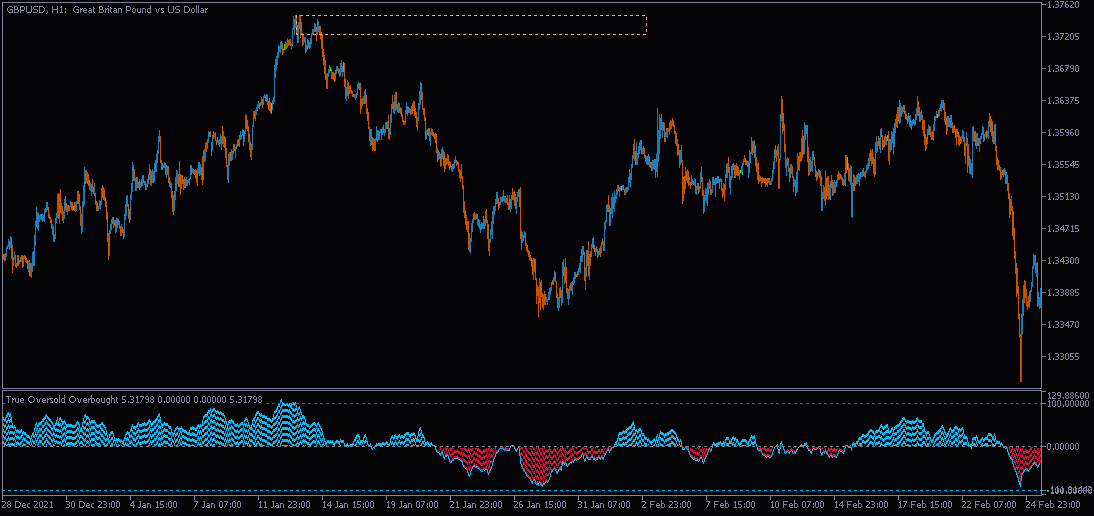
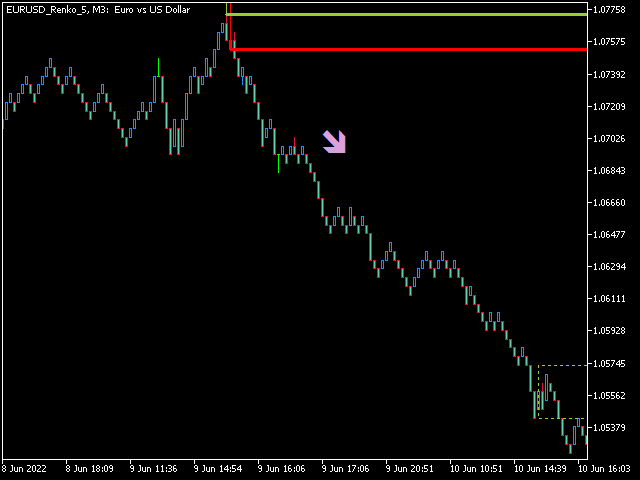
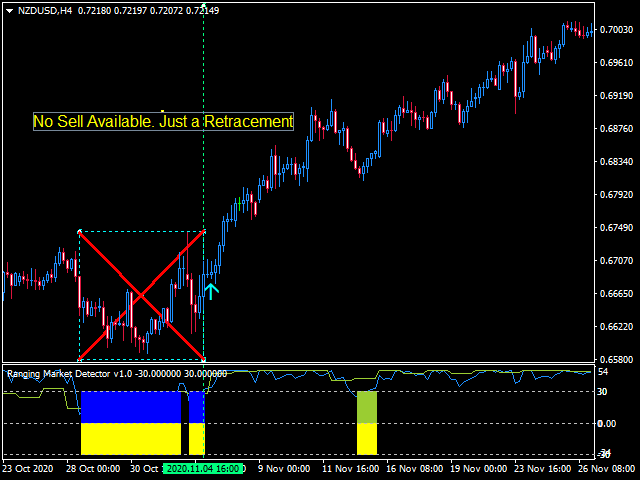
我是一名策略设计师和交易员。 凭借我们团队开发的一些优秀的工作工具,我们的客户能够以良好的可预测性交易任何工具。