类别中的新订单:
100 - 200 USD
60 - 75 USD
30 - 50 USD
30+ USD
30+ USD
50 - 400 USD
30+ USD
30 - 100 USD
工作已完成
执行时间1 一小时
客户反馈
Very good developer. Patient and very reactive.
Nice work
员工反馈
It was great working with you !
指定
Hello,
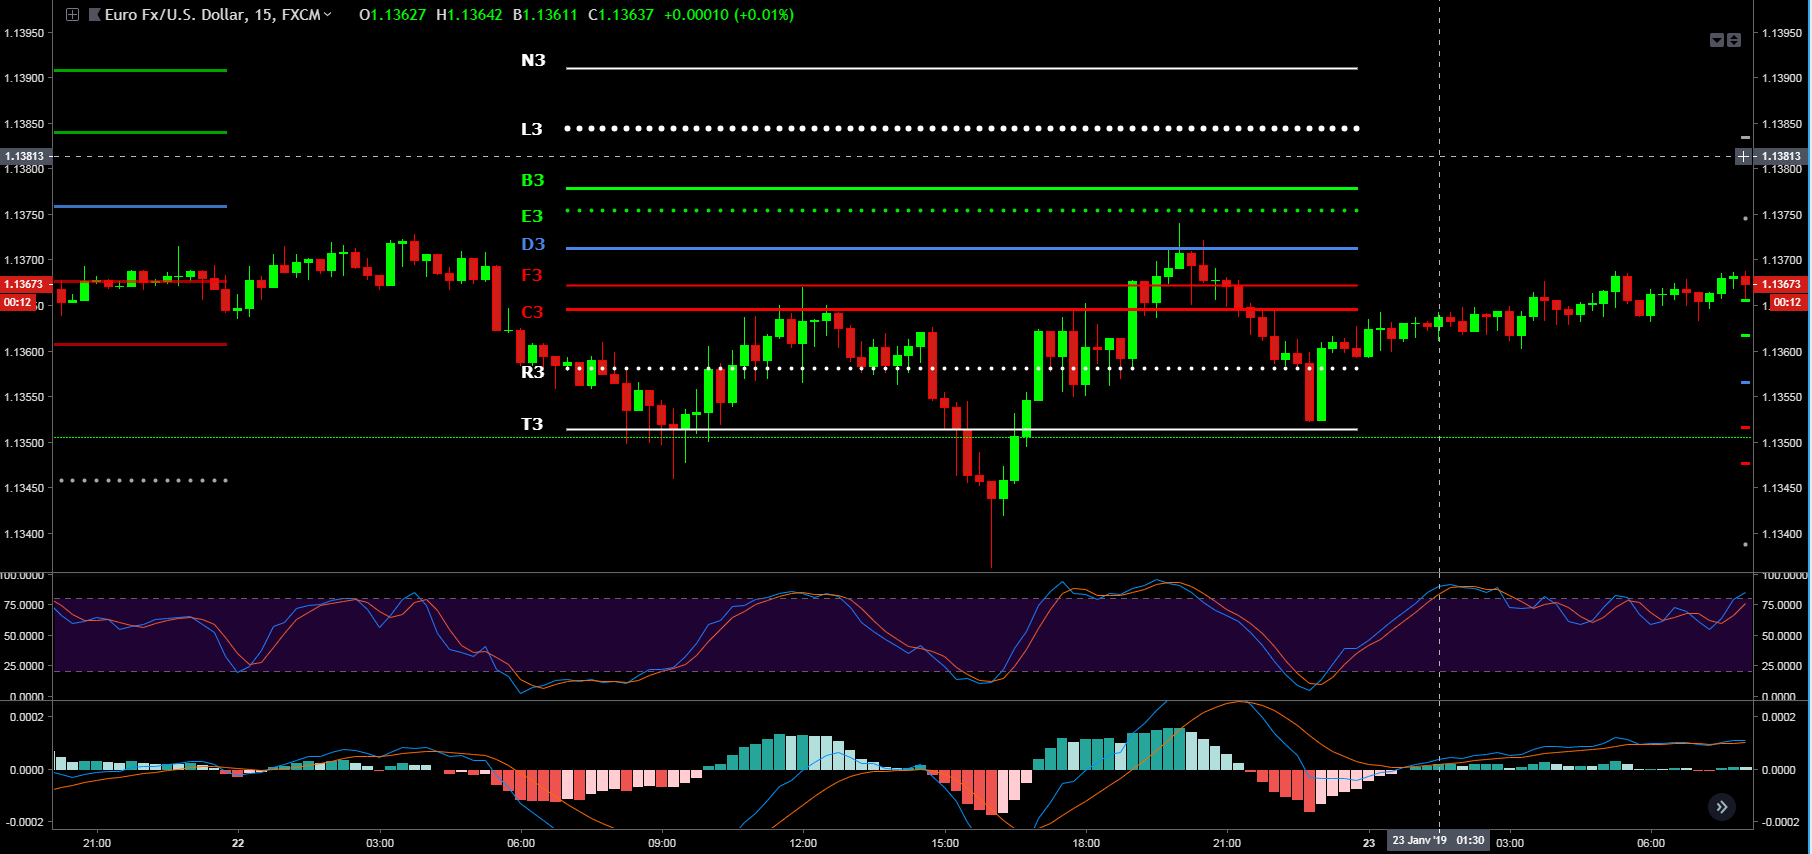
I would like to create an Indicator that with levels of Supports and Personals Resistances that I can send you by email on Excel file.
These levels must be plotted on daily from 1:00 to 23:00 (local time).
My goal is to draw daily the levels that are calculate on the Excel file (attached for example EURUSD), But I would like to be able to activate the indicator on all pairs with the same calculation mode.
All calculations of Supports / Resistances / Pivots are given in the file thanks to the previous day (Column W to AE)
Date, Open (Ask), High (Ask), Low (Ask), Close (Ask), Open (Bid), High (Bid), Low (Bid), Close (Bid).
I would also like if it is possible to receive an alert (notification + email ) as the level is touch.
For example:
column C has been touched with eg TP: Column P and SL column M
column D has been touched with eg TP: Column P and SL column S
In addition, is it possible to keep the history of levels plotted over several periods.
For example, instead of manually drawing lines, when I put lines of supports and resistances, it can trace automatically?
Thank you
反馈
1
等级
项目
232
30%
仲裁
1
100%
/
0%
逾期
9
4%
空闲
2
等级
项目
184
32%
仲裁
16
31%
/
63%
逾期
27
15%
空闲
3
等级
项目
25
4%
仲裁
0
逾期
5
20%
空闲
4
等级
项目
395
28%
仲裁
155
20%
/
52%
逾期
112
28%
空闲
5
等级
项目
8
13%
仲裁
0
逾期
1
13%
空闲
相似订单
Urgent: Need Expert Advisor Developer for 1-Day Project
100 - 300 USD
I am looking for an experienced expert to develop an Expert Advisor based on my idea. We can discuss the details in private messages. Please apply only if you are available now, as I need this project completed within one day
Project Description : I need an experienced programmer to convert the TradingView indicator "CURRENCY STRANGHT CHART by boitoki" into a MetaTrader 5 (MT5) format. The indicator should function identically to the original and be fully compatible for integration into an Expert Advisor (EA) on MT5. Requirements : Convert "TTD Middle Right Normal" from TradingView to a .mq5 file for MT5. Ensure all indicator features and
Project Description : I need an experienced programmer to convert the TradingView indicator "RSI BARS" into a MetaTrader 5 (MT5) format. The indicator should function identically to the original and be fully compatible for integration into an Expert Advisor (EA) on MT5. Requirements : Convert "TTD Middle Right Normal" from TradingView to a .mq5 file for MT5. Ensure all indicator features and visual signals are
Project Description : I need an experienced programmer to convert the TradingView indicator "TTD Middle Right Normal" into a MetaTrader 5 (MT5) format. The indicator should function identically to the original and be fully compatible for integration into an Expert Advisor (EA) on MT5. Requirements : Convert "TTD Middle Right Normal" from TradingView to a .mq5 file for MT5. Ensure all indicator features and visual
I want to create an indi to push notification when the candlestick chart forms 3 peaks or 3 bottoms forming a straight line: - 1,2,3 are 3 points in a straight line or NEARLY straight For example: Straight: NEARLY straight : means the peak/bottom of candle number 3 is NEAR the straight line connecting 1 and 2. Candle number 3 may or may not have crossed the straight line, as long as the peak/bottom of candle number 3
Hello! I am looking for an experienced Pine Script coder to create a custom indicator for mapping market structure based on fractals. The developer needs to know a lot about coding market structure indicators and be proficient in Pine Script. excited to collaborate with a gifted developer
I have list of free indicators in tradingview and i would like to convert them into an mt4 ea, But the EA will have and work based on the indicators features The list of the are listed as follows :> 1. Market Structure Break And Order block. By EmreKb 2. Rainbow Adaptive RSI by LuxAlgo 3. Multiple MA (21,50,100) 4. SuperTrend My budget for this 80$ max
Source code for indicator
30+ USD
good day i have an indicator but need the source for this reason The indicator only work on a single Time frame open trade, and close with only a single TF i will like the indicator work on multiple time frame just like other installed indicator My coder said the reason it cannot work like other indicator installed is because it has no buffer First confirm if you have the source code because its a popular indicator
Hello! I am looking for an experienced Pine Script coder to create a custom indicator for mapping market structure based on fractals. The developer must be skilled in Pine Script and have a solid understanding of how to code market structure indicators. Looking forward to working with a talented developer
Hello developers, I would like to hire someone can convert the Radar Signal indicator: https://www.youtube.com/watch?v=5DmKcy7rb-U  ; to it's TradingView equivalent. Radar signal indicator is the combination of 7 classic MT4 indicators. They include ADX, RSI , CCI , OsMA, ATR, WPR. The indicator shows the values of these indicators in blue and red. Red color indicates a bearish market condition and the blue shows
项目信息
预算
30+ USD
VAT (20%):
6
USD
总计:
36
USD
开发人员
27
USD