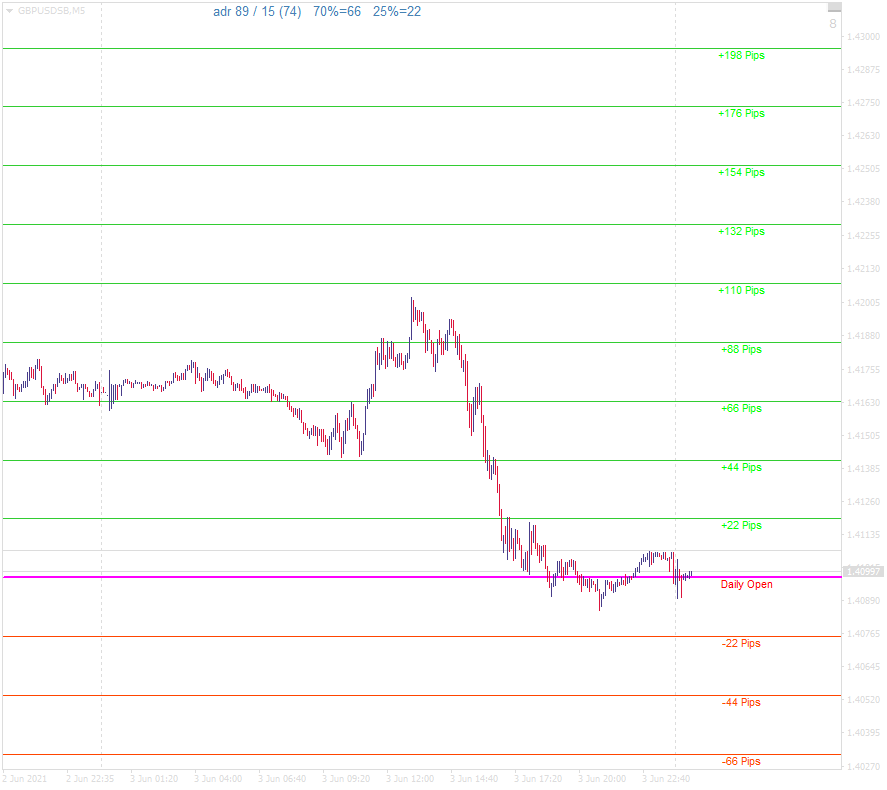
I'm looking for a single indicator that can plot daily open price line on a chart, with further (user input) number of levels based on adr (user input period) % (user input) on both sides of open. (Default to be daily gmt+2 / 30 day / 20% / 5 levels)
The indicator should work on mt4
The indicator should only draw horizontal lines for the beginning and end of each period (daily) and NOT connect them. With Toggle on and off option. (added "option to not have the current text with live offset, but end of session")
The indicator should allow a true/false input option to display the price for each level - at the end of the line for the level for current period
The indicator should allow a true/false input option to display the pip distance for each level - at the end of the line for the level for current period
The indicator should allow a true/false input option to display the level number (+1,+2,+3 / -1, -2, -3 etc) price for each level - at the end of the line for the level for current period
The indicator should contain a text data field containing adr range / current adr range / percentage used for grid (user input) 'G' / percentage current adr. As per picture with the addition of the current period percentage adr.
The indicator should allow a true/false input option to display (above) text data
Each line color, line type and thickness should be individually changeable
The indicator should contain level alert pop up / sound option
The indicator should contain font-type / font-size / font-color changing options (default to be Arial / SteelBlue / 10)
The Indicator should seamlessly work for all instruments, indices, forex, gold, stocks etc. (with different pip brokers)
The Indicator should automatically update on new day
The Indicator should include open day time shift to allow for broker new day/manual start ie london open/new york open to cater for user timezone
(possibly :- The Indicator should include for three timezones within one day option. Each timezone (start end), the indicator should only draw horizontal lines for the beginning and end of that period (session) and NOT connect them.) *understood that the same indicator can be used to cater for different time zones.
Removing the indicator from the chart should clean up/remove all lines and price labels from the chart.
Changing instrument should remove all previous 'Open Level' data and replace with the new instrument.
The indicator should include time restricted usage by user security
The developer will deliver the .mq4 file for the indicator
相似订单
Hi, I want to develop a highly accurate, custom technical indicator for MetaTrader 5 (MT5) specifically tailored for 1-minute Binary Options trading (Quotex). I do NOT need an automated trading bot. I only need visual buy/sell arrows on the chart, an advanced alert system, and an on-chart performance statistics dashboard. The indicator must be 100% non-repainting. --- 1. STRATEGY CONFLUENCE LOGIC The indicator should
Create a bot that can trade and read indicators easy to read for first time users. Bot that can be used on a phone and connect to MT5. It should be easy to install or use on any device especially phone and laptop, preferably the bot that can run over night and controllable when needed
These are orderflow footprint indicator I would like to know if you can algorithmisie and build a stacked imbalance bot from them .. Kindlt let me know if you can do it and check the file before replying me
I have 2 trading view indicators by GainzAlgo that I want code to mt5 , could u advise? I need you to give me response if you can convert This
I DO NOT need any programming or strategy development. I already have a working NinjaTrader 8 automated strategy based on a 3/5 EMA crossover. I need you to run my existing strategy through NinjaTrader Strategy Analyzer/Optimizer, test the existing adjustable parameters, and find robust settings with the best profit factor and lowest reasonable drawdown. I will provide the existing NinjaScript ZIP. I do not want the
Platform: TradingView Programming Language: Pine Script v6 Type: Custom Indicator Project Name: Scalping Reaction Zones + Valid Order Blocks MAIN GOAL I need a custom TradingView indicator for scalping. The indicator must detect: 1. Reaction / Explosion Zones 2. Valid Order Blocks 3. Combined Reaction Zone + Order Block zones The indicator should NOT generate: Buy signals Sell signals TP SL Entry signals Trading
Project Description I am looking for an experienced MQL5/MT5 Expert Advisor developer to develop an automated trading EA for XAUUSD on the M3 timeframe , running on an Exness account . The EA will automate a manual strategy based on SNR/GAP zones , using two setup types: Price Rejection Price Correction The EA should identify valid BUY/SELL setups around predefined SNR/GAP areas, apply configurable RSI, SMA, EMA and
Indicador Maximas e Minimas + Super Trend O Indicador MAX/MIN é um indicador de análise técnica para o MetaTrader 5 , desenvolvido para ajudar você a identificar regiões importantes de preço e possíveis oportunidades de compra e venda. O que ele faz MAX/MIN: identifica máximas e mínimas relevantes do mercado e mostra os preços no gráfico. HH / HL / LH / LL: ajuda a visualizar a estrutura do mercado, mostrando quando
Hello Traders, Have a trading strategy or idea you want to automate? I specialize exclusively in MQL5 development, helping traders turn their concepts into professional trading solutions. Custom Expert Advisors — automate your strategy and reduce manual execution Custom Indicators — transform your market ideas into powerful trading tools Fix & Debug — identify errors and get your existing code working properly
I DO NOT need any programming or strategy development. I already have a working NinjaTrader 8 automated strategy based on a 3/5 EMA crossover. I need you to run my existing strategy through NinjaTrader Strategy Analyzer/Optimizer, test the existing adjustable parameters, and find robust settings with the best profit factor and lowest reasonable drawdown. I will provide the existing NinjaScript ZIP. I do not want the
 全部订单
全部订单
 规则
规则