What is the "Head and Shoulders" chart pattern?
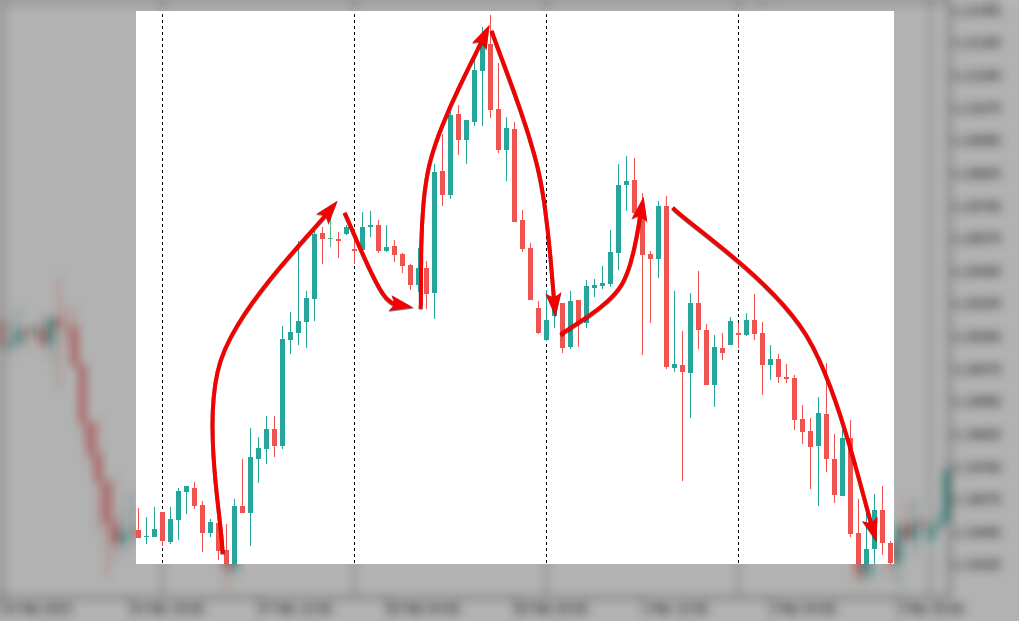
The Head and Shoulders pattern is one of the most reliable figures in technical analysis, signaling a reversal of an uptrend into a downtrend. Visually, it consists of three consecutive peaks: the left shoulder (a moderate high), a higher head (the trend's peak), and the right shoulder (which forms around the level of the left shoulder without exceeding the head). The key element here is the "neckline" (a support line drawn through the lows of the troughs between the peaks). A price break below this line is considered the official signal to open short positions (sell), as the bulls have lost control and the market is poised for a decline.
There is also the "Inverse Head and Shoulders" pattern, which works in the opposite manner and预示s a reversal of a downtrend into an uptrend. In this case, the figure forms at the market bottom, and a breakout above the neckline provides a powerful buy signal. Traders often measure the height of the "head" to project that distance from the breakout point—this is how they calculate the potential price target. The main safety rule is to wait for the actual breakout and confirmation of the price beyond the neckline, as false moves before the completion of the second shoulder are common.
#technicalanalysis #patterns #trading
Subscribe!
Even more content in the author's profile: https://www.mql5.com/en/users/voldemar
Что такое графический паттерн «Голова и плечи»?
Графический паттерн «Голова и плечи» (Head and Shoulders) — это одна из самых надежных фигур технического анализа, которая сигнализирует о развороте восходящего тренда на нисходящий. Визуально он состоит из трех последовательных пиков: левого плеча (умеренный максимум), более высокой головы (вершина тренда) и правого плеча (формируется на уровне левого плеча, не пробивая голову). Ключевым элементом здесь выступает линия «шеи» (линия поддержки, проведенная через минимумы впадин между пиками). Пробой этой линии ценой вниз считается официальным сигналом к открытию коротких позиций (продаже), так как быки потеряли контроль, и рынок готов к падению.
Существует и «перевернутая голова и плечи» (Inverse Head and Shoulders), которая работает зеркально и предвещает смену нисходящего тренда на восходящий. В этом случае фигура формируется на дне рынка, а пробой линии шеи вверх дает мощный сигнал на покупку. Трейдеры часто измеряют высоту «головы», чтобы спроецировать это расстояние от точки пробоя — так они рассчитывают потенциальную цель движения. Главное правило безопасности: дожидаться именно пробоя и закрепления цены за линией шеи, так как ложные движения до формирования второго плеча — частое явление.
#техническийанализ #паттерны #трейдинг
Подписывайся!