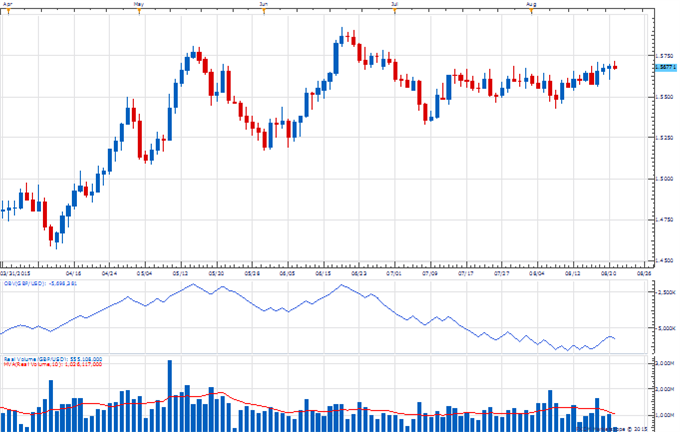
GBP/USD Technical Analysis: Cable Carving Out a Higher-Low
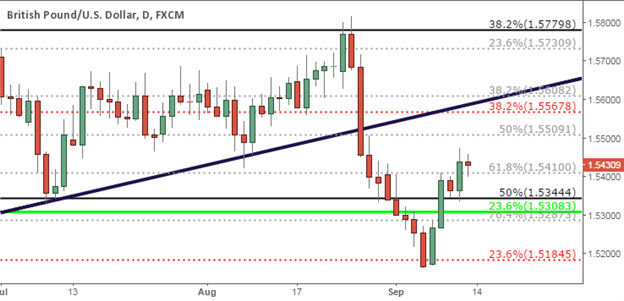
Talking Points: GBP/USD Technical Strategy: Flat GBP/USD working on a higher-low after throttling higher throughout the week. Fibonacci support combined with a higher-low highlights a potential long position should the market retain support on Monday. British Pound strength put in a strong week of price action against the US Dollar, and with additional potential weakness in the Greenback the Sterling could become one of the more attractive currencies in the world to be long of. After a strong bounce of off the 23.6% retracement (of the July 2014-April 2015 move) to end last week, the Cable gapped higher and never filled as prices continued moving in the top-side direction. Multiple resistance levels yielded to a surging British Pound and the 1.5410 level became particularly interesting. This is the 61.8% retracement of the most recent major move (four-month-low to four-month-high – indicated by gray-dashed lines on the chart). This level put in resistance on Tuesday, only to be broken after the Bank of England rate announcement, and has now become new support.
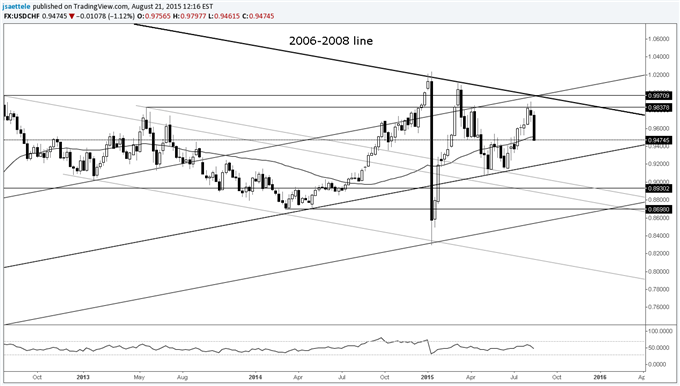
USD/CHF Technical Analysis: Franc Forges Ahead, But Short Setup Not Yet Ready
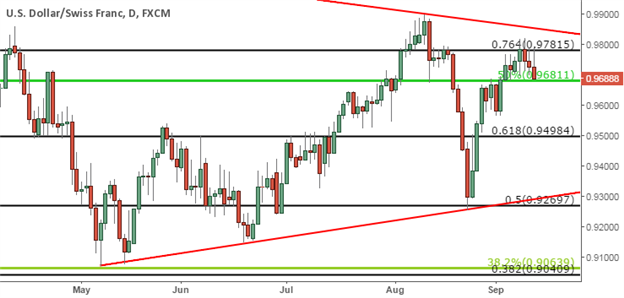
Talking Points: USD/CHF Technical Strategy: Pending Short USD/CHF respected the higher-low carved out earlier in the week, but lack of sellers to drive the pair below support leaves the short setup un-triggered. Breaks below .9681 could open the door for short positions. The Swiss Franc has continued to respect the lower-high discussed in yesterday’s piece, with resistance coming in over the past four trading days at .9781, which is the 76.4% Fibonacci retracement of the 2015 high/low. Each of the last four days has seen a daily wick intersecting with this level, but sellers have come in aggressively to sell this rip, thereby confirming the lower-high that’s been seen in the USD/CHF pair. The 50% Fibonacci retracement of the ‘big picture’ move (shown in green on the below chart) is providing current support at .9681, and this is the level that could prove attractive should price action find the momentum to break through. This level had also provided resistance two weeks ago as the USD/CHF was trading higher, and if this support yields traders can look for the opposite effect before entering the position. Let price break support, and then wait for resistance to show in the .9681 zone before triggering the short position. This could allow an attractive risk-reward ratio with stops above the recent lower-high, and targets cast towards .9500 and then .9270.
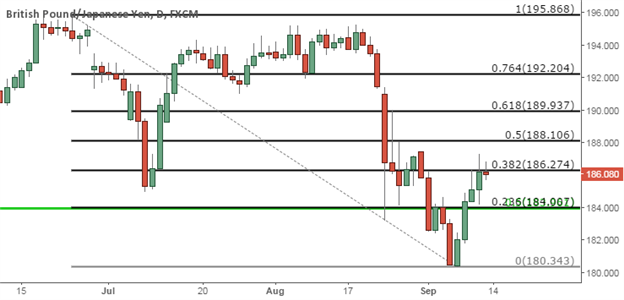
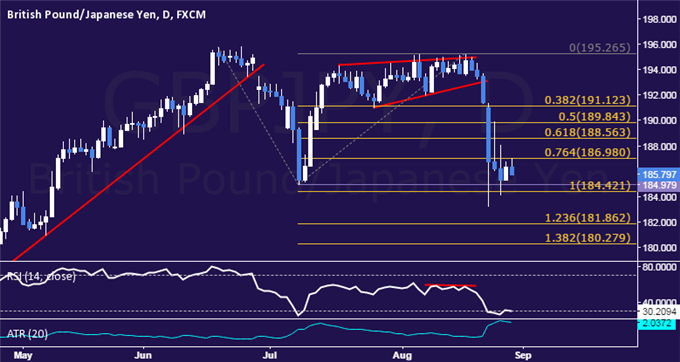
Talking Points: GBP/JPY Technical Strategy: Pending Short British Pound Strength throughout the week offers a threat to the short-thesis in GBP/JPY. The Spinning Top formation on Friday highlights indecision, and could serve as a prelude for a short-entry early next week. A strong week of trading has seen the British Pound strengthen against the Japanese Yen by over 550 pips as risk aversion yielded ahead of a pivotal FOMC decision next Thursday. This puts GBP/JPY in the uncomfortable position of offering a short-term bullish posture with an intermediate-term bearish posture; which will likely be decided by Central Banks from both economies as the Bank of England looks at a rate hike early next year, while markets have begun pricing in the potential for another round of Quantitative Easing from the Bank of Japan.
EUR/JPY Technical Analysis: Euro Strength, Yen Weakness Continues
Talking Points: EUR/JPY Technical Strategy: Flat, Pending Short Setup Canceled EUR/JPY surges above resistance as risk aversion yields Five consecutive daily gains behoove patience for the short setup until more clear resistance comes in. In yesterday’s piece, we identified a potential short setup in EUR/JPY, citing potential resistance at the 136.40 area, which is the 61.8% Fibonacci retracement of the most recent major move (August high to the September low). Price action on Friday continued to trade higher in EUR/JPY, offering intra-day resistance at this key level, only to break later in the session. At this point, that potential level of resistance appears as though it may become new intra-day support, thereby invalidating yesterday’s pending short setup. However, prospects for a short position in the pair are not completely foregone, as resistance on a projected trend-line that had previously offered support (outlined in blue on the chart) could prove an attractive entry prospect should this EUR/JPY strength continue. Other potential levels of resistance are 137.39 (76.4% of the most recent major move), and 137.93 (the 50% Fib retracement of the ‘intermediate term’ move). On the other hand, breaks above 139 could prove attractive on the long side, and this could invalidate the short stance altogether and cast eyes towards a future long position.
USD/CAD Technical Analysis: Dip To 34-DMA Favors Long Risk: Reward
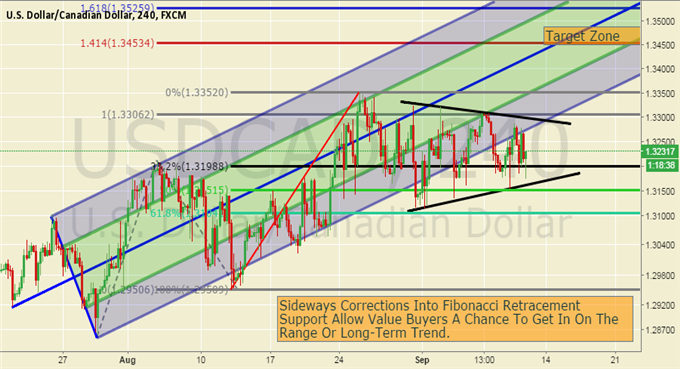
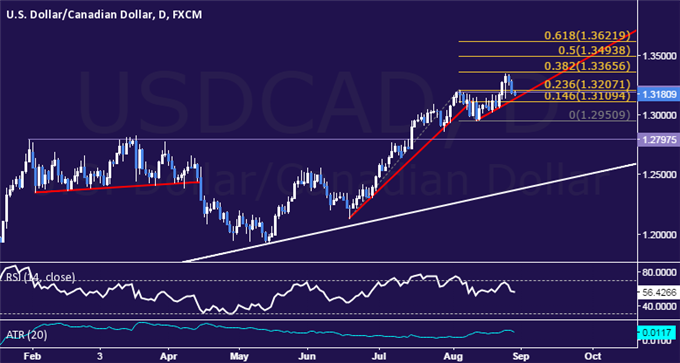
Talking Points: -USD/CAD Technical Strategy: Favorable Risk: Reward To Establish Long -Time Based Correction Means Sideway Chop Could Continue -Long Bias Invalidated on Break and Daily Close below 1.3115 (Less than 100 pips) The Canadian Dollar has been unable to catch a bid as the highly correlated Oil market fails to break resistance both pushing USDCAD higher longer-term. As USDOLLAR momentum has also slowed after a recent surge, USDCAD has moved sideways and overlapped prior price action. However, the 34 day moving average around 1.3145, has held as support and a continuation of this support favors a push higher towards Fibonacci Expansion targets of 1.3453/1.3525.
USD/CAD Technical Analysis: Begrudgingly Holding Long
Talking Points: USD/CAD Technical Strategy: Long at 1.3247 US Dollar Back on the Defensive as Prices Recoil from Resistance Long Position Begrudgingly Left Open, Awaiting Further Clarity The US Dollar turned lower against its Canadian namesake after prices found resistance above the 1.33 figure. The move lower narrowly breached the 23.6% Fibonacci expansion at 1.3207, meeting the condition we set out for triggering the stop-loss on our long trade from 1.3247. However, after much consideration, we will opt to keep the trade in play and revise its parameters.
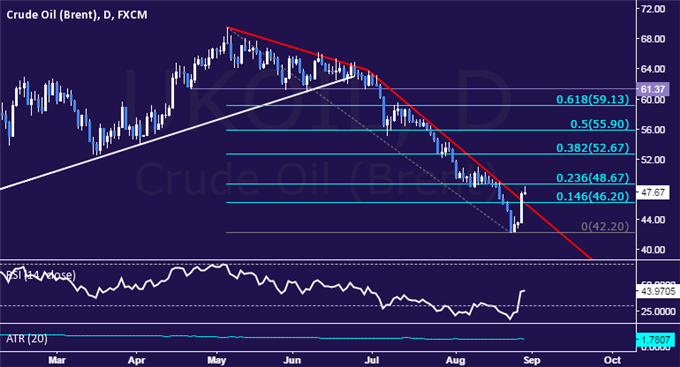
Talking Points: Crude Oil Gains Most in Six Years, Breaks 2-Month Down Trend Upside Correction May Be Sizable But Trend Still Firmly Bearish Crude oil prices launched a sharp recovery having found support above the $42/barrel figure, producing their largest daily advance in over six years. The move overturned a two-month down trend, opening the door for the possibility of a larger recovery in the cards ahead.
GBP/JPY Technical Analysis: 3-Year Uptrend in the Balance
Talking Points: GBP/JPY Technical Strategy: Flat Pound Digesting Losses After Hitting Four-Month Low vs. Yen Near-Term Support Break May Mark End of Multi-Year Uptrend
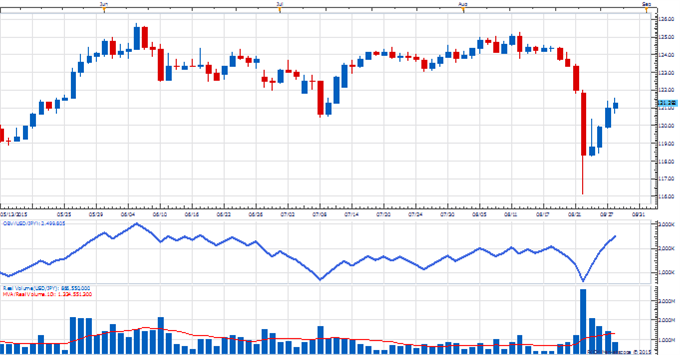
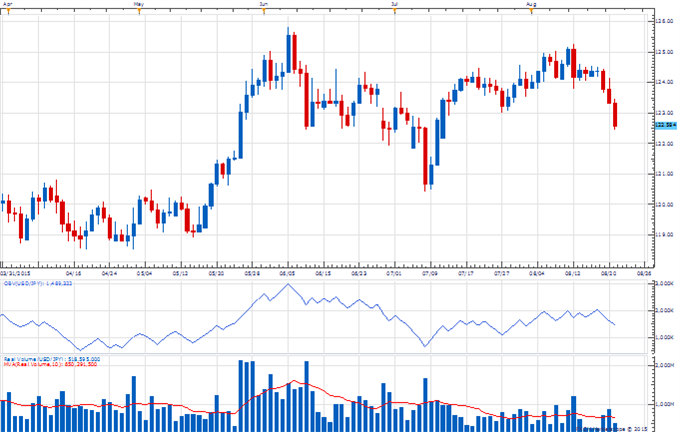
USD/JPY fell to its lowest level more than 7-months this past week before recovering the bulk of the week’s losses The increase in volume on the spike lower and recover warns that capitulation low of some kind was traced out Unlike in the euro, USD/JPY did not record an OBV divergence against its most recent low which is a potential negative However, a close above 123.00 on above average volume is needed to confirm a more important shift higher in the exchange rate
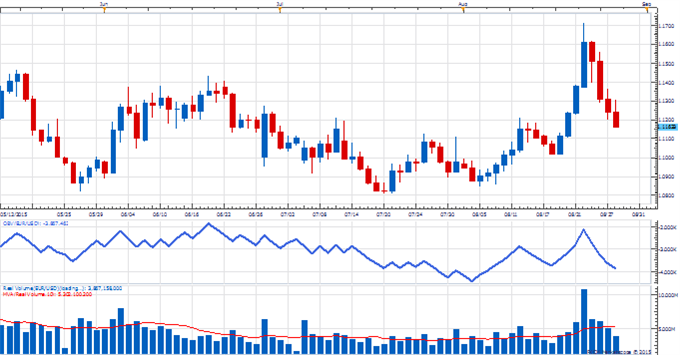
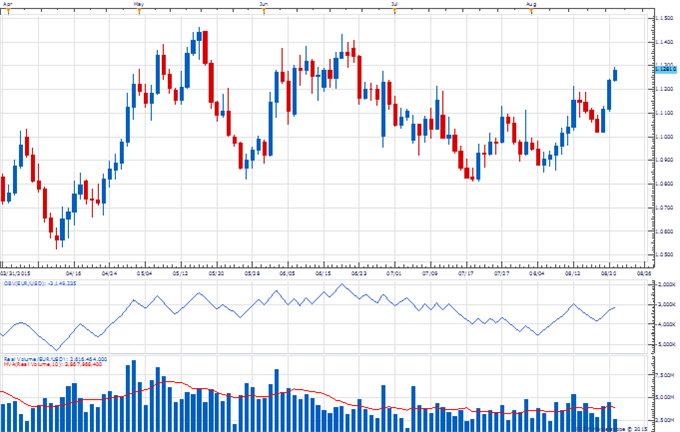
EUR/USD underwent extreme volatility this past week as spot traded in a five big figure plus range A sharp spike in volume on the move to 1.1700 warns of a potential upside capitulation The divergence in daily OBV on the spike higher relative to the May high is also negative A close below 1.1000 on above average volume is needed
Traders tend to love analog charts. A potential roadmap to near-term price action is an elixir just too powerful for most to pass up (myself included). I don’t have any hard evidence, but I would be willing to bet the popularity of technical analogs spikes up anytime the PBS documentary of Paul Tudor Jones from the 1980’s gets illegally downloaded to YouTube. Traders generally also tend to have short memories and focus primarily on the recent past. The volatility this past week in equities seems to have a lot of people making comparisons with the decline and rebound from last October. There has been more than a fair share of “V bottoms” over the past few years so I wouldn’t completely dismiss it. I just think it is a lower probability.
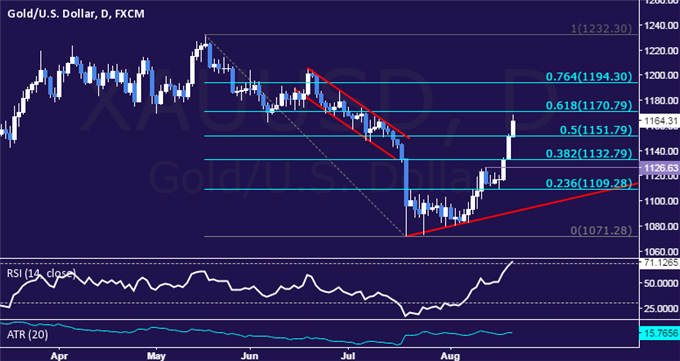
Gold Technical Analysis: Prices Reach Seven-Week High
Talking Points: Support: 1126.63, 1109.28, 1090.10 Resistance: 1151.79, 1170.79, 1194.30 For more analysis, visit our gold page Gold prices continue to push higher having found fuel following the publication of July’s FOMC meeting minutes. A daily close above the 50% Fibonacci retracement1151.79 exposes the 61.8% level at 1170.79. Alternatively, a turn below the 1126.63-32.79 area (August 13 high, 38.2% Fib) clears the way for a test of the 23.6% retracement at 1109.28.
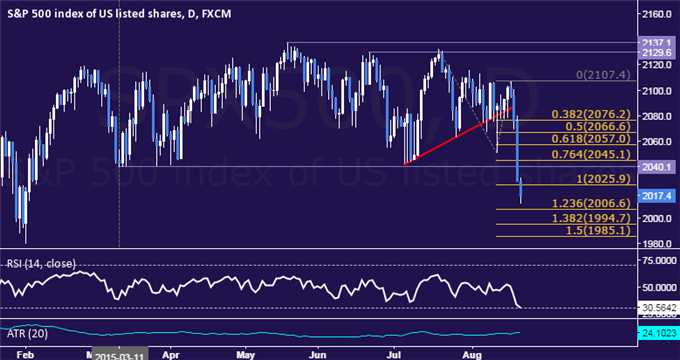
SPX 500 Technical Analysis: 5-Month Range Floor Broken
Talking Points: Support: 2025.90, 2006.60, 1994.70 Resistance: 2045.10, 2057.00, 2066.60 For more, visit our SPX 500 page The SPX 500 moved sharply lower, issuing the largest drop since February 2014 and taking out support capping losses since early March. A daily close below the 100% Fibonacci expansion at 2025.90 exposes the 123.6% level at 2006.60. Alternatively, a turn above the 2040.10-45.10 area (range bottom, 76.4% Fib) opens the door for a test of the 61.8% expansion at 2057.00.
USD/CAD continues to chop around in a sideways to lower range below the 1.3212 multi-year high recorded earlier in the month. Following the breakout in July above the 2009 high the medium-to long-term technical outlook is clearly favorable with a move through Fibonacci resistance at 1.3170 and of course the high at 1.3212 needed to set off a run higher towards the 61.8% retracement of the 2002 – 2007 decline near 1.3500. The current correction from the high has been relatively tame thus far given some of the other moves in G10 FX. Of course a lot of this has to do with the relentless offer in crude, though with sentiment in the commodity falling to contrarian “red flag” levels of just 6% bulls yesterday the time may be approaching for at least a modest turn around in oil and CAD. The low end of a median line channel drawn from the May low has supported downside attempts thus far, but is getting tested again today. A daily close below this level (currently around 1.3080) would be an early warning sign that the correction is starting to gain some traction. However, a clear break of last week’s low near 1.2950 is probably needed to turn the near-term technical picture more convincingly negative.
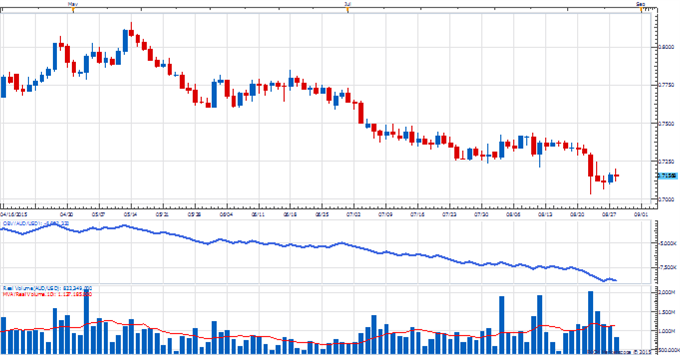
The Weekly Volume Report: Big Spot Moves But Volume Unimpressive
USD/JPY fell to its lowest levels in over a month this week Volume, however, remains very low and unsupportive of the decline The downtick in daily OBV is negative, but a break under the late July low is needed to excite about potential further downside A close back over 124.30 on above average volume would turn us positive on the pair
The Weekly Volume Report: Big Spot Moves But Volume Unimpressive
EUR/USD continued higher this week to trade at its highest level in almost two months Volume has failed to pick up materially on the latest advance which is a warning sign that the recovery may only be corrective The failure in daily OBV to get above last week’s high is also concerning However, A close below 1.1000 on above average volume is needed to turn the outlook negative again on the euro
EURUSD Trades to 200 Day Average for First Time in 13 Months
-“A 10 month trendline has supported USDCAD on recent dips. The development indicates potential for resumption of the broader bull move.” -“USDCAD has broken out. 11 year highs aren’t far off. The 2009 high is at 1.3062 (just below the 127.2% extension of the March-May range, which is at 1.3083).” 11 year highs have been reached. The next measured level is the 161.8% extension of the March-May range at 1.3399. The March high at 1.2834 is now support. Weakness below there would delay the immediate bullish picture until probably near 1.2700.