T Position Size Calculator
- 유틸리티
- Thyda Saing
- 버전: 1.1
- 업데이트됨: 7 12월 2023
- 활성화: 5
Demo version
T Position Size Calculator doesn't work in the strategy tester. The Strategy Tester does not support the processing of ChartEvent. It does not support most of the panel's functionality.
Contact me for any questions or ideas for improvement or in case of a bug found.
Control and manage your trading like a professional trader with T Position Size Calculator.
T Position Size Calculator – an MT5 Expert Adviser, is a user-friendly custom tools (Dialog Panel and Three Lines, Order Line, Stop Line, Profit Line) on the chart. It allows you to determine your required trading.
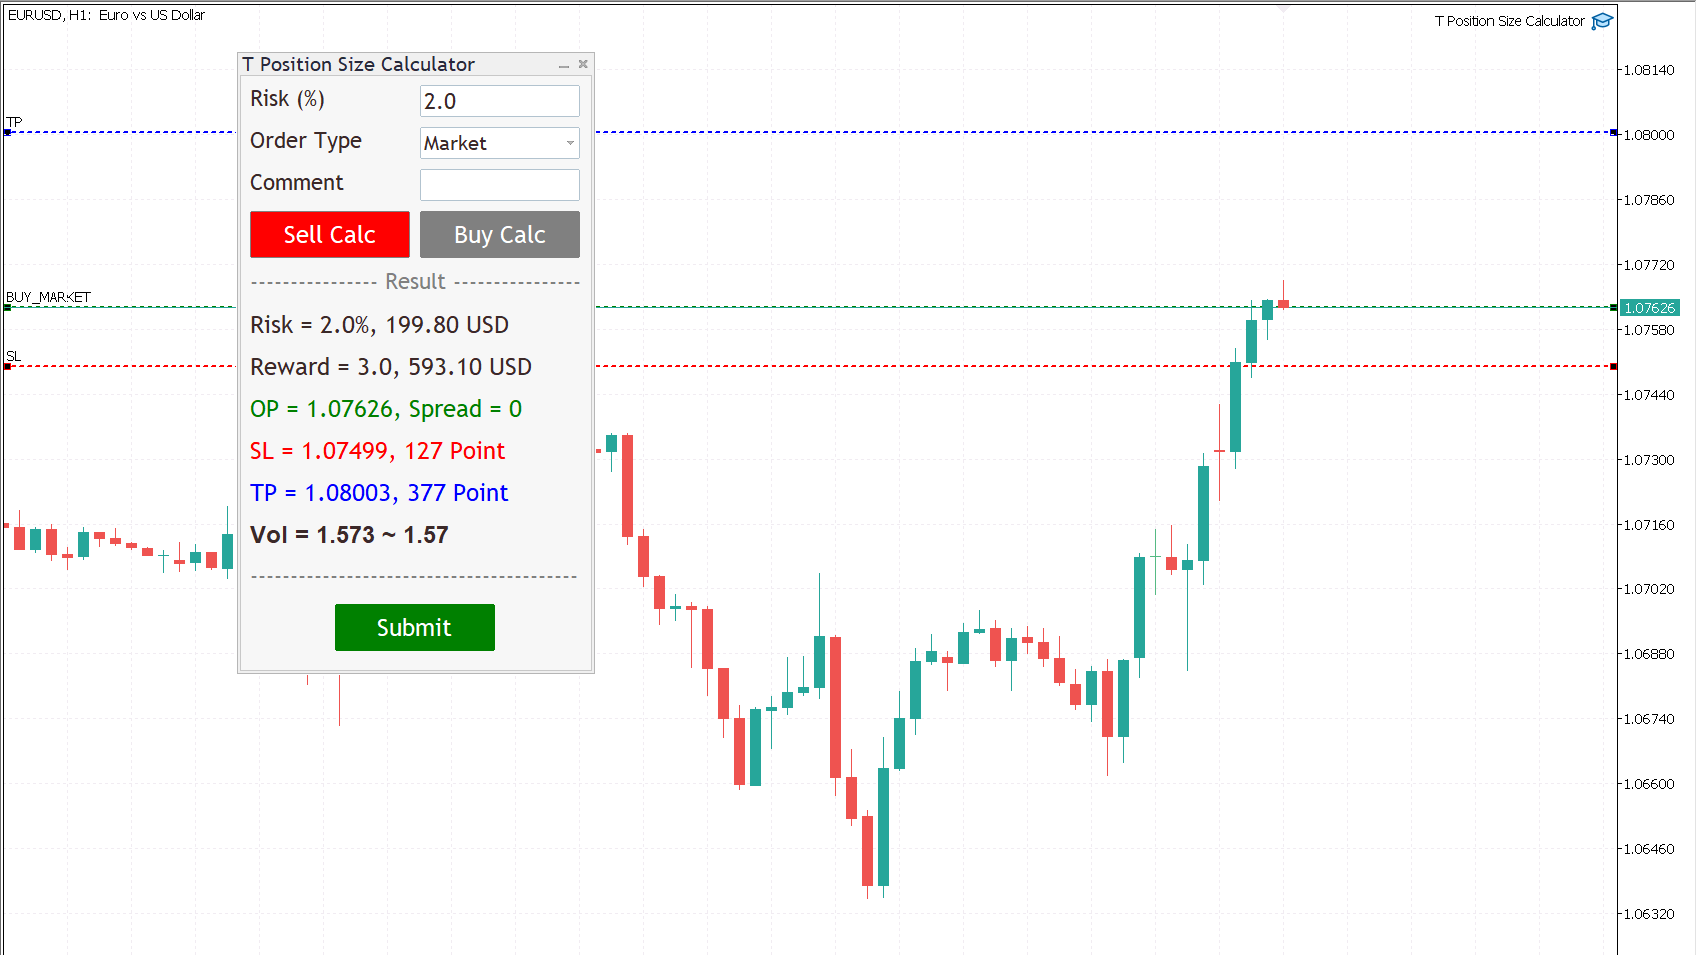
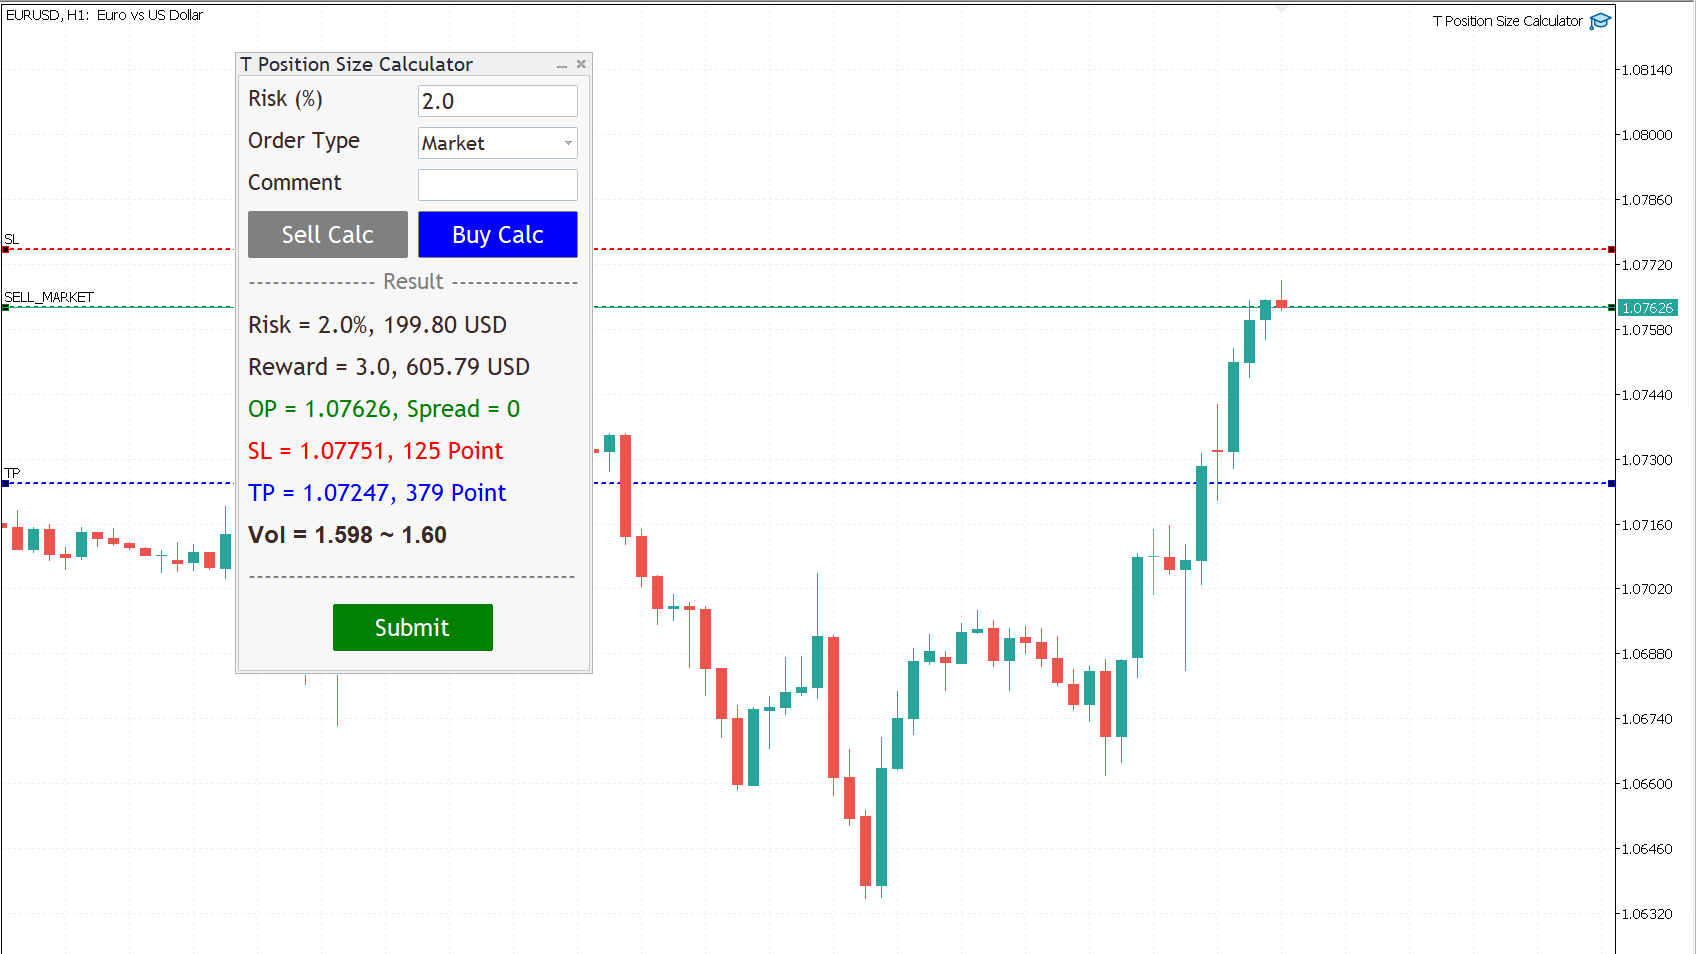
By using T Position Size Calculator you can automatically calculate position size instantly by click on Sell Calc or Buy Calc button then you can drag and drop the lines at your levels for each trading.
You can trade without worrying about calculating incorrectly.
Expands the standard terminal capabilities with this utility.
T Position Size Calculator works on any trading instruments: forex, stocks, indices, cryptocurrency, CFD, Spread Betting and more.
HOW DOES IT WORK?
We need to check two box for working with T Position Size Calculator
-
Go to menu MT5, Tool => Options => Check on box, Allow algorithmic trading.
-
Check on the box, Allow algo trading, when attach T Position Size Calculator with Chart.
Follow a few steps in Dialog Panel to submit order to market :
-
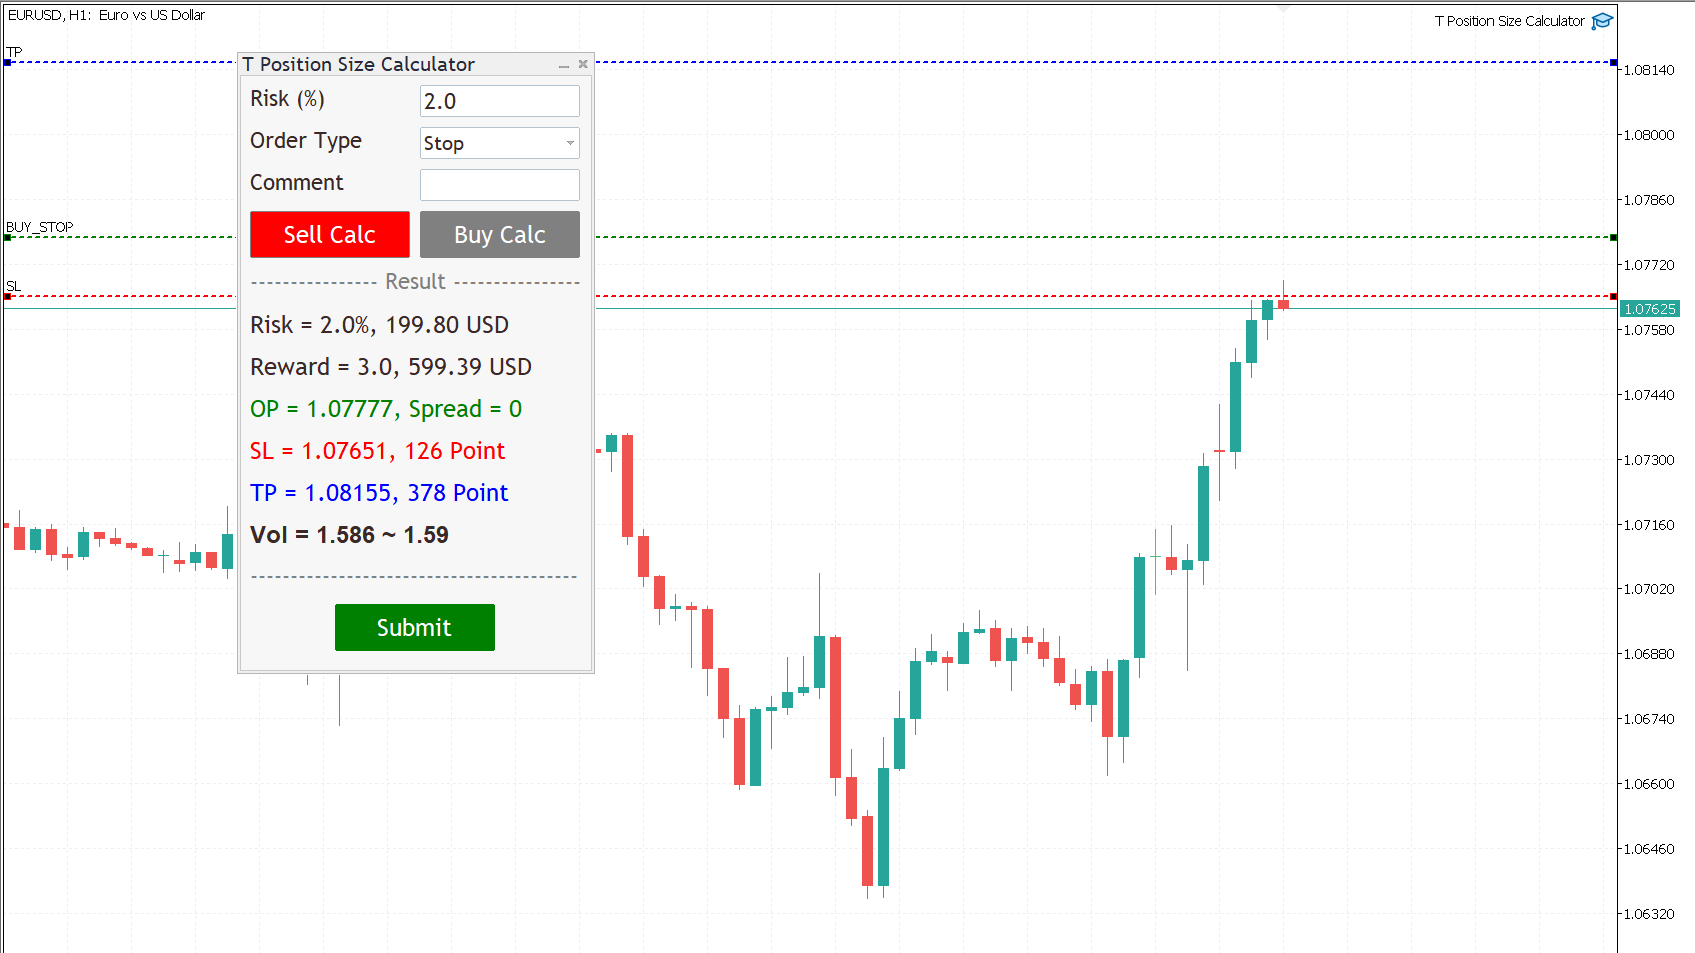
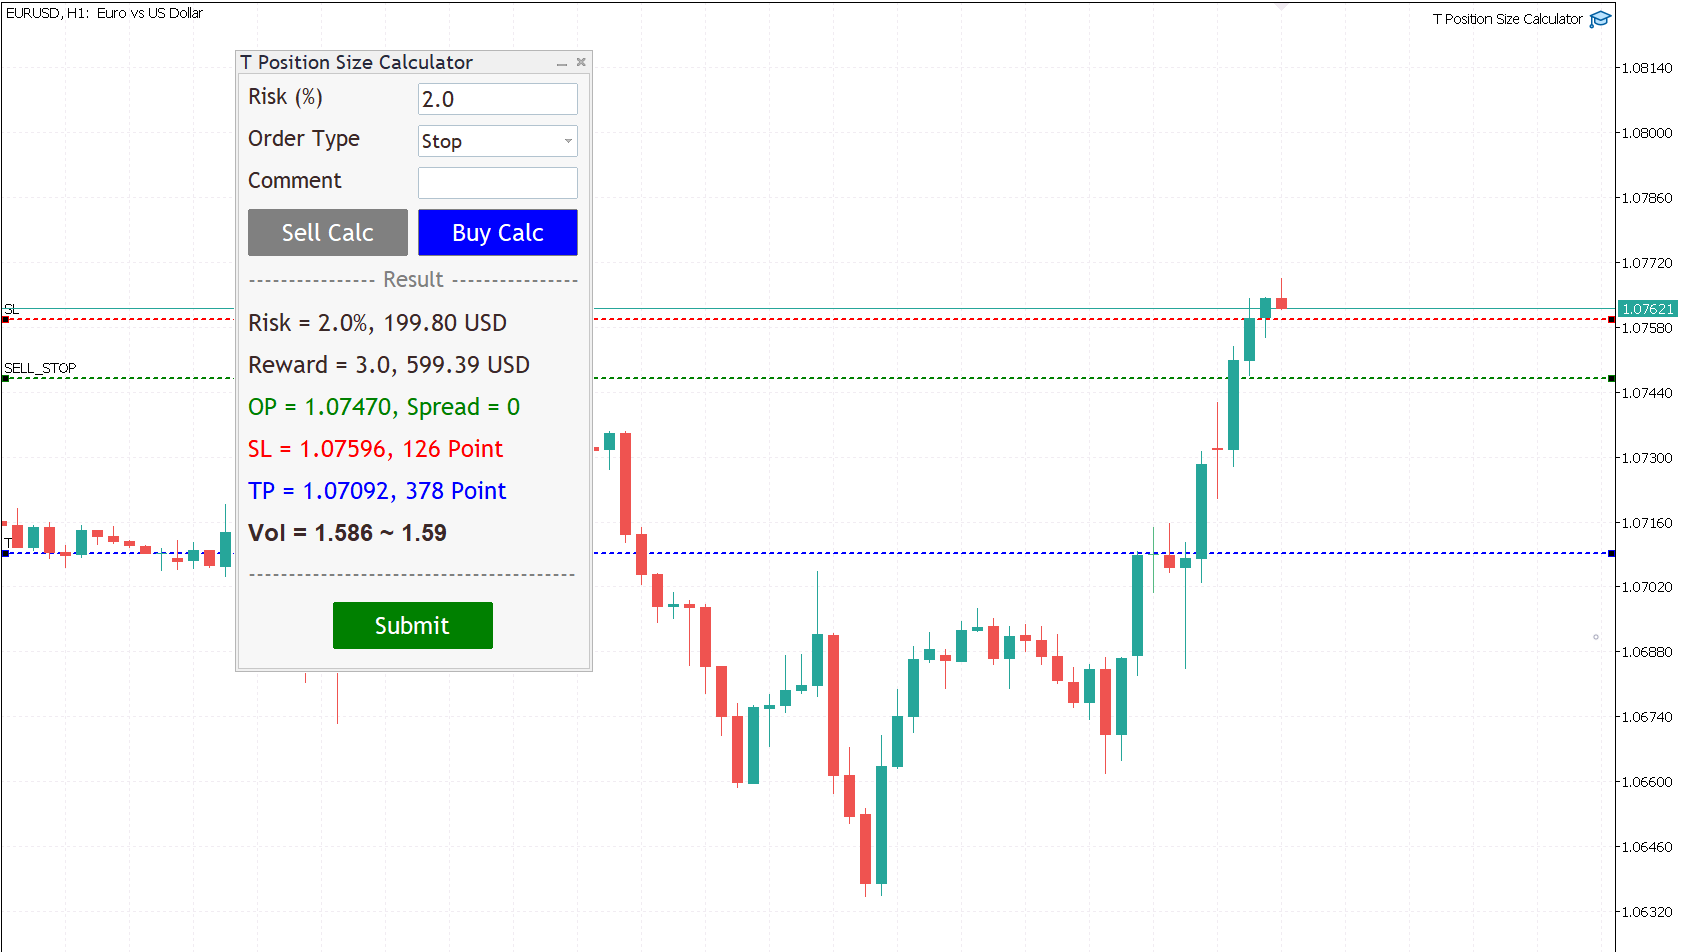
Simply enter the percentage you’re risking in Risk % of the box, 2 mean that 2%.
-
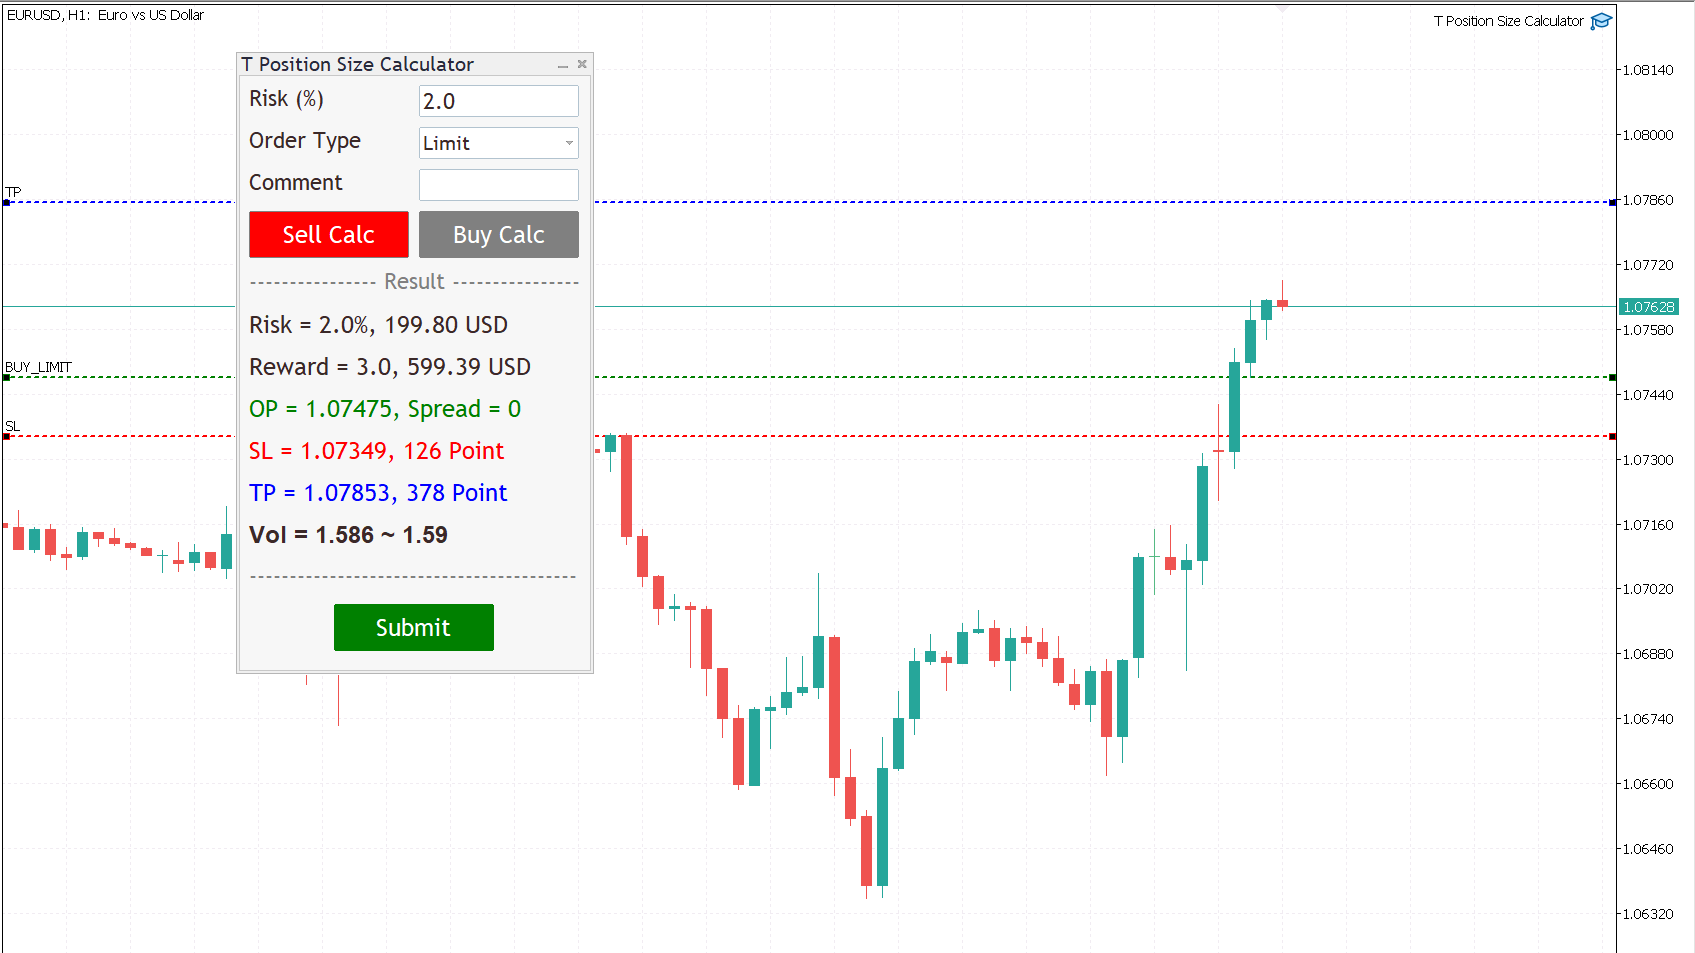
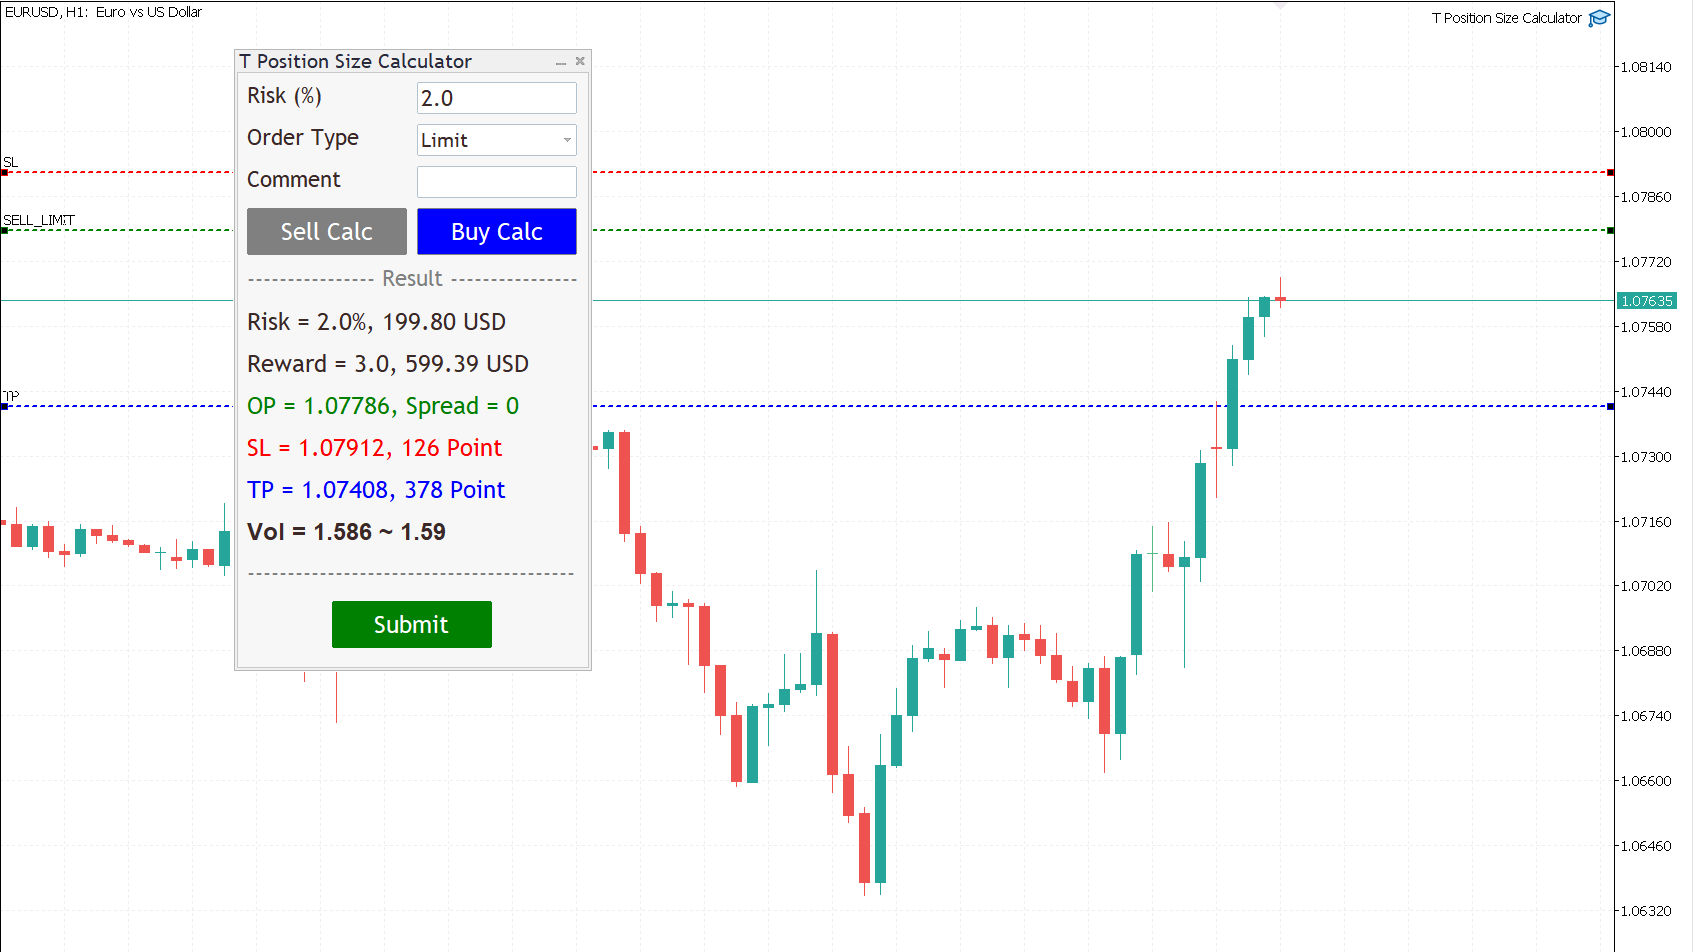
Select order type (can be Market, Limit, Stop).
-
Press the “Sell Calc” or “Buy Calc” button.
This will trigger (show) 3 lines on your current chart. You can drag and drop the lines (Order Line, Stop Line, Profit Line) to determine your risk / reward.
Then this tool will automatically calculate volume (position size) instantly and result will show in this dialog panel.
-
When you agree, press Submit button to execute the trade (submit your order to market) .
Note that submitting can be failed so you try press Submit button a gain.
That’s it! – It even works on future pending orders too!
ADDITIONAL FUNCTION
-
Dialog Manager
-
Width app : 320, You can change width app by try this option.
-
Toggle minimize : m, When you press M key, dialog will minimize. Press M key gain, dialog will maximize.
-
Risk (%) min : 1.0
-
Risk (%) max : 5.0
If you input risk(%) is in of range, min and max. The this tool will accept your input then calculate after click on the button.
-
Trading Lines Manager - Order Line, Stop Line, Profit Line
-
Distance (%), Order and Stop : 5, We set the default value, distance from order price to stop price, is five percent of chart's high.
-
Reward ratio : 3.0, Reward radio is 3 time of the distance.
-
Line width : 2
-
Line color :
-
Line style :
-
Bring to back : true
-
Z-order : 0
Properties of the lines.
-
Deviation (avoid requotes) : 5, It is important to note that requotes will still occur if the price change is more than the set range of deviation.
Shortcut Key
Below instruction have some functions work with shortcut key to manage your task faster than normal.
Note that you can change or add more value.
-
Timeframe : H1=1,H4=2,D1=3,W1=4,MN=5
When you press 1 key then your timeframe chart change to H1, Press 2 change to H4,...
However you can add more timeframe with the key.
-
Goto name : GOTO-DATE, define the name of vertical line for navigate chart.
-
Goto to date (GOTO-DATE) : g
When you press G key, the chart will navigate to GOTO-DATE
-
Update goto : G
When you press shift + G key, It will update goto-date position to current screen at first bar (left corner).
-
Goto all open charts : true, Synchronize all charts navigate to GOTO-DATE.
-
Open watch-list : M
When you press shift + M key, Open all symbols in watch-list, max = 5.
-
Max Symbols in watch-list : 20, Maximum symbols can be opened when press M key.
-
Synchronize other charts : S,
When you press shift + S key, It will synchronize all open charts with current chart.
-
Synchronize crosshair : true, Show crosshair (vertical and horizontal lines) in synchronize charts when middle mouse click. If you toggle click, show and hide.
-
Save current template : T
When you press shift + T key, Save template's name with the symbol's name both master and slave chart, Path : \MQL5\Files\Templates
Note that if want to save template by manual, you need to minimize dialog before.
-
Apply current template : t
When you press shift + t key, Apply the template is saved. If not found it apply with DEFAULT-TEMPLATE
-
Default template :DEFAULT-TEMPLATE
-
Slave chart : true,
When you drag symbol on watchlist to drop on the chart then press shift + T key, Save template's name with the symbol's name both master and slave chart.
When you drag symbol on watchlist to drop on the chart then press shift + t key, it will apply the template is saved to all opened charts. if not found it will apply DEFAULT-TEMPLATE before you must save it.
-
Hide / Show indicators : i, Press I key, hide / show indicators.
-
Equal height indicators : /, Press / key, set equal height all indicators.
-
Clear fixed height indicators : I, Press shift + I key, remove fixed height indicators.
-
Double click left or right corner chart or indicator window to toggle maximize the window.
-
Delete all objects : D, Press shift + D key, delete all objects tool on the current chart.
-
Delete recent (stack) object : Z, Press shift + Z key, delete a recent object by order.
-
Synchronize objects properties : true, When change properties current object, It will change all the same object type with changed properties.
-
Toggle LOW TIMEFRAME object visibility : L, Press shift + L key, hide/show all object that you draw in lower than current timeframe.
-
Toggle CURRENT TIMEFRAME object visibility : C, Press shift + C key, hide/show all object that you draw in current timeframe.
-
Toggle HIGH TIMEFRAME object visibility : H, Press shift + H key, hide/show all object that you draw in higher than current timeframe.