SimSim Line KijunSen Plus MA MT5
- 지표
- Aleksandr Tyunev
- 버전: 1.7
- 업데이트됨: 25 7월 2023
- 활성화: 7
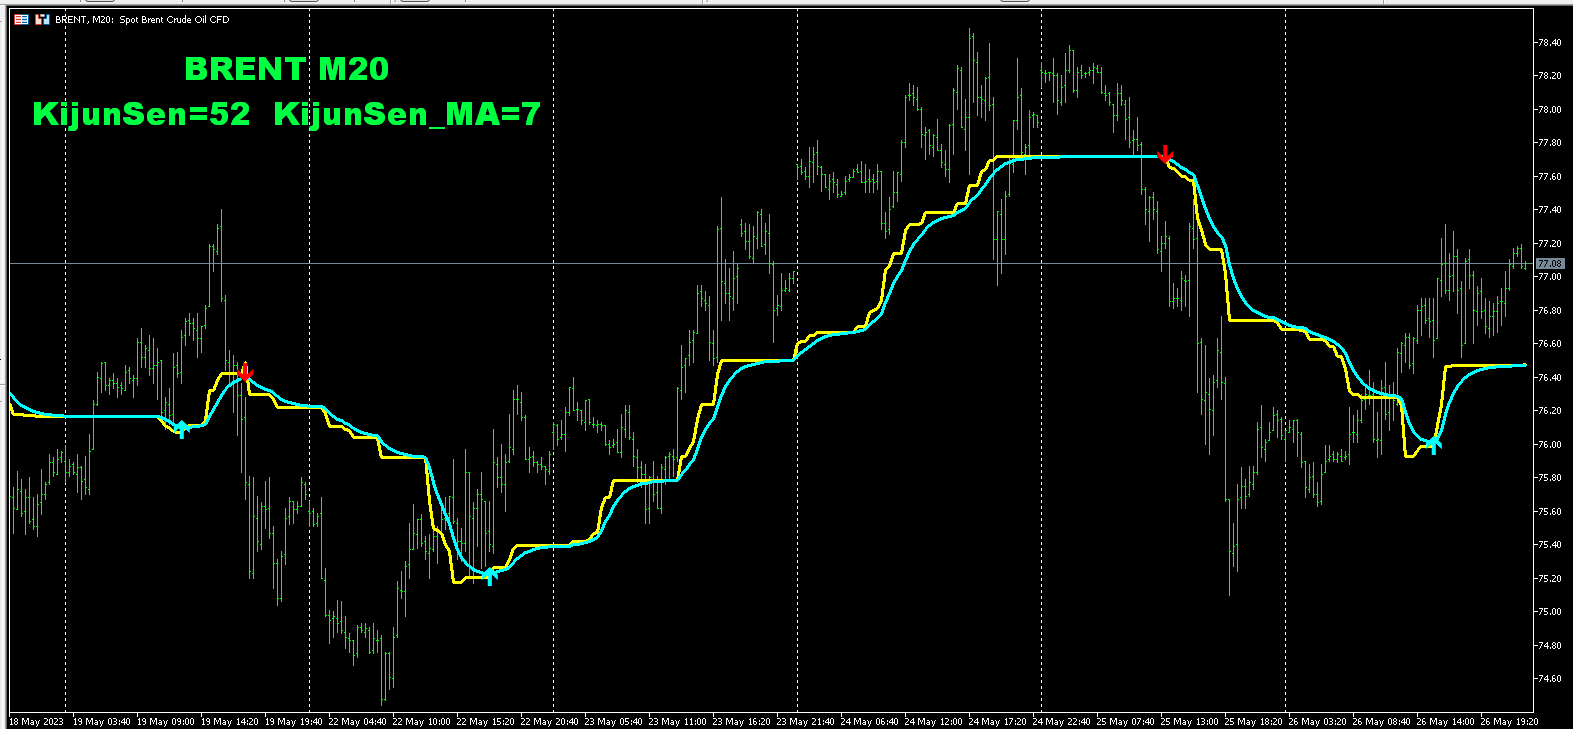
매우 간단하지만 효과적인 지표입니다.
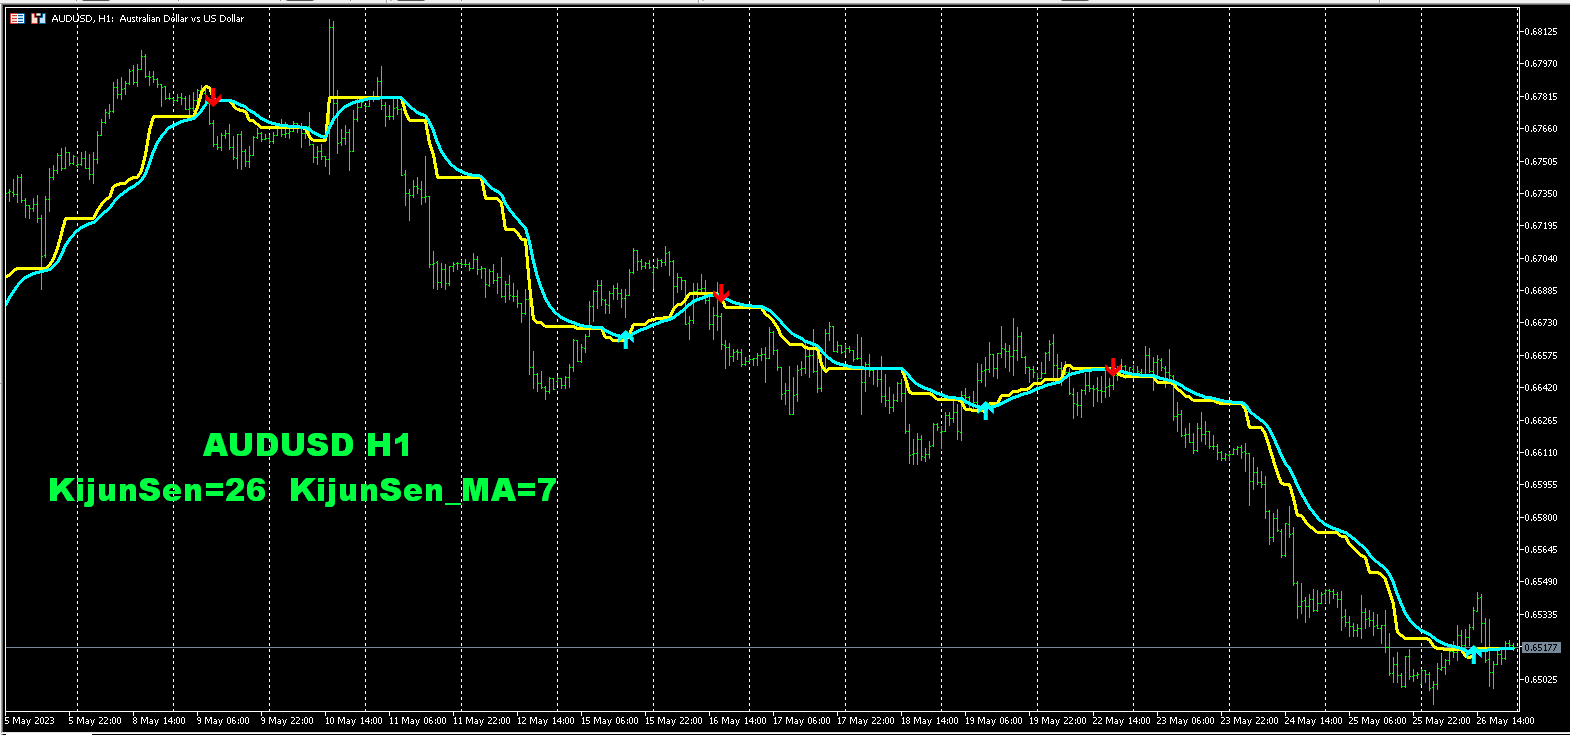
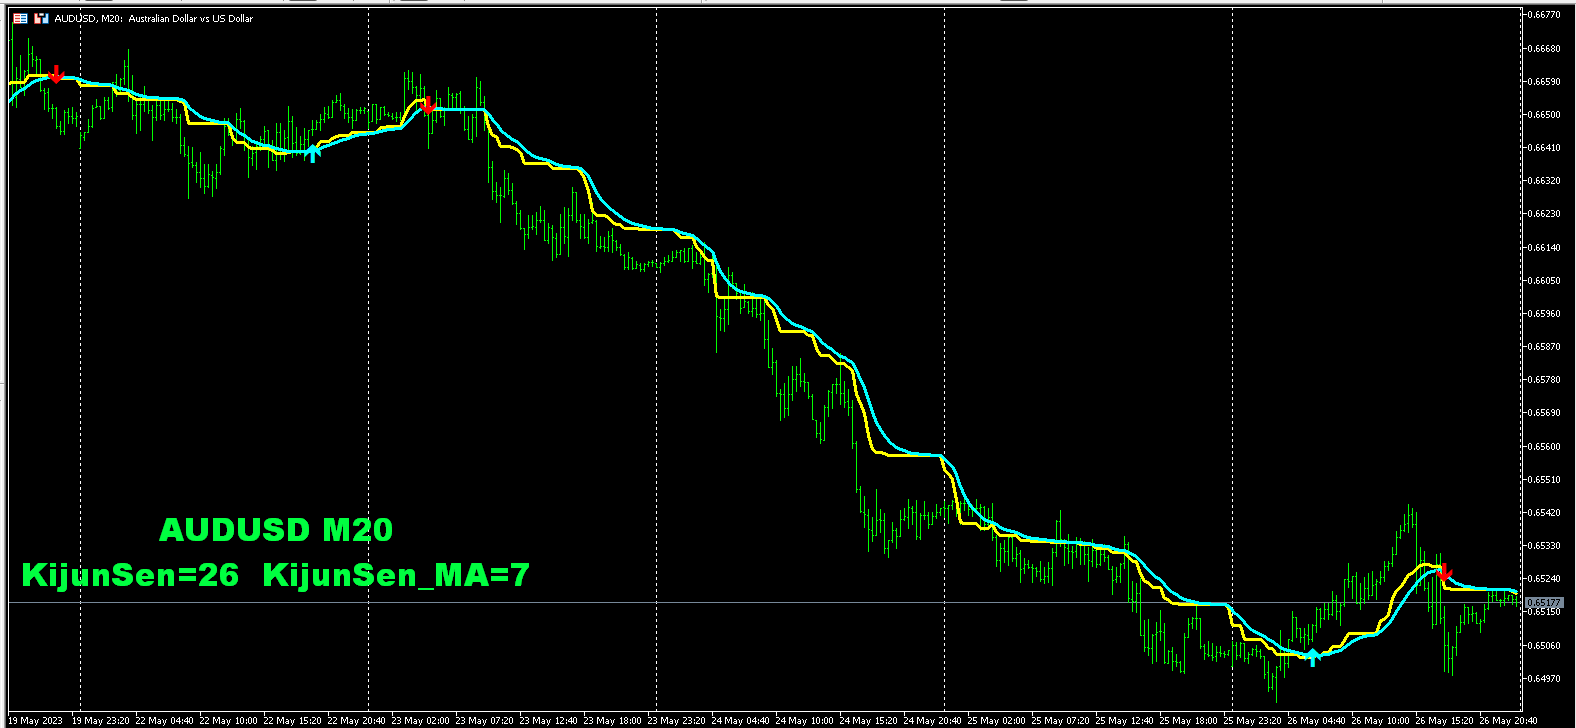
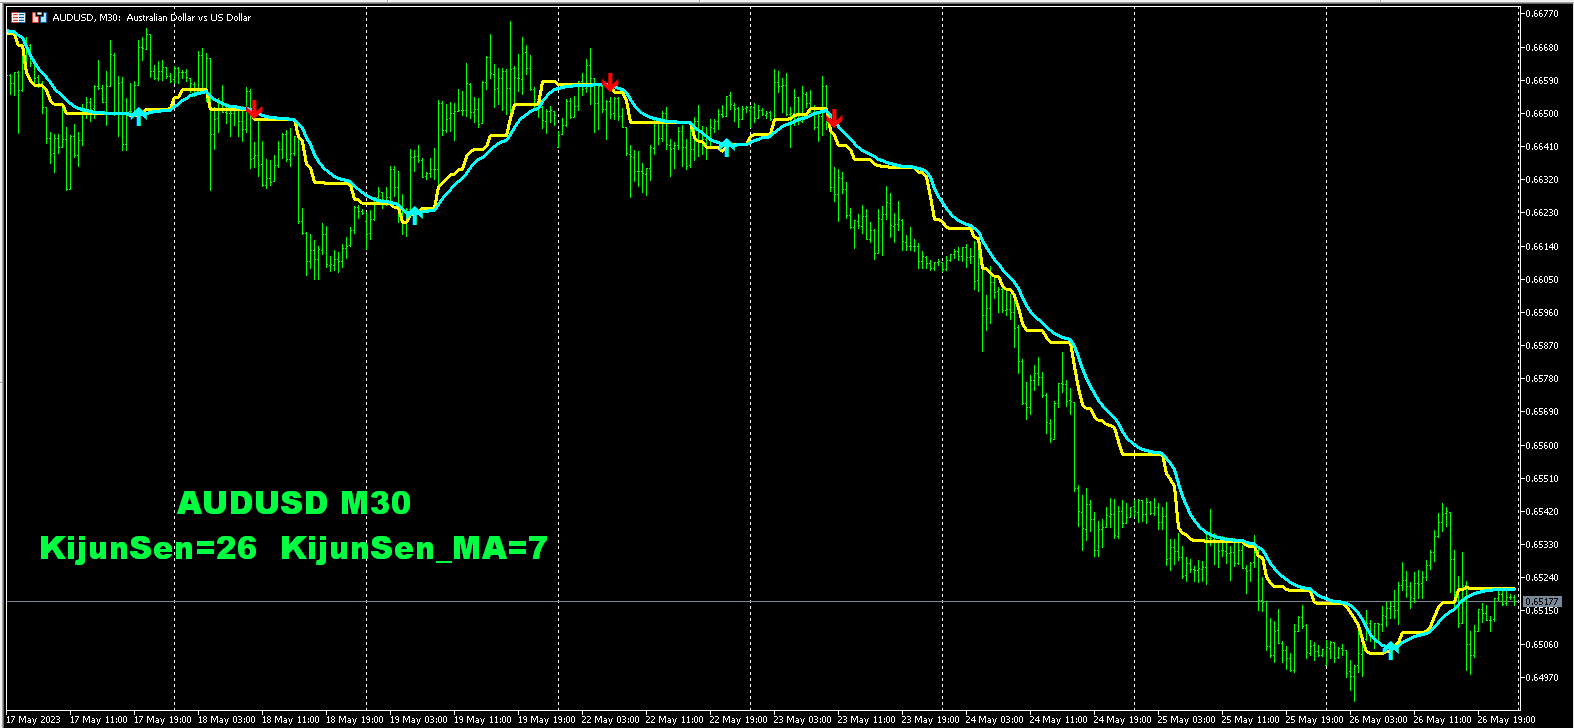
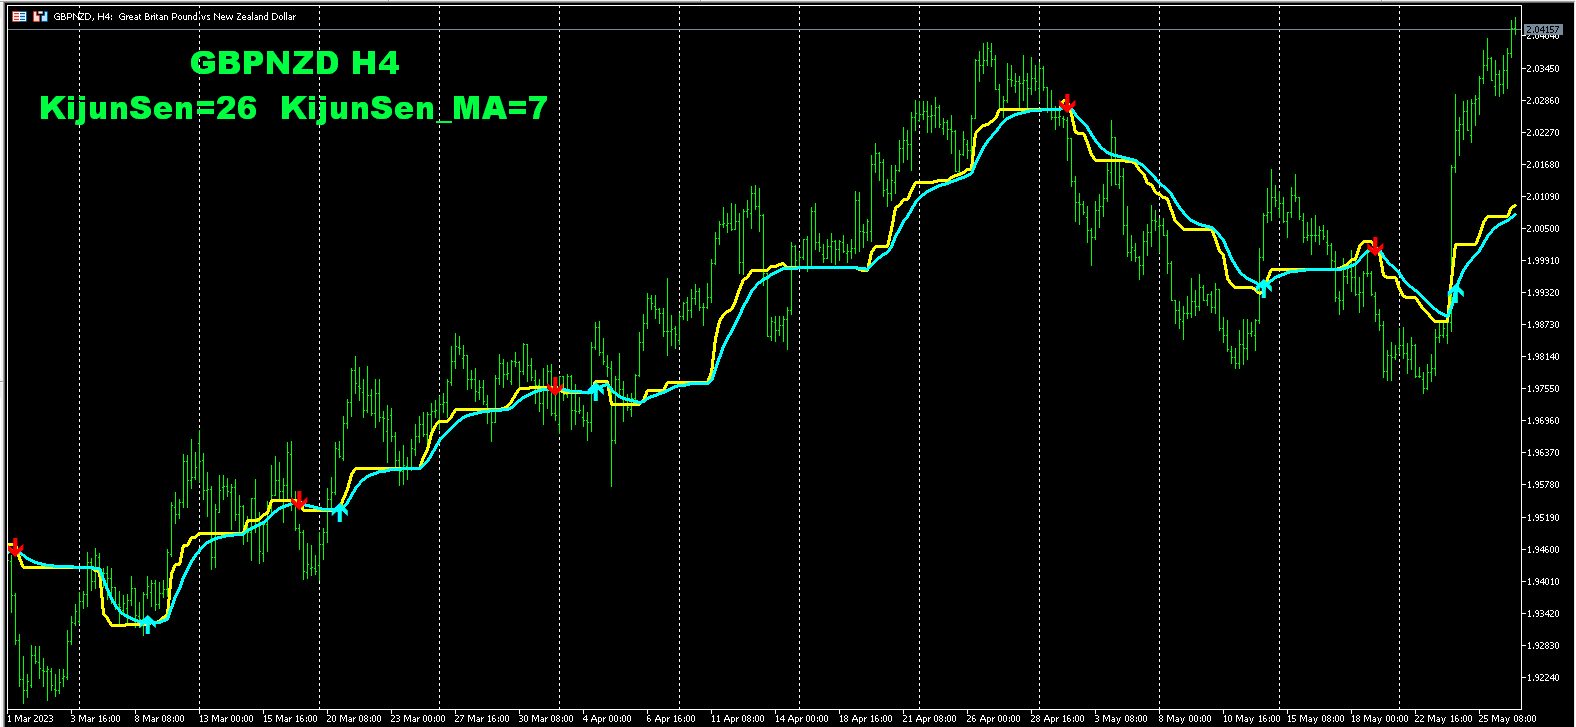
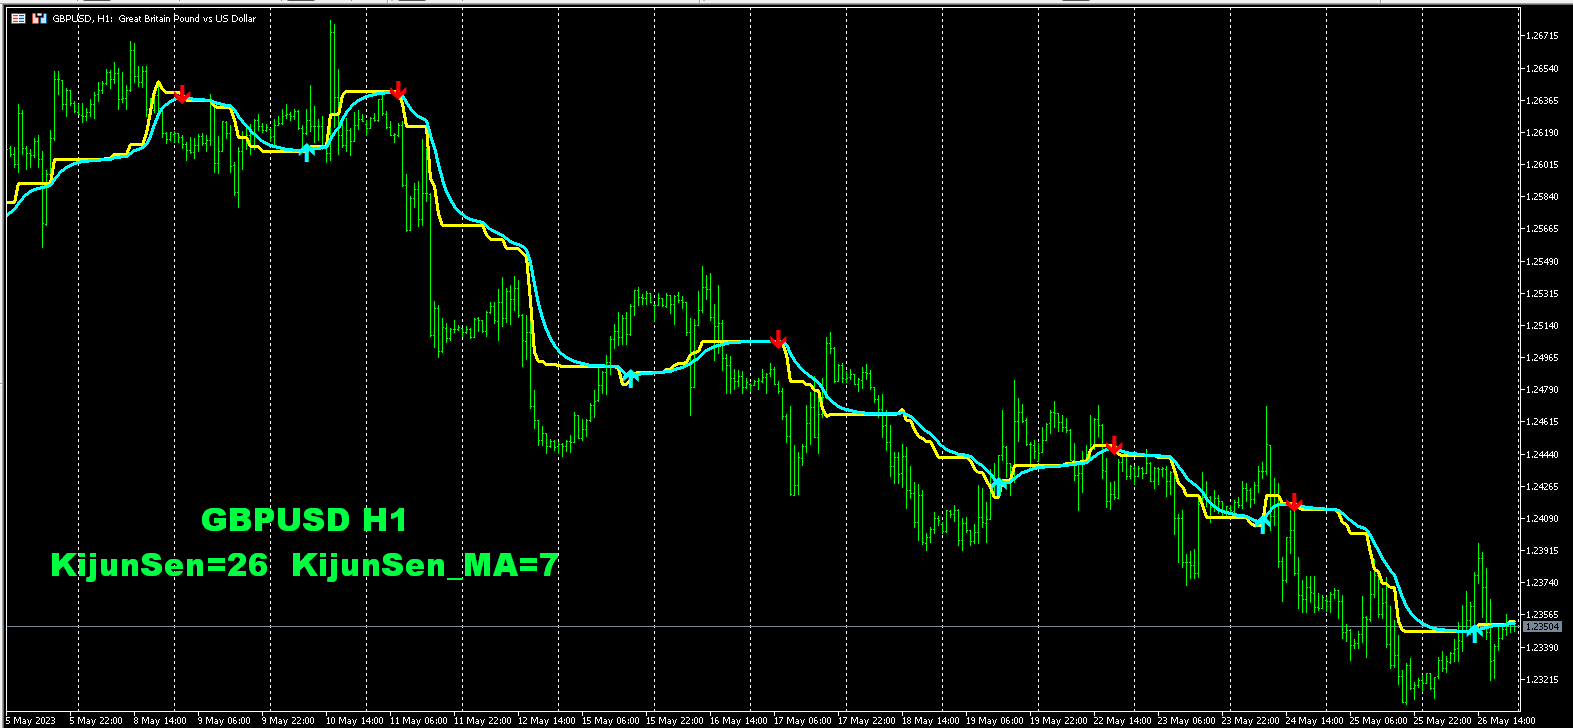
Ichimoku 지표의 KijunSen 라인과 이 라인의 평균 MA를 기반으로 합니다. 매수 또는 매도 신호: 이것은 두 선의 교차점입니다!!!
나는 종종 Ichimoku 지표의 KijunSen 라인을 거래에 사용합니다. 가격이 높으면 판매만 낮으면 구매만 고려합니다.
그리고 기준선을 평균화하여 기준선 MA선을 형성한 후 두 선의 교차점이 나타나 매매 신호가 증폭된 것으로 해석할 수 있다.
지표의 MT4 버전 링크:
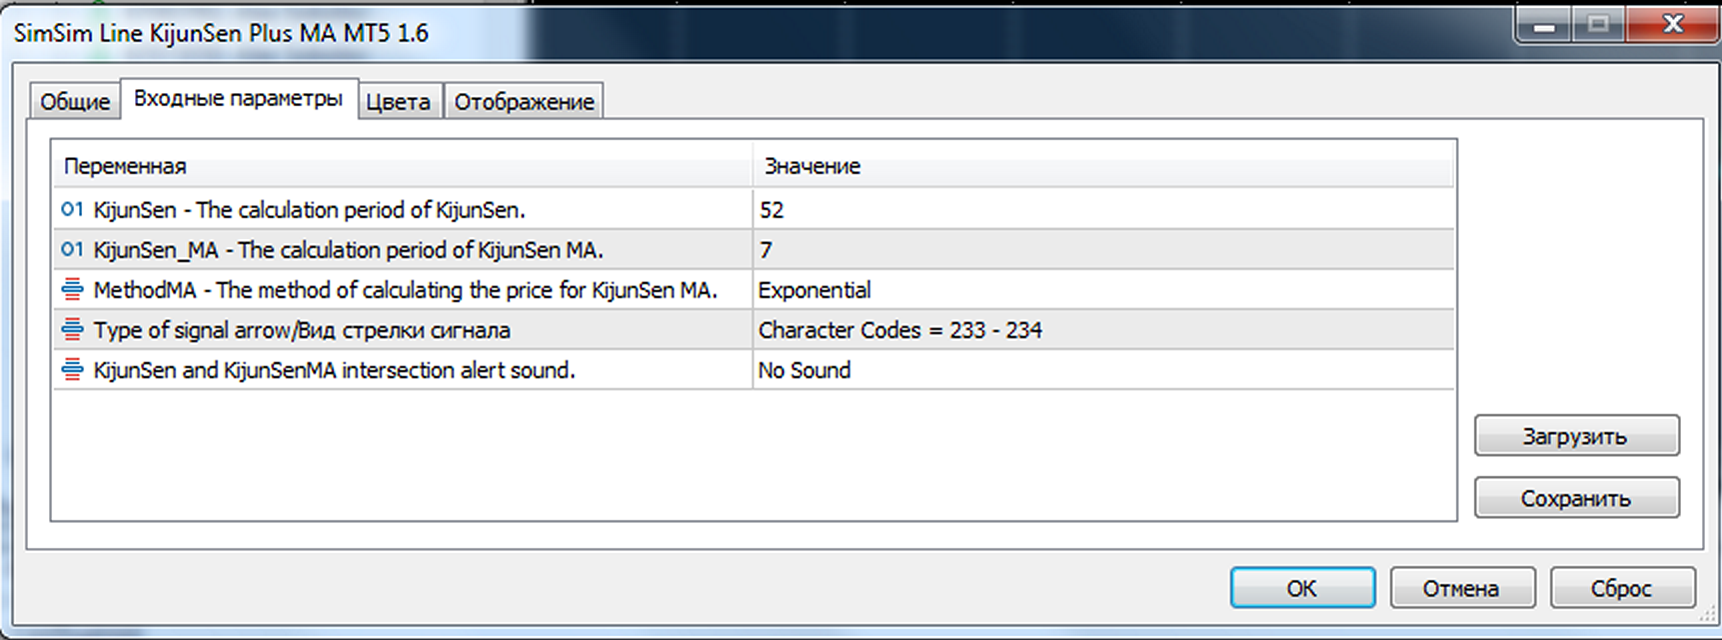
지표 매개변수:
기준센 - 기준센의 계산 기간입니다.
KijunSen_MA - KijunSen MA의 계산 기간입니다.
MethodMA - KijunSen MA의 가격을 계산하는 방법입니다.
소리 - 기준센과 기준센마 교차로 경고음.
PushMobil - 휴대폰으로 알림.
Expert Advisors와의 통신을 위한 표시기 버퍼.
버퍼 번호에서. 0은 지표의 KijunSen 라인입니다.
버퍼 #1에는 지표의 KijunSen MA 라인이 포함됩니다.
Ichimoku 지표의 KijunSen 라인과 이 라인의 평균 MA를 기반으로 합니다. 매수 또는 매도 신호: 이것은 두 선의 교차점입니다!!!
나는 종종 Ichimoku 지표의 KijunSen 라인을 거래에 사용합니다. 가격이 높으면 판매만 낮으면 구매만 고려합니다.
그리고 기준선을 평균화하여 기준선 MA선을 형성한 후 두 선의 교차점이 나타나 매매 신호가 증폭된 것으로 해석할 수 있다.
지표의 MT4 버전 링크:
https://www.mql5.com/ru/market/product/96120
지표 매개변수:
기준센 - 기준센의 계산 기간입니다.
KijunSen_MA - KijunSen MA의 계산 기간입니다.
MethodMA - KijunSen MA의 가격을 계산하는 방법입니다.
소리 - 기준센과 기준센마 교차로 경고음.
PushMobil - 휴대폰으로 알림.
Expert Advisors와의 통신을 위한 표시기 버퍼.
버퍼 번호에서. 0은 지표의 KijunSen 라인입니다.
버퍼 #1에는 지표의 KijunSen MA 라인이 포함됩니다.