Supply Demand FVG Zones
- 지표
- Krzysztof Janusz Stankiewic
- 버전: 2.2
- 업데이트됨: 2 6월 2024
- 활성화: 5
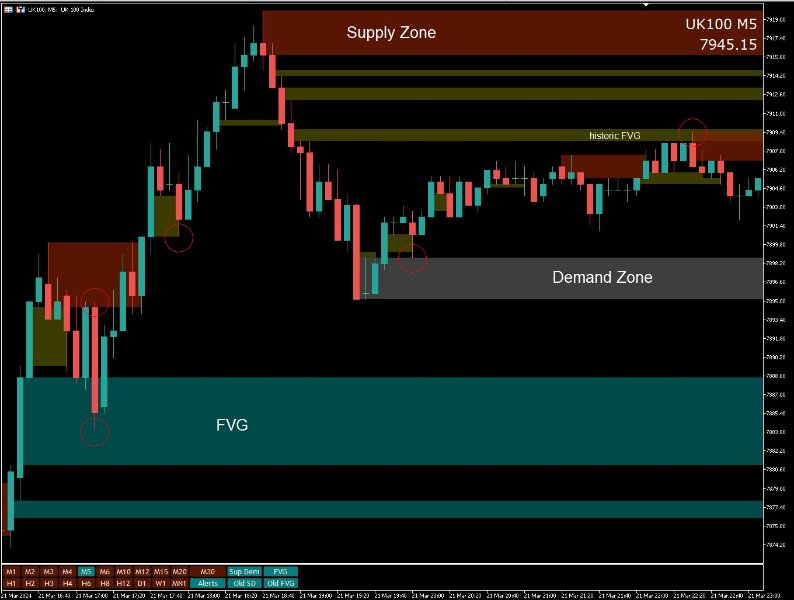
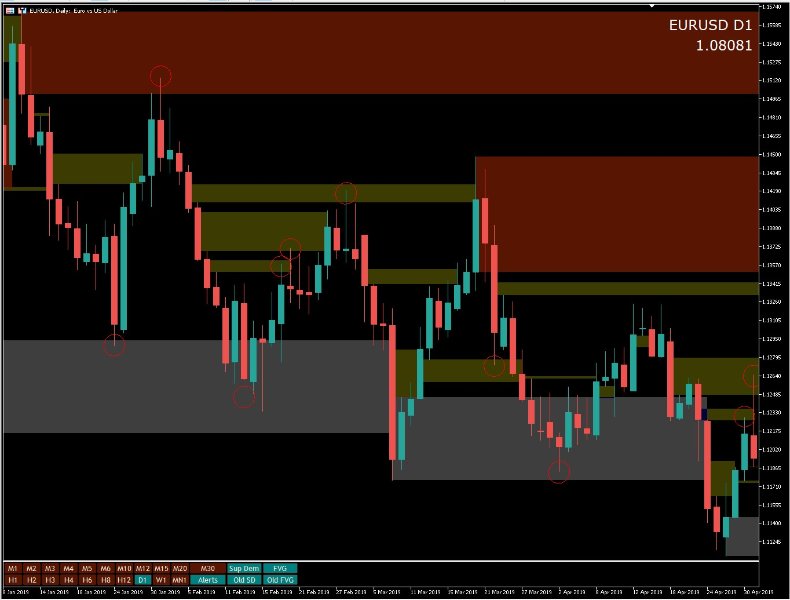
Supply or demand zones refer to price areas where a significant amount of supply or demand had previously entered the market, causing prices to either fall or rise. If the price returns to the demand or supply zone, it is likely to bounce off due to the large number of orders previously placed within the zone. These orders will be defended in these areas.
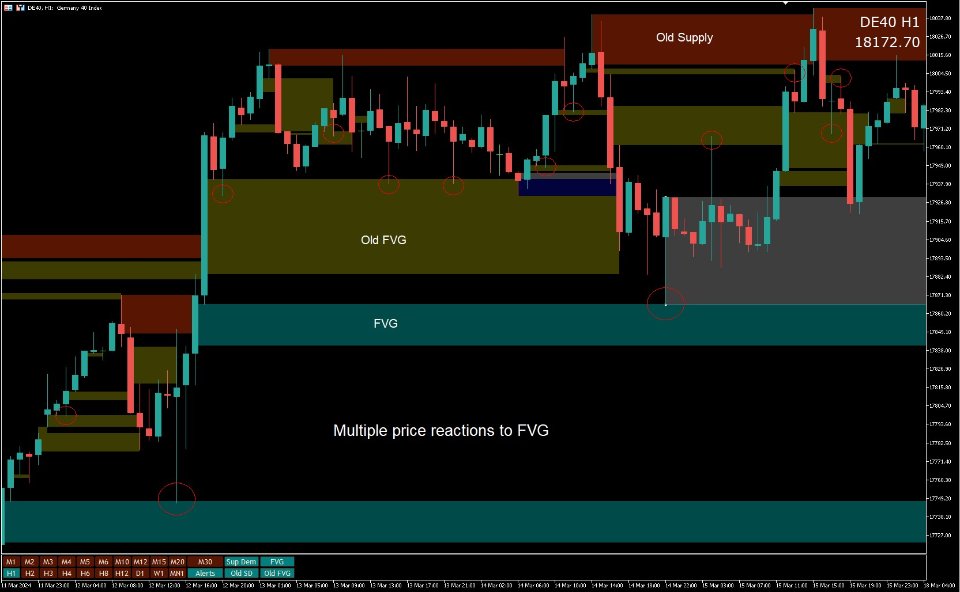
The Fair Value Gap (FVG) is a concept used to identify imbalances in the equilibrium of buying and selling. Fair Value Gaps are formed in a three-bar pattern when neither the left nor the right bars engulf the middle one.
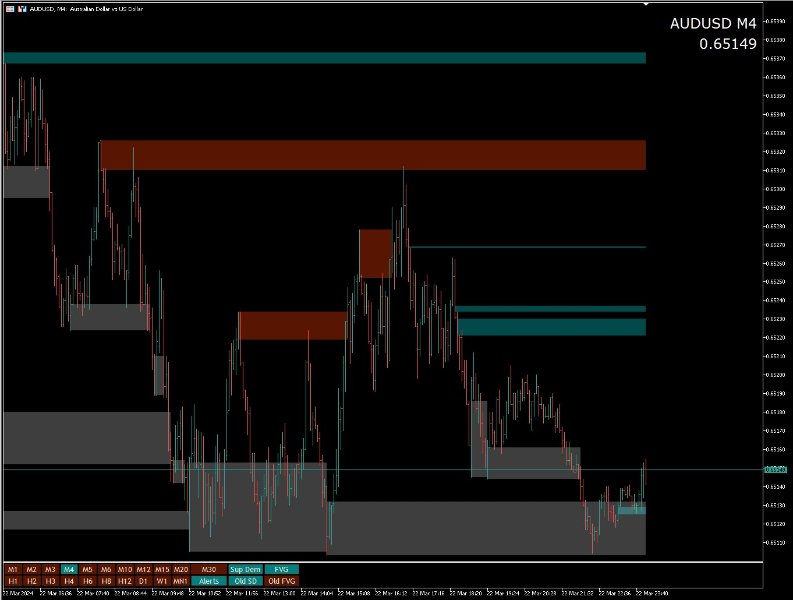
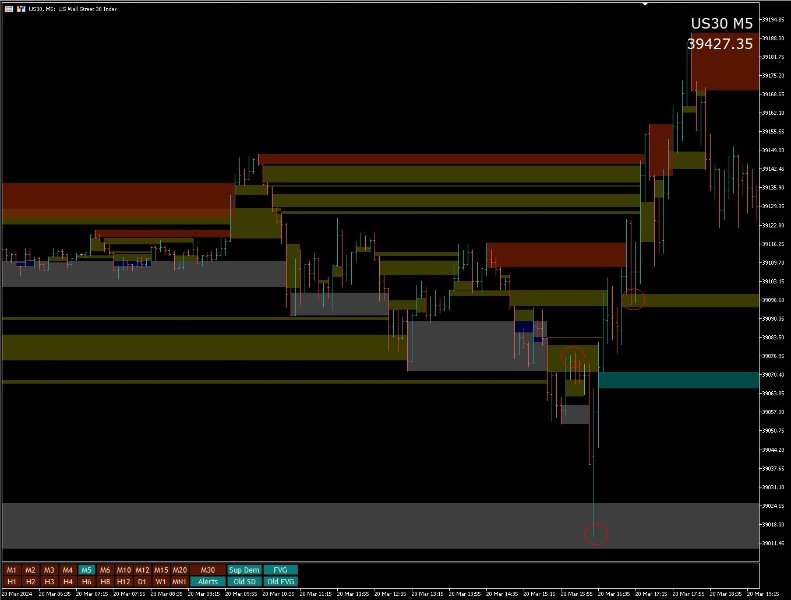
The primary function of this indicator is to delineate:
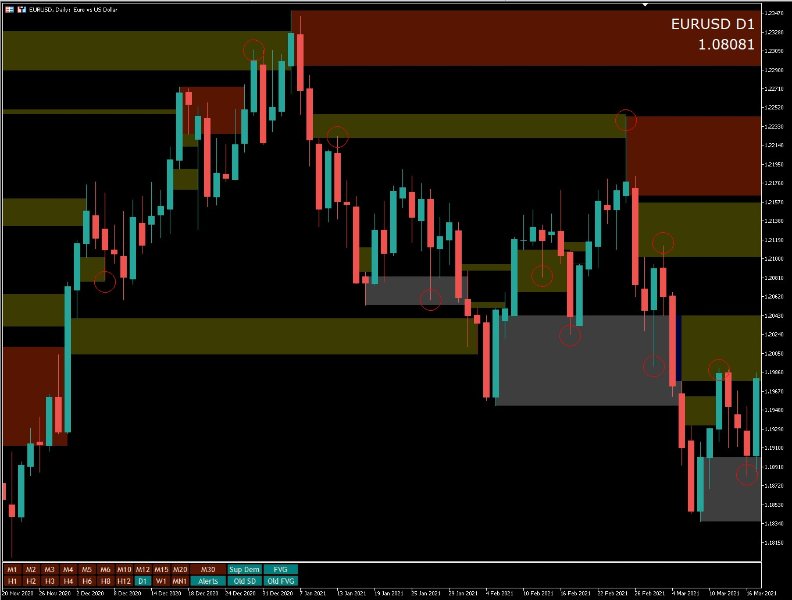
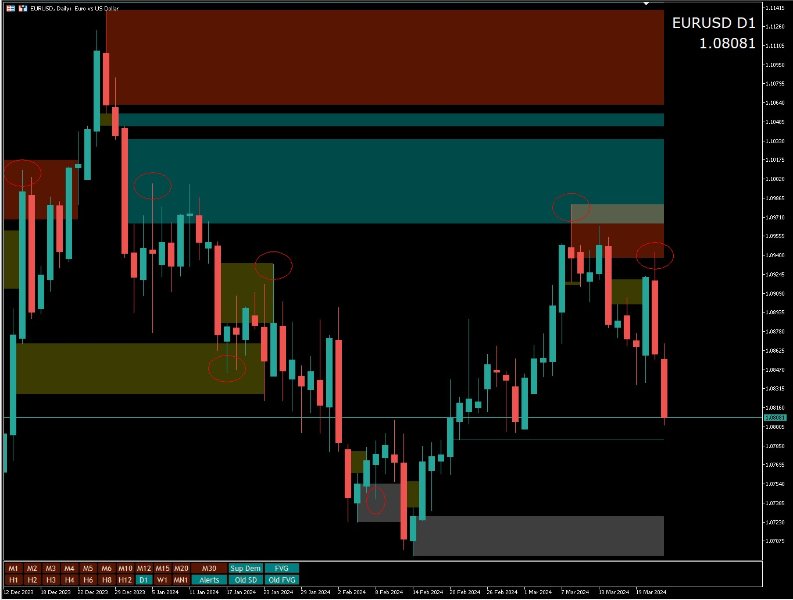
— Supply Zones, — Demand Zones, — Fair Value Gaps
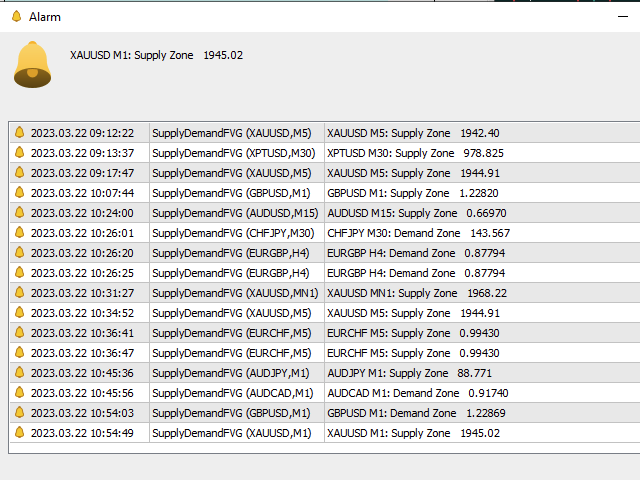
The indicator is able to send three types of alerts when a price reaches a supply or demand zone.
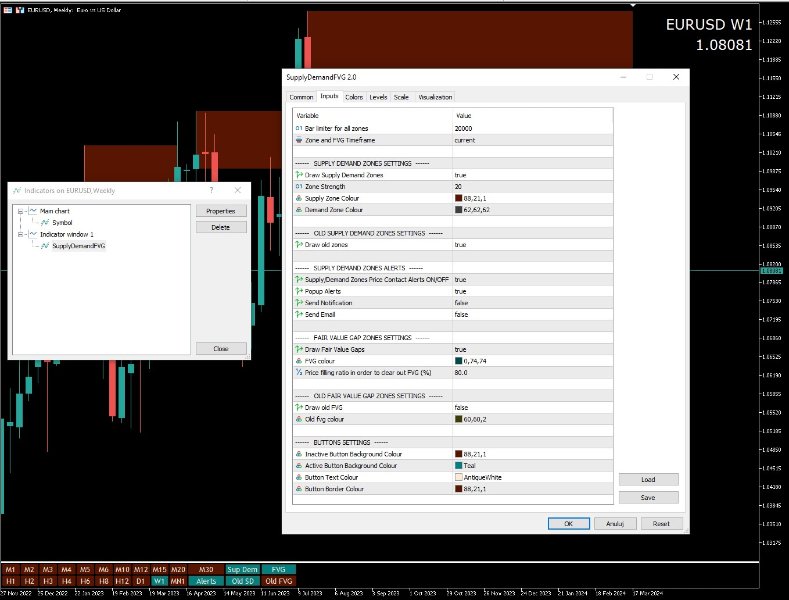
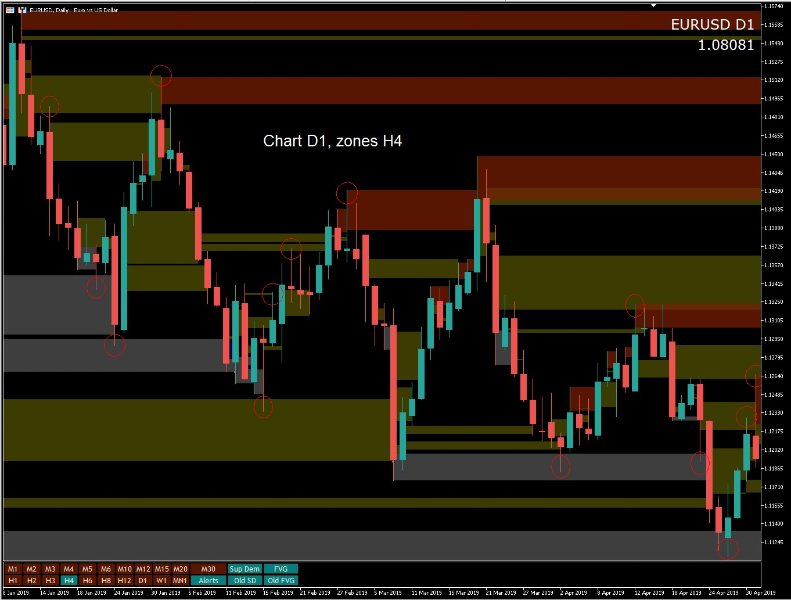
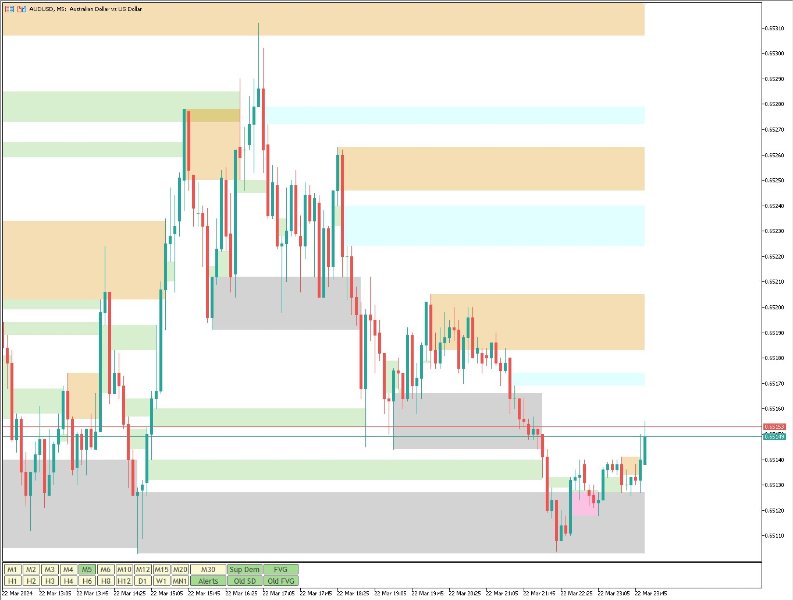
The timeframe for the zone is set independently of the chart timeframe. For instance, it is possible to set M5 zones on an H4 chart. The significance of zones can be adjusted using the Zone Strength parameter.
Demand zones are displayed if at least one candle within the zone’s range is entirely above the zone. Conversely, supply zones are displayed if at least one candle within the zone is entirely below the zone.
Alerts can be set for supply and demand zones and can be configured as popup alerts, “send notification” alerts, or “send email” alerts.
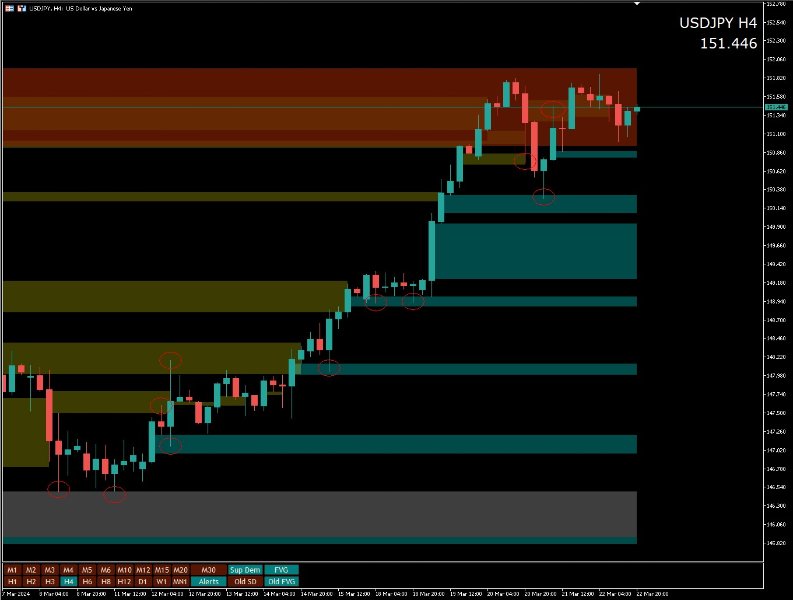
Historical zones were introduced in the second version of the indicator. They allow for the examination of past price reactions to old demand and supply zones as well as FVGs
The indicator includes a set of steering buttons in a subwindow. Zones and buttons colors are adjustable.

