ZigZag with Extras for MT5
- 지표
- Fernando Carreiro
- 버전: 2.0
- 활성화: 20
(Google 번역)
이 지표는 MetaTrader 설치와 함께 소스 코드 예제로 제공된 원본 지그재그를 기반으로 합니다.
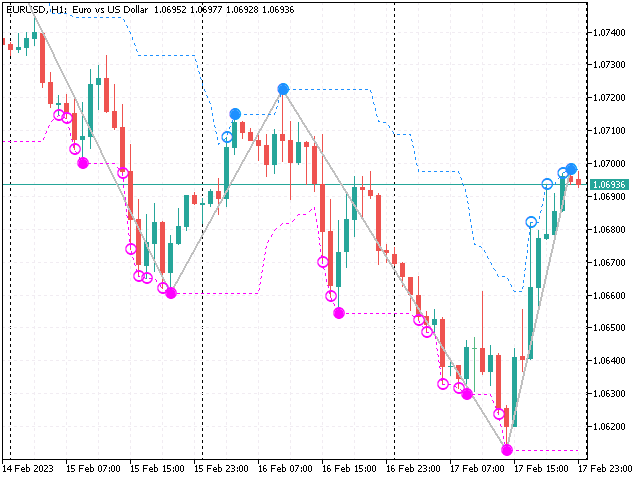
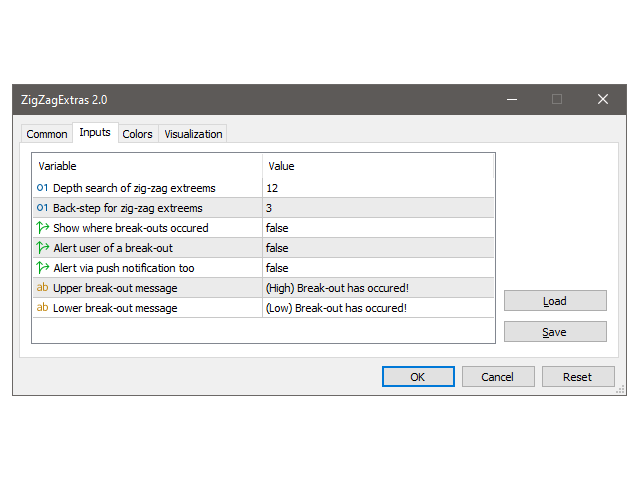
"깊이" 채널과 해당 브레이크 아웃을 표시하기 위한 몇 가지 추가 기능으로 다시 작성했습니다. 또한 이전 지그재그 지점을 관찰할 수 있습니다.
선택적으로 탈주 발생 시 사용자에게 경고할 수 있습니다. 알림은 단순히 단말기에 있을 수도 있고 모바일 기기의 푸시 알림을 통해 나만의 맞춤 텍스트로 보낼 수도 있습니다.
(Original text)
This indicator is based on the original ZigZag provided as a source code example with MetaTrader installations.
I rewrote it with some extra features for displaying the “depth” channel and the respective break-outs. It also allows one to observe prior zig-zag points.
Optionally, it can alert the user when break-outs occur. The alerts can be simply on the terminal or also via push notifications on a mobile device, with your own custom text.


This was fun to run in the strategy tester. I would actually say that this could be one of the strongest signal indicators out there. The zig zag alone famously repaints, but this version may actually alert you at the point of divergence along with a useful trailing stop/trend line