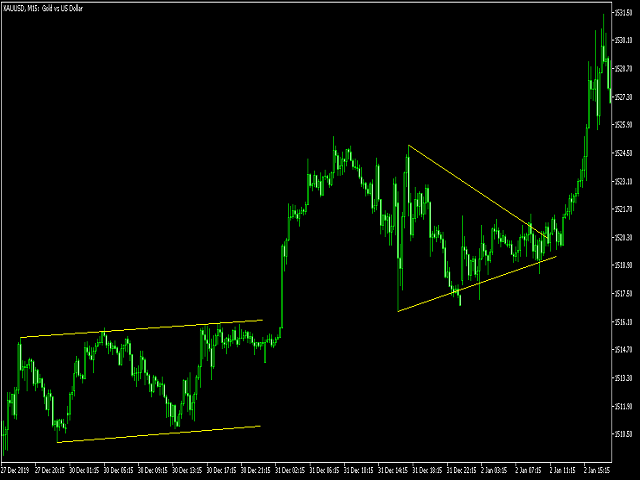
SV Flag and Pennant pattern with alert
- 지표
- Minh Truong Pham
- 버전: 1.0
- 활성화: 5
Flags and pennants can be categorized as continuation patterns. They usually represent only brief pauses in a dynamic market. They are typically seen right after a big, quick move. The market then usually takes off again in the same direction. Research has shown that these patterns are some of the most reliable continuation patterns.
Bullish flags are characterized by lower tops and lower bottoms, with the pattern slanting against the trend. But unlike wedges, their trendlines run parallel.
Bearish flags are comprised of higher tops and higher bottoms. "Bear" flags also have a tendency to slope against the trend. Their trendlines run parallel as well.
Pennants look very much like symmetrical triangles. But pennants are typically smaller in size (volatility) and duration.
(Volume generally contracts during the pause with an increase on the breakout.)
This indicator scan all flags and pennant pattern and alert when pattern found. So trader no need to look at chart all day to find pattern.
Settings:
+ Horizontal Slope: is horizontal of pattern. Default is 0.01 . With symbol has digit=2, indicator auto multip by 10. You should test to find most suitable value.
+ Tolence of midle pivot point: is tolence of pivot 1-3 and 3-5. In theory, 1-3-5 pivot point must in a line but this difficult happen in real. This value is tolence of midle pivot (3) point. With symbol has digit=2, indicator auto multip by 10
+ Line extend (bar): is bars extend trendline. Default is 20 bars
+ Alert: you can setting notification in terminal, MT mobile app, Telegram.
Notes:
To find best entry, trader should wait to break pattern, confirm price and confirm volume to make sure trend is continue!


