• 미리보기
  • 리뷰
  • 코멘트
  • 새 소식

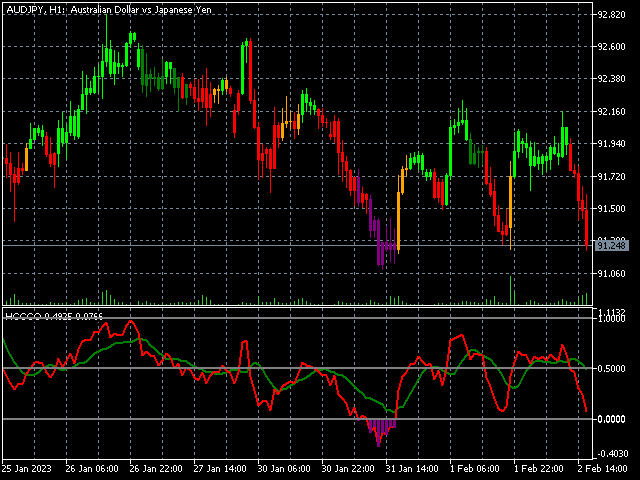
Hurst Cycle Channel Clone Oscillator by LazyBear

For MT4 version please send private message.

- This is the exact conversion from TradingView source: "Hurst Cycle Channel Clone Oscillator" By "LazyBear".

- For bar color option please send private message.

- This is a non-repaint and light processing load indicator.

- Buffers and inputs are available for use in EAs and optimization purposes.

- You can message in private chat for further changes you need.


추천 제품
The Squat is a function of the range of a given price bar and the volume, or TIC volume, that occurs while that range is being created. The basic idea is that high volume and little price movement indicate substantial support or resistance. The idea behind the approach to this indicator is to first look for likely Fibonacci support and resistance and then see if Squat manifests when that point is reached. The indicator determines one of the high probability patterns of DiNapoli. It does not re
Bu indikatör Deriv firmasındaki Boom ve Crash çiftlerinde spike hareketlerini tespit etmek ve işleme girmek için kullanılır. Kullanılan çiftler Boom300, Boom500, Boom1000, Crash300, Crash500, Crash1000. İndikatör, beklenen yönde ok işareti verdiği zaman işleme girilir ve indikatörün gösterdiği destek/direnç bölgelerine Stop Loss koyulmalıdır. İndikatör yeniden boyama(repaint) yapmaz. Trend takibi için değil, spike yönünde işleme girmek için kullanılır. Tavisye edilen; sadece spike yönünde işlem
Blahtech Market Profile MT5
Blahtech Limited
5 (8)
Was: $249  Now: $99   Market Profile defines a number of day types that can help the trader to determine market behaviour. A key feature is the Value Area, representing the range of price action where 70% of trading took place. Understanding the Value Area can give traders valuable insight into market direction and establish the higher odds trade. It is an excellent addition to any system you may be using. Inspired by Jim Dalton’s book “Mind Over Markets”, this indicator is designed to suit the
Description The indicator uses market profile theory to show the most relevant trading zones, on a daily basis. The zones to be shown are LVN (low volume nodes) and POC (point of control). An LVN zone is one which represents price areas with the least time or volume throughout the day. Typically, these areas indicate a supply or demand initiative, and in the future, they can turn into important breakout or retracement zones. A POC zone is one which represents price areas with the most time or vo
Hello There, Today I want to show you my new researchable fore BUY SELL indicator, it work all asset, and also work Derive Volatility asset! it work all time frame, but i recommend start 5 minute to H1 when you receive a signal just take trade and stay wait for your take profit asset All Major Pair And minor IT WORK ALSO XAUUSD Fantastic results,  for more info,,, message us thank you   
RAD Real Acummulation and Distribution
Jose Alejandro Jacome Jimenez
RAD CRITICAL LEVES RAD indicator tracks “Relevant Volume” in real time, identifying accumulation and distribution processes, projecting them in the chart as SUPPORT or RESISTANCE zones. Natural   support   and resistance levels are generated by Volume Accumulation and Distribution processes. As these processes evolve, levels at which the relevant volume in the market place is positioned, become difficult areas to cross upwards or downwards. By using this information, traders can identify very s
Introducing "X Marks the Spot" – Your Ultimate MetaTrader 5 Indicator for Perfect Trades! Are you tired of the guesswork in trading? Ready to take your MetaTrader 5 experience to a whole new level? Look no further – "X Marks the Spot" is here to revolutionize your trading strategy! What is "X Marks the Spot"? "X Marks the Spot" is not just another indicator – it's your personal trading compass that works seamlessly on all timeframes . Whether you're a beginner or an experienced trader,
This product is designed for the MT5 platform and offers two key features: VWAP (Volume Weighted Average Price) calculation and Volume Profile analysis. Advantages: VWAP Calculation: The product calculates the VWAP, which is a popular indicator used by traders to determine the average price of a security based on its trading volume. It helps identify potential buying or selling opportunities by comparing the current price to the average price weighted by volume. Volume Profile Analysis: The prod
Scalping Tips IN
Ta Thi Thuy Linh
The Scalping Project EA follows a scalping breakout strategy. It trades the breakouts from relative highs and lows. For the entry stop orders are used for the fastest possible execution. Profits can be secured by the adjustable trailing stop. Since the strategy works with small average profits it is highly suggested to trade with a low spread and commission broker. Trading costs are crucial here! The backtests shown in the screenshots were done with the default settings. There might be better or
A visualization system for favorite candlesticks price action patterns. Once attached, indicator will automatically mark next patterns on the chart: Pinocchio bar  - a small-body bar with a long 'nose', very well-known reverse pattern; Inside bar  - a bar whose range lies inside the range of the previous bar. It represents market incertitude; Outside bar  - a bar whose range exceeds the range of the previous bar. It represents market incertitude; Rails pattern  - two consequent opposite bars wit
Second To NoneFX Scalper
Lorenzo Edward Beukes
"2nd To NoneFX Scalper" is one powerful indicator which you can use on any timeframe. The accuracy is in between 90% - 95% can be more. The indicator is 100% non repaint so it doesn't repaint at all. When the arrow comes out wait for the candlestick to close the arrow won't repaint/recalculate or move. The indicator works with all volatility indices,step index, Boom & Crash(500 & 1000) and all currency pairs. You can change settings of the indicator. For great results find the trend of the pair,
TPO Profile MT5
Kyra Nickaline Watson-gordon
Definition : TPO is a Time Price Opportunity. Instead of using bars or candles with an Open, High, Low, and Close price, each "bar" in a Market Profile is represented by horizontal bars against the price It is called Market Profile terminology. In other words time-price-opportunity (TPO) profiles are histograms of how much time was spent at each price within the span of the profile. By using a TPO chart, you are able to analyze the amount of trading activity, based on time, for each price leve
PZ Trend Trading MT5
PZ TRADING SLU
3.67 (3)
Trend Trading is an indicator designed to profit as much as possible from trends taking place in the market, by timing pullbacks and breakouts. It finds trading opportunities by analyzing what the price is doing during established trends. [ Installation Guide | Update Guide | Troubleshooting | FAQ | All Products ] Trade financial markets with confidence and efficiency Profit from established trends without getting whipsawed Recognize profitable pullbacks, breakouts and early reversals The ind
SQZ uses an adaptive algorithm, which can adjust itself well according to the market. If you have studied the introductory model of machine learning, you should understand the linear regression model, which can predict short-term trends very well. Of course, this is only a part of the SQZ indicator. This is an indicator for understanding short-term trend reversals and works very well for tracking triggers. When the price shows HigherHigh and the indicator shows LowerHigh, there is a structural b
표시기는 현재 시세를 작성하여 과거 시세와 비교할 수 있으며 이를 바탕으로 가격 변동을 예측합니다. 표시기에는 원하는 날짜로 빠르게 이동할 수 있는 텍스트 필드가 있습니다. 옵션: 기호 - 표시기가 표시할 기호 선택. SymbolPeriod - 지표가 데이터를 가져올 기간 선택. IndicatorColor - 표시기 색상. HorisontalShift - 지시자가 그린 따옴표를 지정된 막대 수만큼 이동합니다. Inverse - true는 인용 부호를 반대로, false - 원래 보기를 반전합니다. ChartVerticalShiftStep - 차트를 수직으로 이동합니다(키보드의 위/아래 화살표). 다음은 날짜를 입력할 수 있는 텍스트 필드의 설정으로, '엔터'를 누르면 즉시 이동할 수 있습니다.
General Description In the simplest terms this is a contrarian intra-day scalping system. Built to try and let correct trades run as far as possible and flip the trade when indicated. The indicator looks at historical daily trading ranges to lay out levels at which it takes long and short positions based on the statistical levels. The indicator is built around index futures, mainly around S&P and the DOW but can be used an any futures contract mainly using AMP Futures to trade. The indicator is
Based on the trading model/strategy/system of gold double-position hedging and arbitrage launched by Goodtrade Brokers, problems encountered in daily operations: 1. Account B immediately places an order immediately following account A. 2: After account A places an order, account B will automatically copy the stop loss and take profit. 3: Account A closes the position of Account B and closes the position at the same time. 4: When account B closes the position, account A also closes the position.
Color Histogram Volume Set
Ricardo Almeida Branco
Do you use volume in your reading of the market? Certainly many traders use it, and do not imagine operating without it. The Color Histogram Volume Set indicator allows the user to choose the value that he considers interesting to monitor. When you pass this you will have visual confirmation and if you want you will also have the audible alert that is given by the indicator. Of course, there are other ways to try to find a high volume, such as assessing whether the volume
Candle EA MT5
Mansour Babasafary
4.32 (41)
This expert is based on patterns The main patterns of this specialist are candlestick patterns Detects trends with candlestick patterns It has a profit limit and a loss limit, so it has a low risk The best time frame to use this expert is M30 time frame The best currency pairs to use with this expert is the EURUSD, GBPUSD, AUDUSD, USDCAD currency pairs The price will increase by 100$ after every 10 purchases! Final price 2450$ Get a 50% bonus by buying (or even renting) any of our product
True Weis Wave
Atila Goncalves Firmino
A version based on David Waves' description in his book 'Trade About to Happen' of his adaptation of the Wyckoff wave chart. The indicator directionally accumulates volume, adding to each brick or candle close, with color indication for up and down. it can be used it with tick or real volume, it also changes color when the accumulated value of the previous wave is exceeded, being the trade signal. Yellow color is used for doji candlestick, it will continue with accumulation without zero the sum
Blahtech Supply Demand MT5
Blahtech Limited
4.57 (14)
Was: $299  Now: $99   Supply Demand uses previous price action to identify potential imbalances between buyers and sellers. The key is to identify the better odds zones, not just the untouched ones. Blahtech Supply Demand indicator delivers functionality previously unavailable on any trading platform. This 4-in-1 indicator not only highlights the higher probability zones using a multi-criteria strength engine, but also combines it with multi-timeframe trend analysis, previously confirmed swings
Quantum Currency Array Indicator for MT5
QUANTUM TRADING SOFTWARE LIMITED
This indicator has been developed to identify and display these trends quickly and easily, allowing you to see instantly, those currency pairs which are trending, and those which are not – and in all timeframes, with just one click. The 28 currency pairs are displayed as a fan as they sweep from strong to weak and back again, and this is why we call it the ‘currency array’. All 28 pairs are arrayed before you, giving an instant visual description of those pairs that are trending strongly, those
BoxChart MT5
Evgeny Shevtsov
5 (7)
The market is unfair if only because 10% of participants manage 90% of funds. An ordinary trader has slim changes to stand against these "vultures". This problem can be solved. You just need to be among these 10%, learn to predict their intentions and move with them. Volume is the only preemptive factor that faultlessly works on any timeframe and symbol. First, the volume appears and is accumulated, and only then the price moves. The price moves from one volume to another. Areas of volume accumu
The rubdfx divergence indicator is a technical analysis tool that compares a security's price movement. It is used to identify potential changes in the price trend of a security. The indicator can be applied to any type of chart, including bar charts and candlestick charts. The algorithm is based on MACD, which has been modified to detect multiple positive and negative divergences. Settings  ___settings___ * fastEMA * slowEMA * signalSMA *Alerts:   True/False     #Indicator Usage B
Hull Suite By Insilico
Yashar Seyyedin
5 (1)
To get access to MT4 version please click here . - This is the exact conversion from TradingView: "Hull Suite" By "Insilico". - This is a light-load processing and non-repaint indicator. - You can message in private chat for further changes you need. Here is the source code of a simple Expert Advisor operating based on signals from  Hull Suite . #include <Trade\Trade.mqh> CTrade trade; int handle_hull= 0 ; input group "EA Setting" input int magic_number= 123456 ; //magic number input double fixe
HLC bar MT5 Wyckoff
Eduardo Da Costa Custodio Santos
MT5에 대한 표시기 "HLC_bar_MT5 Wyckoff"는 거래 시 분석을 용이하게 하기 위해 생성되었습니다. HLC Bar는 Richard Wyckoff가 사용했으며 현재 "VSA" 작업에서 널리 사용됩니다. Wyckoff는 High, Low 및 Close를 사용하면 그래프가 훨씬 더 명확하고 분석하기 쉽다는 것을 발견했습니다. 표시기 "HLC_bar_MT5 Wyckoff"는 다음을 허용합니다. # 막대 너비를 변경합니다. # 막대를 같은 색으로 둡니다. # 그리고 같은 가격으로 열리고 닫힌 바를 강조 표시합니다. 색상과 너비는 설정에서 쉽게 수정할 수 있습니다. 지표를 사용하려면 차트로 끌어다 놓기만 하면 됩니다. Wyckoff는 볼륨과 함께 사용할 때 HLC 차트를 막대 그래프라고 불렀습니다.
Reverse side scalper
Ekaterina Saltykova
Reverse side scalper is the manual trading system, that works on choppy(anti-trend) market. As a rule markets are on 80% choppy and only 20% is trend phase. System is based on custom step Moving and RSI and reverse pattern. System defines up movement, down movement, trend / choppy phases. Indicator plots Buy signal arrow when current direction is down and phase is trend, Sell signal arrow is plotted when currently is up movement and phase is trend. As a rule it allows to "catch" local maximum/mi
이 표시기는 차트의 모든 주문에 대해 이미 설정한 TP 및 SL 값(해당 통화로)을 표시하여 모든 주문에 대한 손익을 추정하는 데 많은 도움이 됩니다(거래/주문 라인에 닫힘). 또한 PIP 값도 표시됩니다. 표시된 형식은 "이익 또는 손실 / PIP 값의 통화 값"입니다. TP 값은 녹색으로 표시되고 SL 값은 빨간색으로 표시됩니다.. 질문이나 자세한 내용은 fxlife.asia@hotmail.com  or  fxlife.asia@yahoo.com 으로 판매자에게 언제든지 문의하십시오. (그리고 곧 표시기에 추가될 다음 기능은 "자동 또는 반자동 TP 및 SL 설정"이며 고객은 무료로 업데이트 버전을 받을 것입니다. 감사합니다...) (또는 표시에 일부 기능을 추가해야 한다고 생각하시면 언제든지 말씀해 주십시오...)
MACD Color Histogram
German David Nino Cifuentes
The MACD Histogram   Indicator is a modernized version of the MACD indicator, designed to make it easier for traders to understand market trends and momentum shifts. Unlike the original MACD, this version includes a histogram, which is like a bar chart showing the difference between two lines: the MACD line and the signal line. Here's how it works: when the MACD line is higher than the signal line, it suggests that the market is bullish, and the histogram bars are shown in green. On the other ha
Strong Support mt5
Vasiliy Strukov
5 (9)
지원 및 저항 수준은 오랫동안 시장 분석을위한 강력한 도구였습니다. 강력한 지원 지표는 현지 가격 최소값을 기반으로 한 지원 수준과 현지 가격 최대값을 기반으로 한 저항 수준을 나타냅니다. 내 다른 개발은 여기에서 볼 수 있습니다 추세 표시기와 함께 사용하는 것이 좋습니다(예:금 물건)-추세에 따라 거래하고 동시에 통합 또는 추세 반전 영역을 결정할 수있을뿐만 아니라 정지 손실을 설정하고 지원 및 저항 수준에서 이익을 얻을 수 있습니다. 설정 및 개인 보너스를 받기 위해 구입 후 즉시 저에게 연락하십시오! 들어오는 매개 변수 - 이 표시기에는 복잡한 설정이 필요하지 않으며 주요 매개 변수는 색상 스케일 조정입니다. 지원 및 저항 수준은 오랫동안 시장 분석을위한 강력한 도구였습니다. 강력한 지원 지표는 현지 가격 최소값을 기반으로 한 지원 수준과 현지 가격 최대값을 기반으로 한 저항 수준을 나타냅니다. 내 다른 개발은 여기에서 볼 수 있습니다 추세 표
이 제품의 구매자들이 또한 구매함
우선 이 거래 시스템이 리페인팅, 리드로잉 및 레이그 인디케이터가 아니라는 점을 강조하는 것이 중요합니다. 이는 수동 및 로봇 거래 모두에 이상적인 것으로 만듭니다. "스마트 트렌드 트레이딩 시스템 MT5"은 새로운 및 경험이 풍부한 트레이더를 위해 맞춤형으로 제작된 종합적인 거래 솔루션입니다. 10개 이상의 프리미엄 인디케이터를 결합하고 7개 이상의 견고한 거래 전략을 특징으로 하여 다양한 시장 조건에 대한 다목적 선택이 가능합니다. 트렌드 추종 전략: 효과적인 트렌드 추이를 타기 위한 정확한 진입 및 손절 관리를 제공합니다. 반전 전략: 잠재적인 트렌드 반전을 식별하여 트레이더가 범위 시장을 활용할 수 있게 합니다. 스캘핑 전략: 빠르고 정확한 데이 트레이딩 및 단기 거래를 위해 설계되었습니다. 안정성: 모든 인디케이터가 리페인팅, 리드로잉 및 레이그가 아니므로 신뢰할 수 있는 신호를 보장합니다. 맞춤화: 개별 거래 선호도를 고려한 맞춤형 전략을 지원합니다. 최상의 전략을 찾는
Atomic Analyst MT5
Issam Kassas
5 (11)
우선적으로 언급할 점은이 거래 지표가 다시 그리지 않고 지연되지 않으며 이를 통해 수동 및 로봇 거래 모두에 이상적이라는 점입니다. Atomic Analyst는 가격의 강도와 모멘텀을 활용하여 시장에서 더 나은 이점을 찾는 PA Price Action Indicator입니다. 고급 필터를 장착하여 잡음과 거짓 신호를 제거하고 거래 잠재력을 높이는 데 도움이 됩니다. 복잡한 지표의 다중 레이어를 사용하여 Atomic Analyst는 차트를 스캔하고 복잡한 수학적 계산을 간단한 신호와 색상으로 변환하여 초보 트레이더가 이해하고 일관된 거래 결정을 내릴 수 있도록합니다. "Atomic Analyst"는 새로운 및 경험이 풍부한 트레이더를위한 종합적인 거래 솔루션입니다. 프리미엄 지표와 최고 수준의 기능을 하나의 거래 전략에 결합하여 모든 종류의 트레이더에 대한 다재다능한 선택지가되었습니다. 인트라데이 거래 및 스캘핑 전략 : 빠르고 정확한 일일 거래 및 단기 거래를 위해 설계
Quantum Trend Sniper
Bogdan Ion Puscasu
5 (37)
소개       Quantum Trend Sniper Indicator는   추세 반전을 식별하고 거래하는 방식을 변화시키는 획기적인 MQL5 지표입니다! 13년 이상의 거래 경험을 가진 숙련된 트레이더 팀이 개발한       Quantum Trend Sniper 표시기       매우 높은 정확도로 추세 반전을 식별하는 혁신적인 방법으로 거래 여정을 새로운 차원으로 끌어올리도록 설계되었습니다. ***Quantum Trend Sniper Indicator를 구입하면 Quantum Breakout Indicator를 무료로 받을 수 있습니다!*** Quantum Trend Sniper Indicator는 추세 반전을 식별하고 세 가지 이익실현 수준을 제안할 때 경고, 신호 화살표를 제공합니다. 초보자 거래자와 전문 거래자 모두에게 적합합니다. Quantum EA 채널:       여기를 클릭하세요 MT4 버전:       여기를 클릭하세요
FX Volume MT5
Daniel Stein
4.94 (17)
모닝 브리핑을 통해 세부 정보와 스크린샷으로 매일 시장 업데이트를 받으세요 여기 mql5 및 텔레그램에서 FX 거래량은 브로커의 관점에서 시장 심리에 대한 실제 통찰력을 제공하는 최초이자 유일한 거래량 지표입니다. 브로커와 같은 기관 시장 참여자가 외환 시장에서 어떤 포지션을 취하고 있는지에 대한 훌륭한 통찰력을 COT 보고서보다 훨씬 빠르게 제공합니다. 차트에서 이 정보를 직접 확인하는 것은 트레이딩의 진정한 판도를 바꾸고 획기적인 솔루션입니다. 다음과 같은 고유한 시장 데이터 인사이트의 이점 비율 는 통화의 매수/매도 포지션 비율을 백분율로 표시 비율 변화 는 선택한 기간 내 매수 비율과 비율 변화를 표시 총 거래량 는 해당 통화의 총 거래량(롱 및 숏)을 로트 단위로 보여줍니다 Volumes Long 는 해당 통화의 모든 롱 포지션의 거래량을 보여줍니다 Volumes Short 는 해당 통화의 모든 숏 포지션의 거래량을 보여줍니다 Net Long 는 순 롱 포지션의 거래량
Trend Screener Pro MT5
STE S.S.COMPANY
4.89 (61)
트렌드 표시기, 트렌드 트레이딩 및 필터링을 위한 획기적인 고유 솔루션, 하나의 도구 안에 내장된 모든 중요한 트렌드 기능! Forex, 상품, 암호 화폐, 지수 및 주식과 같은 모든 기호/도구에 사용할 수 있는 100% 다시 칠하지 않는 다중 시간 프레임 및 다중 통화 표시기입니다. Trend Screener는 차트에 점이 있는 화살표 추세 신호를 제공하는 효율적인 지표 추세 추종 지표입니다. 추세 분석기 표시기에서 사용할 수 있는 기능: 1. 트렌드 스캐너. 2. 최대 이익 분석이 있는 추세선. 3. 추세 통화 강도 측정기. 4. 경고가 있는 추세 반전 점. 5. 경고가 있는 강력한 추세 점. 6. 추세 화살표 Trend Screener Indicator가 있는 일일 분석 예, 일일 신호 성능...등은 여기에서 찾을 수 있습니다. 여기를 클릭하십시오. LIMITED TIME OFFER : Trend Screener Indicator는 50$ 및 평생 동안만 사용할 수 있습니다
FX Power MT5 NG
Daniel Stein
5 (4)
모닝 브리핑 여기 mql5 와 텔레그램에서 FX Power MT5 NG 는 오랫동안 인기 있는 통화 강도 측정기인 FX Power의 차세대 버전입니다. 이 차세대 강도 측정기는 무엇을 제공합니까? 기존 FX Power에서 좋아했던 모든 것 PLUS GOLD/XAU 강도 분석 더욱 정밀한 계산 결과 개별 구성 가능한 분석 기간 더 나은 성능을 위한 사용자 정의 가능한 계산 한도 특별 멀티더 많은 것을보고 싶은 사람들을위한 특별한 다중 인스턴스 설정 모든 차트에서 좋아하는 색상을위한 끝없는 그래픽 설정 수많은 알림 옵션, 중요한 것을 다시는 놓치지 않도록 Windows 11 및 macOS 스타일의 둥근 모서리가 있는 새로운 디자인 마법처럼 움직이는 인디케이터 패널 FX 파워 키 특징 모든 주요 통화의 완전한 강세 이력 모든 시간대에 걸친 통화 강세 이력 모든 브로커 및 차트에서 고유 계산 결과 100% 신뢰할 수있는 실시간100 % 신뢰할 수있는 실시간 계산-> 다시 칠하지 않음
Entry Points Pro for MT5
Yury Orlov
4.54 (157)
다시 색을 칠하지 않고 거래에 진입할 수 있는 정확한 신호를 제공하는 MT5용 지표입니다. 외환, 암호화폐, 금속, 주식, 지수 등 모든 금융 자산에 적용할 수 있습니다. 매우 정확한 추정값을 제공하고 매수와 매도의 가장 좋은 시점을 알려줍니다. 하나의 시그널로 수익을 내는 지표의 예와 함께 비디오 (6:22)시청하십시오! 대부분의 거래자는 Entry Points Pro 지표의 도움으로 첫 거래 주 동안 트레이딩 결과를 개선합니다. 저희의   Telegram Group 을 구독하세요! Entry Points Pro 지표의 좋은점. 재도색이 없는 진입 신호 신호가 나타나고 확인되면(시그널 캔들이 완성된 경우) 신호는 더 이상 사라지지 않습니다. 여타 보조지표의 경우 신호를 표시한 다음 제거되기 때문에 큰 재정적 손실로 이어집니다. 오류 없는 거래 게시 알고리즘을 통해 트레이드(진입 또는 청산)를 할 이상적인 순간을 찾을 수 있으며, 이를 통해 이를 사용하는 모든 거래자의
우선적으로, 이 거래 도구는 전문적인 거래에 이상적인 비-다시 그리기 및 지연되지 않는 지표입니다.  스마트 가격 액션 컨셉트 인디케이터는 신규 및 경험 많은 트레이더 모두에게 매우 강력한 도구입니다. Inner Circle Trader Analysis 및 Smart Money Concepts Trading Strategies와 같은 고급 거래 아이디어를 결합하여 20가지 이상의 유용한 지표를 하나로 결합합니다. 이 인디케이터는 스마트 머니 컨셉트에 중점을 두어 대형 기관의 거래 방식을 제공하고 이동을 예측하는 데 도움을 줍니다.  특히 유동성 분석에 뛰어나 기관이 어떻게 거래하는지 이해하는 데 도움을 줍니다. 시장 트렌드를 예측하고 가격 변동을 신중하게 분석하는 데 탁월합니다. 귀하의 거래를 기관 전략에 맞추어 시장의 동향에 대해 더 정확한 예측을 할 수 있습니다. 이 인디케이터는 시장 구조를 분석하고 중요한 주문 블록을 식별하고 다양한 패턴을 인식하는 데 뛰어납니다. 
RelicusRoad Pro MT5
Relicus LLC
4.82 (22)
이제 $ 147 (몇 가지 업데이트 후 $ 499 증가) - 무제한 계정 (PCS 또는 MACS) RelicusRoad 사용 설명서 + 교육 비디오 + 비공개 Discord 그룹 액세스 + VIP 상태 시장을 보는 새로운 방법 RelicusRoad는 외환, 선물, 암호화폐, 주식 및 지수에 대한 세계에서 가장 강력한 거래 지표로서 거래자에게 수익성을 유지하는 데 필요한 모든 정보와 도구를 제공합니다. 우리는 초보자부터 고급까지 모든 거래자가 성공할 수 있도록 기술적 분석 및 거래 계획을 제공합니다. 미래 시장을 예측할 수 있는 충분한 정보를 제공하는 핵심 거래 지표입니다. 우리는 차트에서 말이 안 되는 여러 지표 대신 완전한 솔루션을 믿습니다. 타의 추종을 불허하는 매우 정확한 신호, 화살표 + 가격 조치 정보를 표시하는 올인원 표시기입니다. 강력한 AI를 기반으로 하는 RelicusRoad는 누락된 정보와 도구를 제공하여 교육하고 성공적인 트레이더인 트레이딩 전문
Auto Order Block with break of structure based on ICT and Smart Money Concepts Futures Break of Structure ( BoS )             Order block ( OB )            Higher time frame Order block / Point of Interest ( POI )    shown on current chart           Fair value Gap ( FVG ) / Imbalance   ,  MTF      ( Multi Time Frame )    Volume Imbalance     ,  MTF          vIMB Gap’s Equal High / Low’s     ,  MTF             EQH / EQL Liquidity               Current Day High / Low           HOD /
AW Trend Predictor MT5
AW Trading Software Limited
4.76 (55)
하나의 시스템에서 추세와 고장 수준의 조합입니다. 고급 지표 알고리즘은 시장 노이즈를 필터링하고 추세, 진입점 및 가능한 출구 수준을 결정합니다. 표시기 신호는 통계 모듈에 기록되어 가장 적합한 도구를 선택하여 신호 기록의 효율성을 보여줍니다. 이 표시기는 이익 실현 및 손절매 표시를 계산합니다. 매뉴얼 및 지침 ->   HERE   / MT4 버전 ->   HERE 지표로 거래하는 방법: Trend Predictor로 거래하는 것은 3단계로 간단합니다. 1단계 - 포지션 열기 70% 이상의 성공률로 매수 신호를 받았습니다. 2단계 - StopLoss 결정 반대 신호로 트렁크 선택 3단계 - 이익 실현 전략 정의 전략 1: TP1 도달 시 전체 포지션 청산 전략 2: TP1 도달 시 포지션의 50% 청산 및 TP2 도달 시 나머지 50% 청산 전략 3: 추세 반전 시 전체 포지션 청산 이익: 결과를 다시 그리지 않음, 신호는 엄격하게 양초가 닫힐 때 어드바이저에서 사용할 수 있습니
ICT, SMC, SMART MONEY CONCEPTS, SMART MONEY, Smart Money Concept, Support and Resistance, Trend Analysis, Price Action, Market Structure, Order Blocks, BOS/CHoCH,   Breaker Blocks ,  Momentum Shift,   Supply&Demand Zone/Order Blocks , Strong Imbalance,   HH/LL/HL/LH,    Fair Value Gap, FVG,  Premium  &   Discount   Zones, Fibonacci Retracement, OTE, Buy Side Liquidity, Sell Side Liquidity, BSL/SSL Taken, Equal Highs & Lows, MTF Dashboard, Multiple Time Frame, BigBar, HTF OB, HTF Market Structure
ON Trade Gann Squares MT5
Abdullah Alrai
5 (1)
간 스퀘어 지표는 W.D. 간이 쓴 "시장 예측을 위한 수학적 공식" 기사에 기반한 강력한 시장 분석 도구입니다. 이 도구는 수학적 개념과 간 이론을 사용하여 정확한 시장 분석을 수행합니다. 144, 90, 52의 제곱과 9의 제곱을 사용합니다. 또한 의 9의 제곱근 및 해당 제곱의 채널 및 스타 패턴과의 관련성을 통합합니다. 사용자 메뉴얼 및 적용: 이 지표를 사용하기 전에 사용자 메뉴얼을 읽고 질문이 있을 경우 문의하시기 바랍니다. 전체 메뉴얼은 웹사이트에서 제공됩니다. MT5의 전체 버전을 구매하거나 MT4의 무료 버전을 테스트할 수 있습니다. 두 버전 모두 링크에서 확인하실 수 있습니다. 주요 기능 및 기능: 간 스퀘어 지표는 정확한 결정을 위해 기하학적 개념과 간 이론을 활용하는 시장 분석을 위한 포괄적인 도구 집합을 제공합니다. 주요 기능은 다음과 같습니다. 9의 제곱 분석:   이 지표는 9의 제곱에 대한 수평 선, 스타 패턴, 그리드 및 간 팬을 그릴 수 있습니다. 간
TPSproTREND PrO MT5
Roman Podpora
5 (5)
TPSpro TRENDPRO  - is a trend indicator that automatically analyzes the market and provides information about the trend and each of its changes, as well as giving signals for entering trades without redrawing! The indicator uses each candle, analyzing them separately. referring to different impulses - up or down impulse. Exact entry points into transactions for currencies, crypto, metals, stocks, indices!  -  Version MT4                  DETAILED DESCRIPTION        /       TRADING SETUPS       
Advanced Supply Demand MT5
Bernhard Schweigert
4.53 (15)
현재 33% 할인! 초보자나 전문 트레이더를 위한 최고의 솔루션! 이 보조지표는 우리가 다수의 독창적 기능과 새로운 공식을 통합한 독특하고 고품질이며 저렴한 거래 도구입니다. 이 업데이트를 통해 이중 시간대를 표시할 수 있습니다. 더 높은 TF를 표시할 수 있을 뿐만 아니라 차트 TF와 더 높은 TF 모두를 표시할 수 있습니다: 중첩 영역 표시. 모든 Supply Demand 트레이더들이 좋아할 것입니다. :) 중요한 정보 공개 Advanced Supply Demand의 잠재력을 극대화하려면 다음을 방문하십시오. https://www.mql5.com/ko/blogs/post/720245   진입 또는 목표의 명확한 트리거 포인트를 정확히 찾아냄으로 해서 거래가 어떻게 개선될지 상상해 보십시오. 새로운 알고리즘을 기반으로 매수자와 매도자 간의 잠재적인 불균형을 훨씬 더 쉽게 분간할 수 있습니다. 왜냐하면 가장 강한 공급영역과 가장 강한 수요 영역과 과거에 어떻게 진행 되었는지를(이
차트에 지지 및 저항 수준과 추진 캔들 갭을 자동으로 그려주므로 다음 가격 방향 및/또는 잠재적 반전 가능성을 확인할 수 있습니다. 이 보조지표는 제 웹사이트(시장 구조 트레이더)에서 가르치는 포지션 트레이딩 방법론의 일부로 사용하도록 설계되었으며 타겟팅 및 잠재적 진입을 위한 주요 정보를 표시합니다. MT4 Version:  https://www.mql5.com/en/market/product/97246/ 이 보조지표에는 2가지 핵심 기능과 4가지 추가 기능이 있습니다: 핵심 기능 1 - 일일, 주간 및 월간 시간대의 자동 지지선 및 저항선 이 인디케이터는 지난 2일에서 최대 6주 및 몇 달 전의 가장 최근 지원 및 저항 수준을 자동으로 가져옵니다. 이러한 레벨의 모양을 원하는 대로 완전히 사용자 지정하고 표시되는 레벨 수를 표시할 수 있습니다. 이러한 주요 레벨은 종종 가격이 하락하거나 반전되는 주요 지지 및 저항 구간으로 작용합니다. 또한 가격이 향할 목표가 되기도 하므로
TPSpro RFI Levels MT5
Roman Podpora
5 (5)
A key element in trading is zones or levels from which decisions to buy or sell a trading instrument are made. Despite attempts by major players to conceal their presence in the market, they inevitably leave traces. Our task was to learn how to identify these traces and interpret them correctly. Reversal First Impulse levels (RFI)   -  Version MT4                  INSTRUCTIONS                 RUS                 ENG                         R ecommended to use with an indicator   -  TREND PRO  
가격이 역전되고 후퇴함에 따라 시장 구조가 변경됩니다. 시장 구조 반전 경고 표시기는 추세 또는 가격 움직임이 고갈에 가까워지고 반전할 준비가 되었음을 식별합니다. 일반적으로 반전이나 큰 하락이 일어나려고 할 때 발생하는 시장 구조의 변화를 알려줍니다. 지표는 가능한 고갈 지점 근처에서 새로운 고점 또는 저점이 형성될 때마다 초기에 돌파와 가격 모멘텀을 식별합니다. 표시기는 반대쪽에 있는 마지막 촛불에 직사각형을 그립니다. 그런 다음 현재의 단기 추세에서 계속 움직이기 때문에 가격과 함께 직사각형을 따라갈 것입니다. 가격이 사각형 위나 아래로 다시 닫힐 정도로 약해지면 시장 구조에 잠재적인 변화가 일어나고 있음을 나타냅니다. 그런 다음 표시기는 방향의 잠재적인 이동과 추세 또는 주요 하락의 가능한 반전 시작에 대해 경고합니다. 작동 방식을 보려면 아래의 작동 표시기를 참조하십시오! 모든 쌍 및 주요 기간을 모니터링하는 대시보드: https://www.mql5.com/
소개       Quantum Breakout PRO   , 브레이크아웃 존 거래 방식을 변화시키는 획기적인 MQL5 지표! 13년 이상의 거래 경험을 가진 숙련된 트레이더 팀이 개발한       퀀텀 브레이크아웃 PRO       혁신적이고 역동적인 브레이크아웃 존 전략으로 거래 여정을 새로운 차원으로 끌어올리도록 설계되었습니다. Quantum Breakout Indicator는 5개의 이익 목표 영역이 있는 브레이크아웃 영역의 신호 화살표와 브레이크아웃 상자를 기반으로 한 손절 제안을 제공합니다. 초보자 거래자와 전문 거래자 모두에게 적합합니다. Quantum EA 채널:       여기를 클릭하세요 중요한! 구매 후 설치 매뉴얼을 받으려면 개인 메시지를 보내주십시오. 추천: 기간: M15 통화쌍: GBPJPY, EURJPY, USDJPY,NZDUSD, XAUUSD 계정 유형: 스프레드가 매우 낮은 ECN, Raw 또는 Razor 브로커 시간: GM
TrendLine PRO MT5
Evgenii Aksenov
4.78 (49)
The Trend Line PRO indicator is an independent trading strategy. It shows the trend change, the entry point to the transaction, as well as automatically calculates three levels of Take Profit and Stop Loss protection Trend Line PRO is perfect for all Meta Trader symbols: currencies, metals, cryptocurrencies, stocks and indices Advantages of Trend Line PRO Never redraws its signals The possibility of using it as an independent strategy It has three automatic levels Take Profit and Stop Loss lev
XQ Indicator MetaTrader 5
Marzena Maria Szmit
5 (1)
Step into the realm of Forex trading with confidence and precision using XQ, a cutting-edge Forex indicator designed to elevate your trading game to unprecedented heights. Whether you're a seasoned trader or just stepping into the world of currency exchange, XQ Forex Indicator empowers you with the insights and signals needed to make informed trading decisions. The signal conditions are a combination of three indicators, and XQ Forex Indicator only display  medium and long-term trends . The ind
Trend Line Map Pro MT5
STE S.S.COMPANY
4.67 (9)
트렌드 라인 맵 표시기는 트렌드 스크리너 표시기의 애드온입니다. Trend screener(Trend Line Signals)에 의해 생성된 모든 신호에 대한 스캐너로 작동합니다. Trend Screener Indicator 기반의 Trend Line Scanner입니다. Trend Screener Pro 표시기가 없으면 Trend Line Map Pro가 작동하지 않습니다. It's a Trend Line Scanner based on Trend Screener Indicator. If you don't have Trend Screener Pro Indicator,     the Trend Line Map Pro will not work . MQL5 블로그에 액세스하여 추세선 지도 표시기의 무료 버전을 다운로드할 수 있습니다. Metatrader Tester 제한 없이 구매하기 전에 사용해 보십시오. : 여기를 클릭하세요 1. 쉽게 얻을 수 있는 이점 통화 및
TrendDecoder Premium MT5
Christophe, Pa Trouillas
5 (1)
이제 메타트레이더에서 사용 가능 범위 및 다음 가능한 움직임 식별       |      추세의 초기 신호와 강도를 확인하세요       |      반전 전 명확한 출구 확보       |      가격이 테스트 할 피보 레벨 파악 비추적, 비지연 지표 - 수동 및 자동 거래에 이상적 - 모든 자산 및 모든 시간 단위에 적합 - 출시 시 50% 할인   - 이후 >> $149로 복귀 구매 후   이 채널로 문의 하여 권장 설정을 확인하세요. MT4 버전:   여기를 클릭하세요 BladeSCALPER 및 PowerZONES 로 전체 방법을 확인하세요. 어떤 서비스인가요? 트렌드디코더는 추세 모니터링을 간단하고 쉽게 하기 위한 여러 혁신 기술의 집약체입니다. 투영 추세선(투영 추세선)   - 다가오는 추세의 속도 기준 실시간 추세선과 투영 추세선 비교   - 시장이 이전과 같은 방향으로 움직이고 있는지, 아니면 둔화되고 있는지? 실시간 추세선 교차   - 추세가 궤
MetaBands M5
Vahidreza Heidar Gholami
4.67 (3)
MetaBands uses powerful and unique algorithms to draw channels and detect trends so that it can provide traders with potential points for entering and exiting trades. It’s a channel indicator plus a powerful trend indicator. It includes different types of channels which can be merged to create new channels simply by using the input parameters. MetaBands uses all types of alerts to notify users about market events. Features Supports most of the channel algorithms Powerful trend detection algorith
Malaysian SNR Levels
Matthias Horst Pieroth
This indicator can be used to display Support and Resistance levels according to  the  Malaysian SNR concept , in which Support and Resistance are exact levels of a line chart. Malaysian SNR There are 3 different horizontal levels in Malaysian SNR: A-Level : This level is located at the peak of this line chart. (shape looks like the letter A) V-Level : Level at the valley of a line chart, (shape looks like the letter V) Gap-Leve l: This level is located at the Close/Open gap between two cand
Volume by Price MT5
Brian Collard
5 (3)
The Volume by Price Indicator for MetaTrader 5 features Volume Profile and Market Profile TPO (Time Price Opportunity). Get valuable insights out of currencies, equities and commodities data. Gain an edge trading financial markets. Volume and TPO histogram bar and line charts. Volume Footprint charts. TPO letter and block marker charts including split structures. Versatile segmentation and compositing methods. Static, dynamic and flexible ranges with relative and/or absolute visualizations. Lay
Account Graph MT5
Kyra Nickaline Watson-gordon
5 (1)
An indicator to draw a graph of account current and historical state such as Balance, Equity, Margin, Free Margin, Margin Level, Drawdown, Account Profit, Deposit and Withdrawals. Indicator Inputs : Draw Balance Graph Draw Equity Graph Draw Margin Graph Draw Free Margin Graph Draw Margin Level Graph Draw Drawdown Graph Draw Account Profit Graph Hide Data on Chart and Buffers Connect Gaps by Lines Sign of DDs on Profit Sign of DDs on Loss Tips : The Indicator will draw historical balance gra
TPA True Price Action indicator reveals the true price action of the market makers through 100% non-repainting signals strictly at the close of a candle! TPA shows entries and re-entries, every time the bulls are definitely stronger than the bears and vice versa. Not to confuse with red/green candles. The shift of power gets confirmed at the earliest stage and is ONE exit strategy of several. There are available now two free parts of the TPA User Guide for our customers. The first "The Basics"
IX Power MT5
Daniel Stein
5 (2)
IX Power는   마침내 FX Power의 탁월한 정밀도를 외환이 아닌 기호에도 적용했습니다. 좋아하는 지수, 주식, 원자재, ETF, 심지어 암호화폐까지 단기, 중기, 장기 추세의 강도를 정확하게 파악할 수 있습니다. 단말기가 제공하는   모든 것을 분석할   수 있습니다. 사용해 보고 트레이딩   타이밍이 크게 향상되는   것을 경험해 보세요. IX Power 주요 특징 단말기에서 사용 가능한 모든 거래 심볼에 대해 100% 정확한 비재도장 계산 결과 제공 사전 구성 및 추가적으로 개별 구성 가능한 강도 분석 기간의 드롭다운 선택 가능 이메일, 메시지, 모바일 알림을 통한 다양한 알림 옵션 제공 EA 요청을 위한 액세스 가능한 버퍼 더 나은 성능을 위한 사용자 지정 가능한 계산 한도 더 많은 것을 보고 싶은 사용자를 위한 특별 다중 인스턴스 설정 모든 차트에서 좋아하는 색상을 위한 무한한 그래픽 설정 가능 Windows 11 및 macOS 스타일의 둥
Owl Smart Levels MT5
Sergey Ermolov
4.47 (36)
MT4 버전  |  FAQ Owl Smart Levels Indicator 는 Bill Williams 의 고급 프랙탈, 시장의 올바른 파동 구조를 구축하는 Valable ZigZag, 정확한 진입 수준을 표시하는 피보나치 수준과 같은 인기 있는 시장 분석 도구를 포함하는 하나의 지표 내에서 완전한 거래 시스템입니다. 시장과 이익을 취하는 장소로. 전략에 대한 자세한 설명 표시기 작업에 대한 지침 고문-거래 올빼미 도우미의 조수 개인 사용자 채팅 ->구입 후 나에게 쓰기,나는 개인 채팅에 당신을 추가하고 거기에 모든 보너스를 다운로드 할 수 있습니다 힘은 단순함에 있습니다! Owl Smart Levels 거래 시스템은 사용하기 매우 쉽기 때문에 전문가와 이제 막 시장을 연구하고 스스로 거래 전략을 선택하기 시작한 사람들 모두에게 적합합니다. 전략 및 지표에는 눈에 보이지 않는 비밀 공식 및 계산 방법이 없으며 모든 전략 지표는 공개되어 있습니다. Owl Smart Levels를
제작자의 제품 더 보기
To download MT4 version please click here . - This is the exact conversion from TradingView: "Linear Regression Candles" By "ugurvu". - The overall look of the indicator is like Heiken Ashi. - It can be used as a trend confirmation indicator to detect the right trend direction. - This indicator lets you read the buffers for Candles' OHLC. - This is a non-repaint and light processing load indicator - You can message in private chat for further changes you need. Thanks
To get access to MT5 version please click here . This is the exact conversion from TradingView: "Supertrend" by " KivancOzbilgic ". This is a light-load processing and non-repaint indicator. Highlighter option isn't available in MT4 version. You can message in private chat for further changes you need. Here is the source code of a simple Expert Advisor operating based on signals from  Supertrend . #property strict input string EA_Setting= "" ; input int magic_number= 1234 ; input double fixed_lo
To get access to MT4 version please click here . This is the exact conversion from TradingView: "Supertrend" by " KivancOzbilgic ". This is a light-load processing and non-repaint indicator. You can message in private chat for further changes you need. Here is the source code of a simple Expert Advisor operating based on signals from  Supertrend . #include <Trade\Trade.mqh> CTrade trade; int handle_supertrend= 0 ; input group "EA Setting" input int magic_number= 123456 ; //magic number input dou
To download MT5 version please click here . - This is the exact conversion from TradingView: "Linear Regression Candles" By "ugurvu". - This is a non-repaint and light processing load indicator - You can message in private chat for further changes you need. This is a sample EA code that operates based on bullish and bearish linear regression candles . #property strict input string EA_Setting= "" ; input int magic_number= 1234 ; input string     Risk_Management= "" ; input double fixed_lot_size=
B Xtrender
Yashar Seyyedin
5 (1)
To download MT4 version please click here . This is the exact conversion from TradingView: "B-Xtrender" By "QuantTherapy". - It is an oscillator based on RSI and multiple layers of moving averages. -   It is a two in one indicator to calculate overbought and oversold zones for different RSI settings. -  This indicator lets you read the buffers for all data on the window. - This is a non-repaint and light processing load indicator. - You can message in private chat for further changes you need.
To get access to MT5 version please click here . This is the exact conversion from TradingView: "SwingArm ATR Trend Indicator" by " vsnfnd ". Also known as : "Blackflag FTS" by "Jose Azcarate" This is a light-load processing and non-repaint indicator. All input options are available except multi time frame Buffers are available for processing in EAs. Extra option to show buy and sell signal alerts. You can message in private chat for further changes you need.
To get access to MT5 version please click here . - This is the exact conversion from TradingView: "Stochastic Momentum Index" By "UCSgears". - This is a popular version of stochastic oscillator on tradingview. - This is a light-load processing and non-repaint indicator. - Buffers are available for the lines on chart. - You can message in private chat for further changes you need. Thanks for downloading
To get access to MT5 version please contact via private message. This is the exact conversion from TradingView:Nadaraya-Watson Envelope" by " LuxAlgo ". This is not a light-load processing indicator. It is a REPAINT indicator. All input options are available.  Buffers are available for processing in EAs. You can message in private chat for further changes you need. Thanks.
To get access to MT5 version please click here . This is the exact conversion from TradingView:"HIGH AND LOW Optimized Trend TrackerHL OTT" by "kivancozbilgic" This is a light-load processing indicator. It is a non-repaint indicator. Colored Candle and Highlighting options are not available. Buffers are available for processing in EAs. You can message in private chat for further changes you need. Thanks.
Hull Suite By Insilico
Yashar Seyyedin
5 (1)
To get access to MT4 version please click here . - This is the exact conversion from TradingView: "Hull Suite" By "Insilico". - This is a light-load processing and non-repaint indicator. - You can message in private chat for further changes you need. Here is the source code of a simple Expert Advisor operating based on signals from  Hull Suite . #include <Trade\Trade.mqh> CTrade trade; int handle_hull= 0 ; input group "EA Setting" input int magic_number= 123456 ; //magic number input double fixe
This is the Chandelier Exit trend indicator applied to heiken ashi candles based on "G TREND GUNBOT" by "LUIS_GANDATA_G_TREND" on tradingview. Heiken ashi candles filter out many of the chops and therefore as an input to Chandelier Exit you achieve well filtered Buy and Sell signals. Also you can choose to apply the trend indicator to normal candles via input tab. (two in one indicator) This is a non-repaint and light processing load indicator. You can message in private chat for further change
FREE
Volume Oscillator
Yashar Seyyedin
To download MT4 version please click here . The Volume Oscillator measures volume by analyzing the relationship between two Moving Averages. The Volume Oscillator indicator subtracts a fast MA from slow MA. The fast and slow MA periods are configurable via input tab. Volume indicators are an ingredient of trading systems to avoid entry in thin liquidity markets. Having set a threshold on Volume Oscillator you can avoid entering chop. Buffers are available to access via EA.
FREE
GoldTrader
Yashar Seyyedin
Please backtest with the exact balance of your live account before applying to real money. ==> If account balance is too low it may not trade at all! For MT4 version please contact via private message. martingale version is available here . Strategy description - Detect trend based on EMA18-EMA50-SMA200 alignment in three time frames: M15, H1, H4 - Trade in trend direction and exit when above alignment is broken. - The bot is tuned to trade XAUUSD(Gold). - The bot output is break even in rangi
FREE
Please backtest with the exact balance of your live account before applying to real money. ==> If account balance is too low it may not trade at all! For MT4 version please contact via private message. Strategy description - Detect trend based on GoldTrader rules. - Enter in both direction as much as needed to achieve acceptable amount of profit. - Although this is a martingale bot it is very unlikely to loose your money, because: ==> the money management rules are safe and low risk. ==> entries
FREE
To download MT5 version please click here . This is the exact conversion from TradingView: "B-Xtrender" By "QuantTherapy". - It is an oscillator based on RSI and multiple layers of moving averages. -   It is a two in one indicator to calculate overbought and oversold zones for different RSI settings. -  This indicator lets you read the buffers for all data on the window. - This is a non-repaint and light processing load indicator. - You can message in private chat for further changes you need.
To get access to MT5 version please click here . - This is a conversion from TradingView: "Hull Suite" By "Insilico". - This is a light-load processing and non-repaint indicator. - You can message in private chat for further changes you need. note: Color filled areas and colored candles are not supported in MT4 version. Here is the source code of a simple Expert Advisor operating based on signals from  Hull Suite . #property strict input string EA_Setting= "" ; input int magic_number= 1234 ; inp
To get access to MT5 version please click here . - This is the exact conversion from TradingView: "Twin Range Filter" by " colinmck ". - This is a light-load processing and non-repaint indicator. - All input options are available.  - Buffers are available for processing in EAs. - You can message in private chat for further changes you need. Thanks for downloading
To download MT5 version please click  here . The Volume Oscillator measures volume by analyzing the relationship between two Moving Averages. The Volume Oscillator indicator subtracts a fast MA from slow MA. The fast and slow MA periods are configurable via input tab. Volume indicators are an ingredient of trading systems to avoid entry in thin liquidity markets. Having set a threshold on Volume Oscillator you can avoid entering chop. Buffers are available to access via EA.
FREE
IntradayTrader
Yashar Seyyedin
This Expert is developed to optimize parameters to trade intraday trending markets. Simply use optimization to find the proper inputs for specific symbol you are interested in.  This is a light load EA from processing point of view. You can easily run this on several charts simultaneously. Make sure to set a different magic number for each. note: The screenshot shows a 12% profitability in EURUSD for a period of a year and 2% draw-down using optimization to find best inputs.
FREE
Vortex Indicator
Yashar Seyyedin
To download MT4 version please click here . - This is vortex indicator. - It is used to detect trend strength and direction. - It consists of two line(buffers). ==> VIM and VIP - There are three types of signals related to this indicator: 1. crossing VIM and VIP 2. threshold on distance between VIP and VIM 3. VIP above VIM vice versa. - This is a non-repaint indicator with light processing.
FREE
Choppy Trader
Yashar Seyyedin
This Expert is developed to optimize parameters to trade in choppy markets. Simply use optimization to find the proper inputs for specific symbol you are interested in.  This is a light load EA from processing point of view. You can easily run this on several charts simultaneously. Make sure to set a different magic number for each. note: The screenshot shows a 20% profitability in USDCAD for a period of 4-months and 5% draw-down using optimization to find best inputs.
FREE
Full Pack Moving Average
Yashar Seyyedin
4 (2)
To download MT4 version please click here . Metatrader users are limited to few moving average types. Therefor I decided to create a package consisting of all MAs I knew. This package suggests 12 different types: { SMA, EMA, DEMA, TEMA, WMA, VWMA, SMMA(RMA), HullMA, LSMA, ALMA, SSMA, TMA } You can configure them via input tab. This is a non-repaint indicator with light load. To implement them I referred to standard  libraries of pine script.
FREE
I do not have the exact indicator for MT4 but the nearest possible look alike can be downloaded from here . Also you may check this link . This is the exact conversion from TradingView: "Donchian Trend Ribbon" By "LonesomeTheBlue". One of the coolest indicators out there to detect trend direction and strength. As a trader you always need such indicator to avoid getting chopped in range markets. There are ten buffers as colors to use in EAs also. The indicator is loaded light and non-repaint. Not
To get access to MT5 version please contact via private message. This is the exact conversion from TradingView: " Better RSI with bullish / bearish market cycle indicator" by TradeCalmly. This is a light-load processing and non-repaint indicator. All input options are available.  Buffers are available for processing in EAs. You can message in private chat for further changes you need.
To get access to MT4 version please click here . - This is the exact conversion from TradingView: "Range Identifier" By "Mango2Juice". - All twelve averaging options are available:  EMA, DEMA, TEMA, WMA, VWMA, SMA, SMMA, RMA, HMA, LSMA, Kijun, McGinley - This is a light-load processing and non-repaint indicator. - Buffer is available for the main line on chart and not for thresholds.  - You can message in private chat for further changes you need.
To get access to MT5 version please click   here . This is the exact conversion from TradingView: "Hammer & ShootingStar Candle Detector" by "MoriFX". This is a light-load processing and non-repaint indicator. All input options are available.  Buffers are available for processing in EAs. You can message in private chat for further changes you need. Thanks.
FREE
To download MT4 version please click here . This is the exact conversion from TradingView: "RSI versus SMA" By "JayRogers". This indicator lets you read the buffers for all Lines on chart.  Note: This is an indicator, Not an expert. Meaning It does not take trades. If you want the EA please contact via message. You can easily use the indicator to understand the logic behind trades that the TradingView strategy takes. The strategy is profitable if this indicator is applied to the right symbol at
FREE
- This is the exact conversion from TradingView: " 200-EMA Moving Average Ribbon" By "Dale_Ansel". - This indicator plots a series of moving averages to create a "ribbon" that offers a great visual structure to price action. - This indicator lets you read buffers. For information on buffers please contact via message. - This is a non-repaint and light processing load indicator
FREE
To download MT5 version please click here . - This is vortex indicator. - It is used to detect trend strength and direction. - It consists of two line(buffers). ==> VIM and VIP - There are three types of signals related to this indicator: 1. crossing VIM and VIP 2. threshold on distance between VIP and VIM 3. VIP above VIM vice versa. - This is a non-repaint indicator with light processing.
FREE
MacroTrendTrader
Yashar Seyyedin
This is MacroTrendTrader. It trades in DAILY time frame even if you run it on lower time frames. It opens/closes trades once per day at a specific time that you choose via input tab: - "param(1-5)" are optimization parameters. - "Open/Close Hour" is set via input tab. Make sure to choose this to be away from nightly server shutdown. - "high risk" mode if chosen, sets a closer stop loss level. Therefore higher lot sizes are taken.  This is a light load EA from processing point of view. Calculatio
FREE
필터:
리뷰 없음
리뷰 답변
버전 1.10 2024.03.09
Added full options for source: median, weighted and typical prices.