• 미리보기
  • 리뷰 (5)
  • 코멘트 (5)
  • 새 소식

Golden Hunter MT4

4

$75에 마지막 사본 ---> 다음: $99 !!!  MT5 버전

Golden Hunter는 수동으로 시장을 거래하는 트레이더를 위해 개발되었습니다. 3가지 지표로 구성된 매우 강력한 도구입니다.

  1. 강력한 진입 전략: 통화 쌍의 변동성을 측정하고 시장 추세를 식별하는 지표로 구성됩니다.
  2. LSMA: 가격 데이터를 평활화하고 단기 추세 파악에 유용합니다.
  3. Heikin Ashi: 지표가 차트에 연결되면 일본 캔들은 Heikin Ashi 캔들로 변경됩니다. 이러한 유형의 양초는 가격 정보를 부드럽게 하여 강력한 추세를 파악할 수 있도록 합니다.

형질

다시 칠하지 마십시오
이 표시기는 새 데이터가 도착해도 값을 변경하지 않습니다
스프레드가
매우 낮고 변동성이 큰 거래 쌍(EURUSD, GBPUSD, BTCUSD…). 범위(범위) 쌍을 사용하는 것은 권장되지 않습니다
기간
M5
거래
시간 시장에서 더 많은 움직임이 있고 스프레드가 낮은 시간대에 거래하는 것이 좋습니다
 

요구 사항

스프레드가 좁은 ECN 브로커를 사용하여 포지션을 스캘핑하는 것은 필수입니다.


설치하는 방법

선호하는 거래 쌍(M5 시간 프레임)에 지표를 첨부하십시오.


환경

기본 설정은 5분 동안 내가 찾은 가장 효과적인 설정입니다.

거래 양식에 가장 적합한 구성을 사용할 수 있습니다.


사용하는 방법

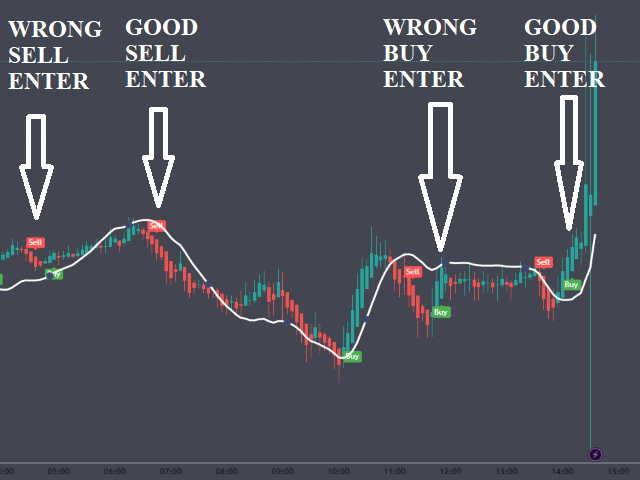
사용법은 매우 간단합니다(사진에 설명되어 있음): 지표는 가격이 움직일 때 매수 및 매도 신호를 표시합니다.
  1. 신호(화살표)가 흰색 선 위에 있을 때만 매수 포지션을 열어야 합니다.
  2. 신호(화살표)가 흰색 선 아래에 있을 때만 짧은 위치를 열어야 합니다.
언제 거래를 청산해야 합니까?: 두 가지 방법을 사용할 수 있습니다.
  1. 양초가 흰색 선을 넘을 때.
  2. 지지선과 저항선을 그리는 추가 표시기를 사용하여 지지선과 저항선에 모두 도달하면 작업을 종료합니다. (향후 업데이트에서 이 기능을 지표에 추가하려고 합니다.)


경고
MQL5.com에서만 EA를 판매합니다. 누군가가 내 EA를 판매하기 위해 귀하에게 연락한다면 그들은 귀하의 돈을 원하는 사기꾼입니다.

또한 외부 웹사이트에서 내 EA를 구입하면 가짜 버전이 될 것이며 원본과 동일하게 작동하지 않을 것임을 확신합니다.


리뷰 5
lauro1956
2912
lauro1956 2023.02.20 11:12 
 

Buenos dias Sr. Arana Buen indicador, ya se que usted recomienda M5... pero veo que tampoco es mala opcion H1

Aunque usted no lo esté recomendando de esta forma.... me podría por favor dar una hipotética configuración para H1... sin que sirva de precedente.

Muchas gracias

feichkop
49
feichkop 2023.02.10 20:32 
 

This is an amazing indicator, awesome results so far, hopefully it continues.

Natalija3107
288
Natalija3107 2023.01.20 20:12 
 

This indicator is the best I have ever seen. Amazing precision. Perfectly accurate

추천 제품
The indicator displays the data of the Stochastic oscillator from a higher timeframe on the chart. The main and signal lines are displayed in a separate window. The stepped response is not smoothed. The indicator is useful for practicing "manual" forex trading strategies, which use the data from several screens with different timeframes of a single symbol. The indicator uses the settings that are identical to the standard ones, and a drop-down list for selecting the timeframe. Indicator Parame
30 USD
Download the free version here. Divergence Divergence refers to when the price of a currency pair moves in one direction while the trend indicator is moving in the opposite direction. With divergence, there can be positive and negative signals. Divergences in Forex trading are quite common signals of technical analysis. These are basic early Forex signals indicating the trend reversal and filter false signals. Application of this indicator It is usually not easy to detect divergences by the t
30 USD
Power Renko MT4
Pierce Vallieres
Power Renko is an indicator which plots Renko bricks underneath the chart using a histogram. You can select the brick size and the timeframe of the Renko bricks as well as whether or not to use the close price or the high/low price of the candles. Renko bricks are based on price alone, not time, therefor the Renko bricks will not be aligned with the chart's time. They are extremely useful for trend trading and many different strategies can be formed from them. Buffers are provided allowing you t
30 USD
Trade with Gann on your side!! MASTER CIRCLE 360 CIRCLE CHART, originally created by Gann admitted that this is “The Mother of all charts”. It is one of the last studies that this great trader left for us. The numeric tab le is apparently quite simple like all the tables and is based on square numbers, the SQUARE OF 12 and is by evolution, one of the most important square numbers. Here we can find CYCLE, PRICE AND TIME thanks to angles and grades, to show past and future support and resistance.
149.99 USD
Noize Absorption Index - is the manual trading system that measures the difference of pressure between bears forces and bulls forces. Green line - is a noize free index that showing curent situation. Zero value of index shows totally choppy/flat market.Values above zero level shows how powerfull bullish wave is and values below zero measures bearish forces.Up arrow appears on bearish market when it's ready to reverse, dn arrow appears on weak bullish market, as a result of reverse expectation. S
199 USD
BreakEven Line is a very useful and easy to use indicator. In case of multiple positions opened on the same instrument, the indicator shows the breakeven point where it is possible to close the positions. Its graphic simplicity makes it an unobtrusive and customizable tool. You can enable/disable a line on a chart, so you can make the indicator invisible. Inputs Show cumulative BE (line on/off) Breakeven line color (to change the line color) Breakeven line style Breakeven line width Show short B
30 USD
Trendiness Index
Libertas LLC
5 (3)
"The trend is your friend" is one of the best known sayings in investing, because capturing large trendy price movements can be extremely profitable. However, trading with the trend is often easier said than done, because many indicators are based on price reversals not trends. These aren't very effective at identifying trendy periods, or predicting whether trends will continue. We developed the Trendiness Index to help address this problem by indicating the strength and direction of price trend
49 USD
PipFinite Trend PRO
Karlo Wilson Vendiola
4.9 (2753)
Breakthrough Solution For Trend Trading And Filtering With All Important Features Built Inside One Tool! Trend PRO's smart algorithm detects the trend, filters out market noise and gives entry signals with exit levels. The new features with enhanced rules for statistical calculation improved the overall performance of this indicator. Important Information Revealed Maximize the potential of Trend Pro, please visit www.mql5.com/en/blogs/post/713938 The Powerful Expert Advisor Version Automa
98 USD
Magic Balance
Daniil Evstratenko
The indicator shows which trading pairs, strategies, robots and signals that you use are profitable and which are not. The statistic of trades and balance graph are displayed in the account currency and pips - to switch simply click on the graph. button "$"(top left) - minimize/expand and move the indicator panel button ">"(bottom right) - stretching and resetting to the original size Statistic of trades 1 line - account balance, current profit and lot of open trades; 2 line - the number of al
30 USD
Super Gator
Agustinus Biotamalo Lumbantoruan
This indi shows the following 1. Supertrend 2. Alligator (Not a regular alligator) 3. ZigZag 4. Moving Average 5. Trend Continuation/Mini correction Signal (plotted in X) (See screenshots in green background color 6. Early Signal Detection (See screenshots in green background color) You may treat Alligator as the lagging indicator The leading indicator is the supertrend. The zig zag is based on the leading indicator where it gets plotted when the leading indicator got broken to the opposite.
150 USD
The indicator detects and displays Shark harmonic pattern (see the screenshot). The pattern is plotted by the extreme values of the ZigZag indicator (included in the resources, no need to install). After detecting the pattern, the indicator notifies of that by a pop-up window, a mobile notification and an email. The indicator highlights the process of the pattern formation and not just the complete pattern. In the former case, it is displayed in the contour triangles. After the pattern is comple
30 USD
PipFinite Exit EDGE
Karlo Wilson Vendiola
4.88 (155)
Did You Have A Profitable Trade But Suddenly Reversed? In a solid strategy, exiting a trade is equally important as entering. Exit EDGE helps maximize your current trade profit and avoid turning winning trades to losers. Never Miss An Exit Signal Again Monitor all pairs and timeframes in just 1 chart www.mql5.com/en/blogs/post/726558 How To Trade You can close your open trades as soon as you receive a signal Close your Buy orders if you receive an Exit Buy Signal. Close your Sell orde
88 USD
Trend Divergence Finder – индикатор, позволяющий выявлять дивергенции цены и графика выбранного индикатора. С помощью Trend Divergence Finder вы сможете подобрать тот индикатор, который наиболее эффективен для Вас, и использовать его с наглядным отображением на графике. В индикатор включены 9 базовых индикаторов : 1.        RSI 2.        MACD 3.        MOMENTUM 4.        RVI 5.        STOCHASTIC 6.        CCI 7.        Standard Deviation 8.        Derivative 9.        William Blau Присутст
69 USD
Chart Patterns Detect 15 patterns (Ascending Triangle, Descending Triangle, Rising Wedge, Falling Wedge, Bullish Flag, Bearish Flag, Bullish Rectangle, Bearish Rectangle Symmetrical triangle, Head and Shoulders, Inverted Head and Shoulders, Triple top, Triple Bottom, Double Top, Double Bottom) Use historical data to calculate the probability of each pattern to succeed (possibility to filter notification according to the chance of success) gives graphic indication about the invalidation level and
58 USD
Insider Scalper Binary This tool is designed to trade binary options. for short temporary spends. to make a deal is worth the moment of receiving the signal and only 1 candle if it is m1 then only for a minute and so in accordance with the timeframe. the accuracy of this tool is about to 80% for better results, you need to select well-volatile charts.... recommended currency pairs eur | usd, usd | jpy .... the indicator is already configured, you just have to add it to the chart and tra
103 USD
Monster Harmonic Indicator
Paul Geirnaerdt
4.65 (31)
Monster Harmonics Indicator is a harmonic pattern indicator. It recognizes Gartley, Bat, Crab, Butterfly, Cypher, White Swan, Black Swan, Shark and several other patterns. Projected patterns that are not yet completed are recognized, too. Monster even shows the PRZ (Potential Reversal Zone). Users can add their own user defined patterns to Monster. Besides the current pattern, Monster also shows all patterns in the symbols history. Monster will provide alerts for developing patterns. Introduced
79 USD
ZhiBiCCI MT4
Qiuyang Zheng
5 (1)
[ZhiBiCCI] indicators are suitable for all cycle use, and are also suitable for all market varieties. [ZhiBiCCI] Green solid line is a reversal of bullish divergence. The green dotted line is a classic bullish divergence. [ZhiBiCCI] The solid line to the red is a reverse bearish divergence. The red dotted line is a classical bearish divergence. [ZhiBiCCI] can be set in the parameters (Alert, Send mail, Send notification), set to (true) to send instant signals to the alarm window, email, in
58 USD
Trend IM
Yvan Musatov
Tired of choosing indicator settings, losing precious time? Tired of uncertainty in their optimality? Scared by the unknown in their profitability? Then the Trend IM indicator is just for you. The indicator will save you a lot of time that can be spent on more useful activities, such as relaxing, but at the same time, the efficiency will increase many times over. It uses only one parameter for setting, which sets the number of bars for calculation. Trend IM is a reversal indicator and is part
99 USD
An indicator of pattern #31 ("Long Island") from Encyclopedia of Chart Patterns by Thomas N. Bulkowski. The second gap is in the opposite direction. Parameters: Alerts - show alert when an arrow appears   Push - send a push notification when an arrow appears (requires configuration in the terminal) GapSize - minimum gap size in points ArrowType - a symbol from 1 to 17 ArrowVShift - vertical shift of arrows in points   ShowLevels - show levels ColUp - color of an upward line ColDn - color of
30 USD
Simple to read and powerful, no fancy lines and drawings to clutter your chart or distract you. The trend probability oscillator estimates how likely a trend will continue in a certain period. The cummulator period controls how many bars in the past to use and is a proxy for the timescale the trend probability should hold. The use of a Max Line improves this further by indicating when a trend is likely to reverse. In most cases a trend must lose momentum before reversing. Hence, a trend probabil
99 USD
Laguerre SuperTrend Clouds adds an Adaptive Laguerre averaging algorithm and alerts to the widely popular SuperTrend indicator. As the name suggests, Laguerre SuperTrend Clouds (LSC) is a trending indicator which works best in trendy (not choppy) markets. The SuperTrend is an extremely popular indicator for intraday and daily trading, and can be used on any timeframe. Incorporating Laguerre's equation to this can facilitate more robust trend detection and smoother filters. The LSC uses the impro
30 USD
Indicator function This index buys and sells according to the color, using time is one hour,Please run the test on a 30-minute cycle It is best to use 1H for testing   About update questions In order to be more suitable for market fluctuations, the company regularly updates the indicators   Product cycle and trading time applicable to indicators Applicable mainstream currency pair EUR/USD GBP/USD NZD/USD AUD/USD USD/JPY USD/CAD USD/CHF Applicable mainstream cross currency pair EUR/JPY EUR/GBP E
149 USD
Based on MACD indicator waves with standard parameters Applies Fibonacci levels to the last two MACD waves, positive and negative respectively, if at the moment the MACD indicator runs out of negative Wave - the color is green, if at the moment the MACD indicator runs out of positive Wave - the color is red. The Wave termination criterion is two ticks with a different MACD sign. Applies trend lines on the last four MACD Waves. Works well with the expert Figures MACD   https://www.mql5.com/ru/mar
30 USD
The indicator detects and displays М. Gartley's Butterfly pattern. The pattern is plotted by the extreme values of the ZigZag indicator (included in the resources, no need to install). After detecting the pattern, the indicator notifies of that by the pop-up window, a mobile notification and an email. The pattern and wave parameters are displayed on the screenshots. The default parameters are used for demonstration purposes only in order to increase the amount of detected patterns. Parameters
30 USD
ATeam Divergence
Hoang Ngoc Thach
The CCI Divergence is a reasonably useful indicator in itself, but it is even more effective when used with divergence pattern trading. The CCI Divergence indicator signal is one of the most potent signals among the indicators that exist in the market. Here is new version for Divergence Indicator using CCI method, with more improvements. Divergences indicate a potential investment point because the directional moment does not confirm the price. A bullish divergence occurs when the underlying
49 USD
ProTrading Arrow
Nedyalka Zhelyazkova
5 (1)
" UNIQUE TRADING APPROACH TO TRADE LIKE A PRO TRADER ! " Following the trend successfully is important for every trader and is not easy endeavor even for professional traders. To trade comfortably and execute successful trades you need a good indicator for sure and trading plan which is determined individually. ProTrading Arrow is a trend reversal system never before released that works with trending, sideways and volatile markets . buy signal on a new buy arrow signal. sell signal on a new
50 USD
Forex Gump
Andrey Kozak
2.83 (6)
Forex Gump is a fully finished semi-automatic trading system. In the form of arrows, signals are displayed on the screen for opening and closing deals. All you need is to follow the instructions of the indicator. When the indicator shows a blue arrow, you need to open a buy order. When the indicator shows a red arrow, you need to open a sell order. Close orders when the indicator draws a yellow cross. In order to get the most effective result, we recommend using the timeframes H1, H4, D1. There
147 USD
The indicator analyzes the change in the minimum and maximum prices of the previous bars fixing the entrance of the big players. If the change (delta) increases, a signal is displayed on the graph in the form of an arrow. At the same time, virtual trade on history is carried out. In case of a repeat of the signal, the positions are increased (refilling). Thus the lot of positions can differ. The results of virtual trading in the form of losses / losses, profitability, drawdown and transaction li
30 USD
The indicator detects and displays 3 Drives harmonic pattern (see the screenshot). The pattern is plotted by the extreme values of the ZigZag indicator (included in the resources, no need to install). After detecting the pattern, the indicator notifies of that by a pop-up window, a mobile notification and an email. The indicator highlights the process of the pattern formation and not just the complete pattern. In the former case, it is displayed in the contour triangles. After the pattern is com
30 USD
PullbackMatrix provides the key information of the trading transactions when it finds the right market moment based on its built-in logic algorithm. The high accuracy signals including Trading Symbol, Entry Price, Entry Time, TakeProfit, Stoploss, and more. And that's all will be available instantly in your chart panel, drawing the position lines and also sending signal notification to email, mobile phone, and screen popup. More important is that also saves signals into a .csv file which is usef
76 USD
이 제품의 구매자들이 또한 구매함
RelicusRoad Pro
Relicus LLC
4.9 (88)
지금 $147($602 할인) - 무제한 계정 - 다음 업데이트 시 가격 인상 - 5스타 리뷰를 남기는 것을 잊지 마세요 RelicusRoad 사용 설명서 + 교육 비디오 + 비공개 Discord 그룹 액세스 + VIP 상태 시장을 보는 새로운 방법 RelicusRoad는 외환, 선물, 암호화폐, 주식 및 지수에 대한 세계에서 가장 강력한 거래 지표로서 거래자에게 수익성을 유지하는 데 필요한 모든 정보와 도구를 제공합니다. 우리는 초보자부터 고급까지 모든 거래자가 성공할 수 있도록 기술적 분석 및 거래 계획을 제공합니다. 미래 시장을 예측할 수 있는 충분한 정보를 제공하는 핵심 거래 지표입니다. 우리는 차트에서 말이 안 되는 여러 지표 대신 완전한 솔루션을 믿습니다. 타의 추종을 불허하는 매우 정확한 신호, 화살표 + 가격 조치 정보를 표시하는 올인원 표시기입니다. 강력한 AI를 기반으로 하는 RelicusRoad는 누락된 정보와 도구를 제공하여 교육하고 성공적인
147 USD
Advanced Supply Demand
Bernhard Schweigert
4.94 (287)
현재 33% 할인! 초보자나 전문 트레이더를 위한 최고의 솔루션! 이 보조지표는 우리가 다수의 독창적 기능과 새로운 공식을 통합한 독특하고 고품질이며 저렴한 거래 도구입니다. 이 업데이트를 통해 이중 시간대를 표시할 수 있습니다. 더 높은 TF를 표시할 수 있을 뿐만 아니라 차트 TF와 더 높은 TF 모두를 표시할 수 있습니다: 중첩 영역 표시. 모든 Supply Demand 트레이더들이 좋아할 것입니다. :) 중요한 정보 공개 Advanced Supply Demand의 잠재력을 극대화하려면 다음을 방문하십시오. https://www.mql5.com/ko/blogs/post/720245   진입 또는 목표의 명확한 트리거 포인트를 정확히 찾아냄으로 해서 거래가 어떻게 개선될지 상상해 보십시오. 새로운 알고리즘을 기반으로 매수자와 매도자 간의 잠재적인 불균형을 훨씬 더 쉽게 분간할 수 있습니다. 왜냐하면 가장 강한 공급영역과 가장 강한 수요 영역과 과거에 어떻게 진행 되었는지를(이
148 USD
A top and bottom indicator that can intuitively identify the trend of the band. It is the best choice for manual trading, without redrawing or drifting. How to get this indicator for free: Learn more For any novice and programming trading friend, you can write the signal into the EA to play freely. Array 3 and array 4, for example, 3>4 turns green, 3<4 turns red. If you don't understand, please contact me. Original price of USD 198 ( current price of USD 79 ) - Next update price increase- unlimi
79 USD
Advanced Currency Strength28 Indicator
Bernhard Schweigert
4.92 (614)
현재 26% 할인 초보자 또는 전문가 트레이더를 위한 최고의 솔루션! 이 지표는 우리가 독점 기능과 새로운 공식을 통합했기 때문에 독특하고 고품질이며 저렴한 거래 도구입니다. 단 하나의 차트로 28 Forex 쌍의 통화 강도를 읽을 수 있습니다! 새로운 추세 또는 스캘핑 기회의 정확한 트리거 포인트를 정확히 찾아낼 수 있기 때문에 거래가 어떻게 개선될지 상상해 보십시오. 사용 설명서: 여기를 클릭  https://www.mql5.com/en/blogs/post/697384 그것이 첫 번째, 원본입니다! 쓸모없는 지망생 클론을 사지 마십시오. 더 스페셜  강력한 통화 모멘텀을 보여주는 하위 창의 화살표 GAP가 거래를 안내합니다! 기본 또는 호가 통화가 과매도/과매도 영역(외부 시장 피보나치 수준)에 있을 때 개별 차트의 기본 창에 경고 표시가 나타납니다. 통화 강도가 외부 범위에서 떨어질 때 풀백/반전 경고. 교차 패턴의 특별 경고 추세를 빠르게 볼 수 있는
148 USD
Ultimate Sniper Dashboard
Hispraise Chinedum Abraham
4.78 (18)
299달러로 할인! 추후 가격이 인상될 수 있습니다! 아래 설명을 읽어보세요! Ultimate Sniper Dashboard를 위한 최고의 엔트리 시스템: ULTIMATE DYNAMIC LEVELS. (내 제품을 확인하십시오) Ultimate Sniper Dashboard는 MT4 다중 통화 테스트 제한으로 인해 라이브 시장에서만 작동합니다. Ultimate-Sniper 대시보드를 소개합니다! HA-Sniper와 MA-Sniper를 모두 포함하는 최고의 제품입니다. 그리고 많은 특수 모드. Ultimate Sniper Dashboard는 절대 야수입니다! 초보자 또는 전문가 트레이더를 위한 최고의 솔루션! 다시 움직임을 놓치지 마세요! 단순함과 핍을 좋아하는 트레이더를 위해 특별한 제품을 준비했습니다. 본질적으로 단순한 대시보드는 여러 사용자 지정 알고리즘을 기반으로 28개의 통화 쌍을 살펴보는 모든 작업을 수행합니다. 단 하나의 차트로 전문가처럼 시장을 읽을 수 있습니다. 움직이기
299 USD
Owl smart levels
Sergey Ermolov
5 (7)
표시기 매뉴얼  |  Owl Smart Levels 전략  |   MT5 버전  |  설치하는 방법?   |   FAQ Owl Smart Levels Indicator 는   Bill Williams 의 고급 프랙탈, 시장의 올바른 파동 구조를 구축하는 Valable ZigZag, 정확한 진입 수준을 표시하는 피보나치 수준과 같은 인기 있는 시장 분석 도구를 포함하는 하나의 지표 내에서 완전한 거래 시스템입니다. 시장과 이익을 취하는 장소로. 거래 시스템에 대한 자세한 설명은   Owl Trend Strategy - Smart Levels   기사를 참조하십시오. 힘은 단순함에 있습니다! Owl Smart Levels   거래 시스템은 사용하기 매우 쉽기 때문에 전문가와 이제 막 시장을 연구하고 스스로 거래 전략을 선택하기 시작한 사람들 모두에게 적합합니다. 전략 및 지표에는 눈에 보이지 않는 비밀 공식 및 계산 방법이 없으며 모든 전략 지표는 공개되어 있습니다. Owl Smar
97 USD
Entry Points Pro
Yury Orlov
4.72 (215)
다시 색을 칠하지 않고 거래에 진입할 수 있는 정확한 신호를 제공하는 MT4용 지표입니다. 외환, 암호화폐, 금속, 주식, 지수 등 모든 금융 자산에 적용할 수 있습니다. 매우 정확한 추정값을 제공하고 매수와 매도의 가장 좋은 시점을 알려줍니다. 하나의 시그널로 수익을 내는 지표의 예와 함께 비디오 (6:22)시청하십시오! 대부분의 거래자는 Entry Points Pro 지표의 도움으로 첫 거래 주 동안 트레이딩 결과를 개선합니다. 저희의   Telegram Group 을 구독하세요! Entry Points Pro 지표의 좋은점. 재도색이 없는 진입 신호 신호가 나타나고 확인되면(시그널 캔들이 완성된 경우) 신호는 더 이상 사라지지 않습니다. 여타 보조지표의 경우 신호를 표시한 다음 제거되기 때문에 큰 재정적 손실로 이어집니다. 오류 없는 거래 게시 알고리즘을 통해 트레이드(진입 또는 청산)를 할 이상적인 순간을 찾을 수 있으며, 이를 통해 이를 사용하는 모든 거래자의
125 USD
Advanced Currency IMPULSE with ALERT
Bernhard Schweigert
4.93 (460)
현재 31% 할인!! 초보자 또는 전문가 트레이더를 위한 최고의 솔루션! 이 지표는 우리가 독점 기능과 비밀 공식을 통합했기 때문에 독특하고 고품질이며 저렴한 거래 도구입니다. 단 하나의 차트로 28개 통화 쌍 모두에 대한 경고를 제공합니다. 새로운 추세 또는 스캘핑 기회의 정확한 트리거 포인트를 정확히 찾아낼 수 있기 때문에 거래가 어떻게 개선될지 상상해 보십시오! 새로운 기본 알고리즘을 기반으로 구축되어 잠재적인 거래를 훨씬 더 쉽게 식별하고 확인할 수 있습니다. 이는 통화의 강세 또는 약세가 가속되는지 여부를 그래픽으로 표시하고 가속 속도를 측정하기 때문입니다. 자동차의 속도계처럼 생각하면 됩니다. 가속화할 때 Forex 시장에서 동일한 일이 분명히 더 빠르게 발생합니다. 즉, 반대 방향으로 가속화되는 통화를 페어링하면 잠재적으로 수익성 있는 거래를 식별한 것입니다. 통화 모멘텀의 수직선과 화살표가 거래를 안내합니다! 역동적인 Market Fibonacci 23
88 USD
Ultimate Dynamic Levels
Hispraise Chinedum Abraham
4.86 (7)
現在、ホリデーディスカウントで399ドル! 今後値上がりする可能性があります。以下の説明をお読みください。 Ultimate Dynamic Levelsの紹介 - Ultimate Sniper DashboardのBESTエントリーインジケーター! 極めてローリスクなタイムリーエントリーと高RR!!! アルティメットスナイパーダッシュボードはこちら。 初心者はもちろん、プロのトレーダーにとっても最も重要な能力は、いつどこで相場が転換するかを正確に判断し、いかに安全に参入し、利益を得て退場するかを見極めることです。 アルティメット・ダイナミック・レベルズ・インディケーターは、相場が転換する可能性が最も高い場所を簡単に教えてくれるので、極めてローリスクなトレードを自信を持って行うことができ、同時にチャートをクリーンでシンプルに保ちながら、$$$を稼ぐことができるのです! アルティメット・ダイナミック・レベルズ・インディケーターは、複数の時間枠で重要な隠れたレベルを一度に見つけるユニークで強力なアルゴリズムを持っています。また、他の典型的なSRインジケーターのように、レベ
199 USD
Cycle Sniper
Elmira Memish
4.6 (30)
NEW YEAR SALE PRICE FOR LIMITED TIME!!! Please contact us after your purchase and we will send you the complimentary indicators to complete the system. Cycle Sniper is not a holy grail but when you use it in a system which is explained in the videos, you will feel the difference. If you are not willing to focus on the charts designed with Cycle Sniper and other free tools we provide, we recommend not buying this indicator. We recommend watching the videos about the indiactor and system before
200 USD
현재 20% 할인 ! 초보자 또는 전문가 트레이더를 위한 최고의 솔루션! 이 대시보드 소프트웨어는 28개의 통화 쌍에서 작동합니다. 2가지 주요 지표(Advanced Currency Strength 28 및 Advanced Currency Impulse)를 기반으로 합니다. 전체 Forex 시장에 대한 훌륭한 개요를 제공합니다. 고급 통화 강도 값, 통화 이동 속도 및 모든(9) 시간대의 28 Forex 쌍에 대한 신호를 보여줍니다. 추세 및/또는 스캘핑 기회를 정확히 파악하기 위해 차트의 단일 지표를 사용하여 전체 시장을 볼 수 있을 때 거래가 어떻게 개선될지 상상해 보십시오! 잠재적인 거래를 식별하고 확인하면서 강력한 통화와 약한 통화를 더욱 쉽게 식별할 수 있도록 이 지표에 기능을 내장했습니다. 이 표시기는 통화의 강세 또는 약세가 증가 또는 감소하는지 여부와 모든 시간대에서 수행되는 방식을 그래픽으로 보여줍니다. 추가된 새로운 기능은 현재 시장 조건 변화에 적
199 USD
Scalper Inside PRO
Alexey Minkov
4.67 (42)
This is an innovative indicator that uses an exclusive algorithm to quickly and accurately determine the trend. The indicator automatically calculates the opening and closing time of positions, as well as detailed statistics of the indicator's performance for a certain period of history, which allows you to choose the best trading tool for your trade. You can also connect your custom arrow indicators to Scalper Inside Pro to check and calculate their statistics and profitability. Scalper Inside
139 USD
Supply and Demand Dashboard PRO
Bernhard Schweigert
4.79 (19)
현재 20% 할인! 이 대시보드는 여러 기호와 최대 9개의 타임프레임에서 작동하는 매우 강력한 소프트웨어입니다. 주요 지표(최상의 리뷰: 고급 공급 수요)를 기반으로 합니다.   Advanced Supply Demand 대시보드는 훌륭한 개요를 제공합니다. 다음과 같이 표시됩니다.  영역 강도 등급을 포함하여 필터링된 공급 및 수요 값, 영역에 대한/및 영역 내 Pips 거리, 중첩된 영역을 강조 표시하고 모든 (9) 시간 프레임에서 선택한 기호에 대해 4가지 종류의 경고를 제공합니다. 그것은 당신의 개인적인 필요에 맞게 고도로 구성 가능합니다! 당신의 혜택! 모든 트레이더에게 가장 중요한 질문: 시장에 진입하기에 가장 좋은 수준은 무엇입니까? 최고의 성공 기회와 위험/보상을 얻으려면 강력한 공급/수요 영역 내 또는 그 근처에서 거래를 시작하십시오. 손절매를 위한 최적의 장소는 어디입니까? 가장 안전하려면 강력한 수요/공급 구역 아래/위에 정
199 USD
Blahtech Supply Demand
Blahtech Limited
4.62 (34)
Supply Demand uses previous price action to identify potential imbalances between buyers and sellers. The key is to identify the better odds zones, not just the untouched ones. Blahtech Supply Demand indicator delivers functionality previously unavailable on any trading platform. This 4-in-1 indicator not only highlights the higher probability zones using a multi-criteria strength engine, but also combines it with multi-timeframe trend analysis, previously confirmed swings and engulfing detector
142 USD
TPA True Price Action indicator reveals the true price action of the market makers through 100% non-repainting signals (except early signals mode) strictly at the close of a candle! TPA shows entries and re-entries, every time the bulls are definitely stronger than the bears and vice versa. Not to confuse with red/green candles. The shift of power gets confirmed at the earliest stage and is ONE exit strategy of several. There are available now two free parts of the TPA User Guide for our custo
168 USD
Volume by Price MT4
Brian Collard
5 (14)
The Volume by Price Indicator for MetaTrader 4 features Volume Profile and Market Profile TPO (Time Price Opportunity). Get valuable insights out of currencies, equities and commodities data. Gain an edge trading financial markets. Highest quality real-time and historical price data distributions. Versatile range selection methods. Drag and drop with time/price option. Unlimited segmentation. Session filtering with built-in presets for New York, London, Tokyo, Sydney and São Paulo. Composites w
149.95 USD
NO REPAINT ADVANCED CHART PATTERN INDICATOR By definition, a price ( chart)  pattern is a recognizable configuration of price movement that is identified using a series of  trendlines  and/or curves. When a price pattern signals a change in trend direction, it is known as a reversal pattern; a continuation pattern occurs when the trend continues in its existing direction following a brief pause. Advanced Chart Pattern Tracker is designed to find the MOST ACCURATE patterns. A special script is ad
130 USD
TakePropips Donchian Trend Pro
Eric John Pajarillaga Aldana
4.75 (12)
TakePropips Donchian Trend Pro   (MT4)는 Donchian 채널을 사용하여 추세의 방향을 자동으로 감지하고 진입 및 퇴장 거래 신호를 제공하는 강력하고 효과적인 도구입니다! 이 다기능 지표에는 추세 스캐너, 거래 신호, 통계 패널, 스크리너, 거래 세션 및 경고 내역 대시보드가 포함됩니다. 거래 신호를 제공하고 차트 분석 시간을 절약하도록 설계되었습니다! 다음 블로그 게시물에서 사용자 설명서 및 설치 가이드를 다운로드할 수 있습니다.   https://www.mql5.com/en/blogs/post/751368 오늘 50% 할인을 받으세요! 가격이 $98에서 $49로 인하되었습니다! 전략 테스터에서 이 지표를 테스트할 수 있습니다(비주얼 모드 활성화). 실시간 차트에서 테스트하고 싶다면 저에게 메시지를 보내 7일 평가판을 받을 수도 있습니다. 자세한 내용은 설명 아래에 비디오 자습서도 제공됩니다. 질문이 있거나 도움이 필요하면 저에게 연락하십시오.
99 USD
GOLD Impulse with Alert
Bernhard Schweigert
5 (1)
이 지표는 Advanced Currency IMPULSE with ALERT  +   Currency Strength Exotics  의 2가지 제품의 슈퍼 조합입니다. 그것은 모든 시간 프레임에 대해 작동하며 8개의 주요 통화와 하나의 기호에 대한 강약의 충동을 그래픽으로 보여줍니다! 이 표시기는 금, 이국적인 쌍, 상품, 지수 또는 선물과 같은 기호에 대한 통화 강도 가속을 표시하는 데 특화되어 있습니다. 금, 은, 오일, DAX, US30, MXN, TRY, CNH 등의 진정한 통화 강도 가속(충동 또는 속도)을 표시하기 위해 9번째 줄에 모든 기호를 추가할 수 있습니다. 새로운 기본 알고리즘을 기반으로 구축되어 잠재적인 거래를 훨씬 더 쉽게 식별하고 확인할 수 있습니다. 이는 통화의 강세 또는 약세가 가속되는지 여부를 그래픽으로 표시하고 가속 속도를 측정하기 때문입니다. 자동차의 속도계처럼 생각하면 됩니다. 가속화할 때 Forex 시장에서 동일한 일이 분명히
149 USD
Ns_Geometric Chart Scale for MT4-Gann Grid,Gann Square & Gann box...To Draw any Geometric Shapes and Gann grid. #Forex Currecnies Pairs-Place same number & decimal in Gann Grid. if Commodities & Cryptocurrencies chart scale shows 0.66/66 same Scale for GannGrid ,for Gann square/Gann scale-66/660 Box only Numbers. #If Stocks & Index sale display - 3.03 that means Same scale input 3.03 for  Gann Grid and 303 for Gann Square & Gann Box Scale. Video Links :- https://youtu.be/Wnzq2-65GG4           
599 USD
(FOR MT4)   Double Top Scanner Multi Pair And Multi Time Frame :   This indicator has been designed to automatically identify high probability double tops and double bottoms. It can also be used to identify triple-tops and triple-bottoms. And it includes an RSI trend filter, in order to identify the formations that occur at the top (or bottom) of a trend. IMPORTANT FACTORS TO KEEP IN MIND: Any major level that holds 2 or 3 times is obviously a level that is being defended by the large institut
79 USD
M1 TickTok
Andrey Kozak
5 (1)
Scalping indicator 2 in 1. Buying this indicator, you get an automatic robot as a gift! Automatic system for searching for price reversal points. The indicator with dots on the chart of a currency pair shows the likely reversal points of the price movement. A red dot indicates a reversal of the movement down, and a blue dot indicates a reversal in the price movement up. The indicator is great for intraday trading using a scalping strategy. Ideally combined with channel indicators. When the chan
147 USD
Order Block Indicator MT4
Diego Arribas Lopez
5 (2)
[ MT5 Version ] Order Block Indicator MT4 Order Block Indicator MT4  is currently the most accurate and customizable indicator in the market. It has been developed to facilitate the analysis of operations based on Order Blocks and Supply and Demand Zones. These zones are possible reversal points of a movement. Order Blocks indicate a possible accumulation of orders in one area. The price usually gets to reach and react strongly to those areas. The most relevant levels for this reaction are the c
224 USD
Automated Trendlines
Georgios Kalomoiropoulos
5 (16)
추세선은 외환 거래에서 기술적 분석의 가장 필수적인 도구입니다. 불행히도, 대부분의 거래자는 올바르게 그리지 않습니다. 자동 추세선 표시기는 시장의 추세 움직임을 시각화하는 데 도움이 되는 진지한 거래자를 위한 전문 도구입니다. 추세선 강세 추세선과 약세 추세선에는 두 가지 유형이 있습니다. 상승 추세에서 Forex 추세선은 가격 움직임의 가장 낮은 스윙 포인트를 통해 그려집니다. 최소 두 개의 "최저 저점"을 연결하면 추세선이 생성됩니다. 하락 추세에서 추세선은 가격 움직임의 가장 높은 스윙 포인트를 통해 그려집니다. 최소 두 개의 "최고 최고점"을 연결하면 추세선이 생성됩니다. 추세선이 깨질 때? 강세 추세선은 약세 양초가 강세 추세선 아래에서 닫히고 양초의 고점이 추세선 위에 있을 때 깨집니다. 약세 추세선은 강세 양초가 약세 추세선 위로 마감되고 양초 저점이 추세선 아래에 있을 때 깨집니다. 추세선이 삭제되면? 강세 추
99 USD
XQ Forex Indicator MT4
Marzena Maria Szmit
The signal conditions are a combination of three indicators, and XQ Forex Indicators only display  medium and long-term trends . The indicator's efficacy has been improved with the addition of a filter that blocks out false signals. The XQ Forex Indicator can be used on FX pairs, CFDs, and Cryptocurrencies . There are two type of signals:  Buy or Sell and Big Long or Big Short It is possible to enable sending emails when a major trend-change signal is detected, as well as to display the alerts
179 USD
CyberZingFx Volume Plus
Afsal Meerankutty
4.93 (15)
Advanced version of CyberZingFx Volume Plus, the ultimate MT4 indicator for traders seeking highly accurate buy and sell signals. With an additional strategy and price action dot signals that enhances its effectiveness, this indicator offers a superior trading experience for professionals and beginners alike. The CyberZingFx Volume Plus Advanced version combines the power of volume analysis and historical price data with an additional strategy, resulting in even more precise and reliable signals
135 USD
Please send me Direct message on MQL5 CHAT after purchasing the Indicator for Training and Installation Support There are some additional files that is important to use with the Indicator . So be sure to contact me after purchasing the Indicator So that I can add you for training and support . If you find any difficulty with installation then send me Direct message here So that I can connect with you via Anydesk or Teamview for the product installation. " Smart Order Block Indicator " to find
249 USD
Quantum Volume Point of Control Indicator
QUANTUM TRADING SOFTWARE LIMITED
5 (2)
The Quantum VPOC indicator has been developed to expand the two dimensional study of volume and price, to a three dimensional one which embraces time. The volume/price/time relationship then provides real insight to the inner workings of the market and the heartbeat of sentiment and risk which drives the price action accordingly. The Quantum VPOC indicator displays several key pieces of information on the chart as follows: Volume Profile - this appears as a histogram of volume on the vertical pr
197 USD
Royal Wave Pro M4
Vahidreza Heidar Gholami
5 (2)
Royal Wave is a Trend-Power oscillator which has been programmed to locate and signal low-risk entry and exit zones. Its core algorithm statistically analyzes the market and generates trading signals for overbought, oversold and low volatile areas. By using a well-designed alerting system, this indicator makes it easier to make proper decisions regarding where to enter and where to exit trades. Features Trend-Power Algorithm Low risk Entry Zones and Exit Zones Predictions for Overbought and Over
129 USD
Currency Strength Exotics
Bernhard Schweigert
5 (23)
현재 20% 할인! 초보자 또는 전문가 트레이더를 위한 최고의 솔루션! 이 표시기는 Exotic Pairs Commodities, Indexes 또는 Futures와 같은 기호에 대한 통화 강도를 표시하는 데 특화되어 있습니다. 금, 은, 석유, DAX, US30, MXN, TRY, CNH 등의 진정한 통화 강도를 보여주기 위해 9번째 줄에 모든 기호를 추가할 수 있습니다. 이것은 독특하고 고품질이며 저렴한 거래 도구입니다. 우리는 많은 독점 기능과 새로운 공식을 통합했습니다. 새로운 추세 또는 스캘핑 기회의 정확한 트리거 포인트를 정확히 찾아낼 수 있기 때문에 거래가 어떻게 개선될지 상상해 보십시오. 사용 설명서: 여기를 클릭 https://www.mql5.com/en/blogs/post/708876 모든 시간대에 작동합니다. TREND를 빠르게 확인할 수 있습니다! 새로운 기본 알고리즘을 기반으로 설계되어 잠재적인 거래를 더욱 쉽게 식별하고 확인할 수 있습니다.
128 USD
제작자의 제품 더 보기
AI Boost MT4
Rodrigo Arana Garcia
5 (4)
AI Boost 는 고급 인공 지능 계산 기능을 갖춘 지능형 로봇입니다. 알고리즘의 일부는 OpenAI 기술의 도움으로 훈련되었습니다. 기계 학습 기술과 복잡한 데이터 처리를 사용하는 당사의 로봇은 대량의 시장 정보를 실시간으로 분석하고 정확하고 정보에 입각한 거래 결정을 내릴 수 있습니다. 강력한 인공 지능 엔진을 갖춘 당사의 로봇은 시장 데이터의 패턴을 식별하고 미래 추세에 대한 정확한 예측을 할 수 있습니다. 또한 로봇은 시장의 변화에 ​​지속적으로 적응하고 자체 결정을 통해 학습하여 성능과 정밀도를 지속적으로 향상시킵니다. 알고리즘에는 거래당 테이크프로핏과 손절매 표시를 표시하지 않는 기능이 내장되어 있어 브로커는 시장 진입 또는 퇴장 방법을 알 수 없습니다. 또한 딥 러닝 시스템의 승인 이전에 시장 진입 테스트가 수행되는 '가상 대기 주문'이라고도 하는 VPO 시스템을 통합합니다. 가격 정책: 알고리즘의 효율성을 유지하기 위해 AI Boost 사본이 많이 판매되지
199 USD
Auto Fibo MT5
Rodrigo Arana Garcia
4 (4)
Auto Fibo 는 수동 거래를 향상시키기 위해 개발된 지표입니다. 자동으로 황금 비율을 그려 시간을 절약하고 거래를 촉진합니다. 지표를 그래프에 부착하면 정확한 황금 비율이 자동으로 그려지므로 임계점을 찾아야 하는 수고를 덜 수 있습니다. 인터페이스는 컴퓨터에 따라 밴드의 대략적인 고점과 저점으로 조정됩니다. 이 표시기는 대부분의 시작 및 끝 지점 선택 오류를 수정합니다. 각 밴드에 대해 정확한 가격이 표시됩니다. 警告 私はMQL5.com으로 私のEAを販売するだけ입니다.もし誰かが私のEAを売ってくれと連絡してきたら、それはああにの金が また、もしあなたが私のEAを 外部のウェブサイトから購入した場合、それ는 偽의 바 죤으로 あ り, original의 ゝ と 同じ よ に は 動作 ないこ
FREE
Pips Hunter MT4
Rodrigo Arana Garcia
4.73 (22)
Pips Hunter 표시기는 수동 거래를 보완하기 위해 개발되었습니다. 이 지표는 숏 스캘핑과 롱 스윙 거래 모두에 사용할 수 있습니다. MT5 버전 특징 다시 칠하기 표시기 없음 이 표시기는 새 데이터가 도착해도 값을 변경하지 않습니다 거래 쌍 모든 통화 쌍 시간대 H1이 바람직하지만 모든 기간에 적용할 수 있습니다. 거래 시간 24시간 요구 사항 일부 포지션 스캘핑을 위해 스프레드가 좁은 ECN 브로커를 사용해야 합니다. 중간 임팩트와 높은 임팩트 뉴스 발표 시간에 거래하지 마십시오. 설치하는 방법 선호하는 거래 쌍에 지표를 부착하십시오(H1 권장). 구성 표시기 설정 : 여기에서 지표의 매개변수를 수정하여 가장 적합한 전략을 채택할 수 있습니다. 추가 세팅 : 여기에서 표시기의 여러 부분의 색상을 변경할 수 있습니다. 경고 구성을 변경할 수도 있습니다. 사용 방법 차트에서 박스 브레이크아웃 화살표가 보이면 매
FREE
Auto Fibo MT4
Rodrigo Arana Garcia
5 (4)
Auto Fibo 는 수동 거래를 향상시키기 위해 개발된 지표입니다. 자동으로 황금 비율을 그려 시간을 절약하고 거래를 촉진합니다. 지표를 그래프에 부착하면 정확한 황금 비율이 자동으로 그려지므로 임계점을 찾아야 하는 수고를 덜 수 있습니다. 인터페이스는 컴퓨터에 따라 밴드의 대략적인 고점과 저점으로 조정됩니다. 이 표시기는 대부분의 시작 및 끝 지점 선택 오류를 수정합니다. 각 밴드에 대해 정확한 가격이 표시됩니다. 警告 私はMQL5.com으로 私のEAを販売するだけ입니다.もし誰かが私のEAを売ってくれと連絡してきたら、それはああにの金が また、もしあなたが私のEAを 外部のウェブサイトから購入した場合、それ는 偽의 바 죤으로 あ り, original의 ゝ と 同じ よ に は 動作 ないこ
FREE
Golden Hunter MT5
Rodrigo Arana Garcia
$75에 마지막 사본 ---> 다음: $99 !!!  MT4 버전 Golden Hunter 는 수동으로 시장을 거래하는 트레이더를 위해 개발되었습니다. 3가지 지표로 구성된 매우 강력한 도구입니다. 강력한 진입 전략: 통화 쌍의 변동성을 측정하고 시장 추세를 식별하는 지표로 구성됩니다. LSMA: 가격 데이터를 평활화하고 단기 추세 파악에 유용합니다. Heikin Ashi: 지표가 차트에 연결되면 일본 캔들은 Heikin Ashi 캔들로 변경됩니다. 이러한 유형의 양초는 가격 정보를 부드럽게 하여 강력한 추세를 파악할 수 있도록 합니다. 형질 다시 칠하지 마십시오 이 표시기는 새 데이터가 도착해도 값을 변경하지 않습니다 스프레드가 매우 낮고 변동성이 큰 거래 쌍(EURUSD, GBPUSD, BTCUSD…). 범위(범위) 쌍을 사용하는 것은 권장되지 않습니다 기간 M5 거래 시간 시장에서 더 많은 움직임이 있고 스프레드가 낮은 시간대에 거래하는 것
75 USD
Pips Hunter MT5
Rodrigo Arana Garcia
Pips Hunter   표시기는 수동 거래를 보완하기 위해 개발되었습니다. 이 지표는 숏 스캘핑과 롱 스윙 거래 모두에 사용할 수 있습니다. MT4 버전 특징 다시 칠하기 표시기 없음 이 표시기는 새 데이터가 도착해도 값을 변경하지 않습니다 거래 쌍 모든 통화 쌍 시간대 H1이 바람직하지만 모든 기간에 적용할 수 있습니다. 거래 시간 24시간 요구 사항 일부 포지션 스캘핑을 위해 스프레드가 좁은 ECN 브로커를 사용해야 합니다. 중간 임팩트와 높은 임팩트 뉴스 발표 시간에 거래하지 마십시오. 설치하는 방법 선호하는 거래 쌍에 지표를 부착하십시오(H1 권장). 구성 표시기 설정 : 여기에서 지표의 매개변수를 수정하여 가장 적합한 전략을 채택할 수 있습니다. 추가 세팅 : 여기에서 표시기의 여러 부분의 색상을 변경할 수 있습니다. 경고 구성을 변경할 수도 있습니다. 사용 방법 차트에서 박스 브레이크아웃 화살표가 보이면
300 USD
필터:
Brettfau77
219
Brettfau77 2023.02.21 12:41 
 

Just purchased the indicator and lost the first 2 trades not very reliable and retraces alot, by the time the arrow comes up most of the move has already happened. Just another lagging indicator. complete waste of money.

Rodrigo Arana Garcia
16803
개발자의 답변 Rodrigo Arana Garcia 2023.02.21 14:00
I respect your opinion, for one thing, there are other people who have found it to work. Give it time and you will see positive results.
lauro1956
2912
lauro1956 2023.02.20 11:12 
 

Buenos dias Sr. Arana Buen indicador, ya se que usted recomienda M5... pero veo que tampoco es mala opcion H1

Aunque usted no lo esté recomendando de esta forma.... me podría por favor dar una hipotética configuración para H1... sin que sirva de precedente.

Muchas gracias

Rodrigo Arana Garcia
16803
개발자의 답변 Rodrigo Arana Garcia 2023.02.20 11:35
Hola lauro muchas gracias por tu buena opinión, te he escrito un mensaje
feichkop
49
feichkop 2023.02.10 20:32 
 

This is an amazing indicator, awesome results so far, hopefully it continues.

Rodrigo Arana Garcia
16803
개발자의 답변 Rodrigo Arana Garcia 2023.02.11 21:15
Thank you so much for your good review :)
Natalija3107
288
Natalija3107 2023.01.20 20:12 
 

This indicator is the best I have ever seen. Amazing precision. Perfectly accurate

Rodrigo Arana Garcia
16803
개발자의 답변 Rodrigo Arana Garcia 2023.01.21 10:18
Thanks Natalija for your good review :)
crisg
64
crisg 2023.01.16 15:54 
 

사용자가 평가에 대한 코멘트를 남기지 않았습니다

Rodrigo Arana Garcia
16803
개발자의 답변 Rodrigo Arana Garcia 2023.01.16 17:04
Thanks, enjoy the product :)
리뷰 답변
버전 1.10 2023.02.24
A new alert function has been added at the request of a customer to the indicator. Now each alert will show the symbol from which it originates.