Dashboard 9TF Double CCI Double MA Angle Button
- 지표
- Anon Candra N
- 버전: 1.0
- 활성화: 15
하나의 창에서 통화 쌍의 여러 시간 프레임을 분석하면 혼란스러울 수 있습니다.
여러 시간 프레임을 분석하려면 신뢰할 수 있는 지표가 필요합니다.
그중 하나는 9TF Double CCI Double MA를 사용하고 있습니다.
나는 단순하지만 신뢰할 수 있고 단 하나의 지표에서 9개의 시간 프레임을 모두 다루는 코드를 만들기 위해 밤낮으로 노력했습니다.
이 표시기의 몇 가지 장점을 살펴보겠습니다.
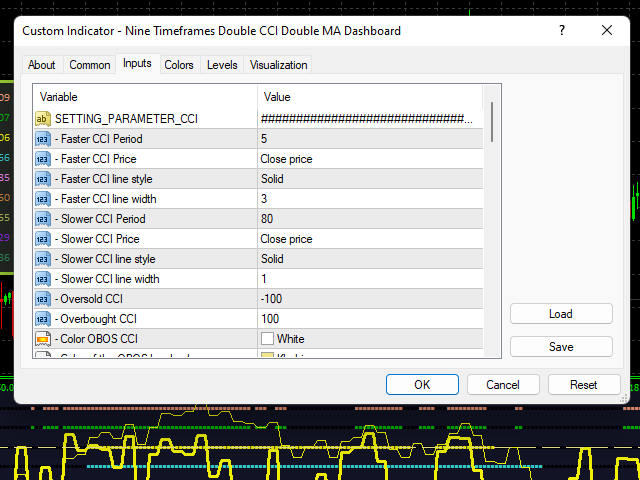
이중 CCI, 즉 CCI는 더 빠르고 CCI는 더 느립니다.
이중 MA, 즉 MA는 더 빠르고 MA는 더 느립니다.
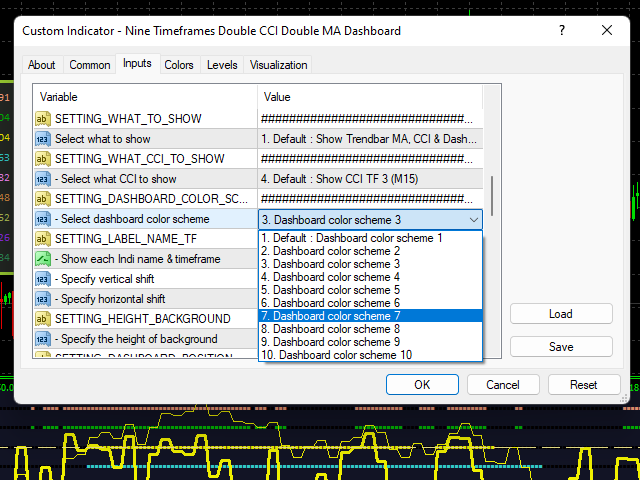
10 색 구성표.
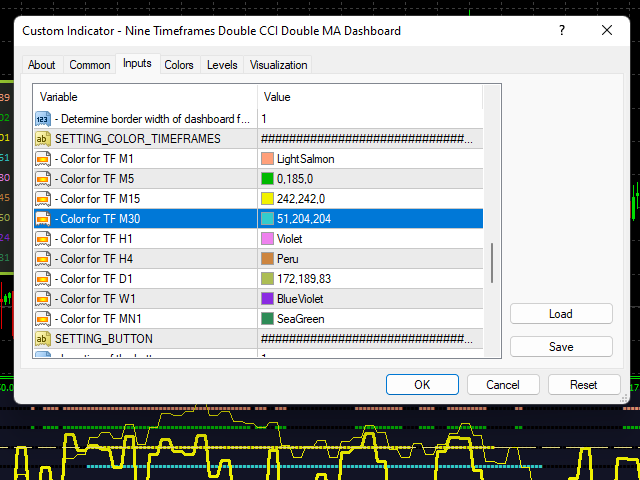
각 기간의 곡선 색상은 서로 다릅니다.
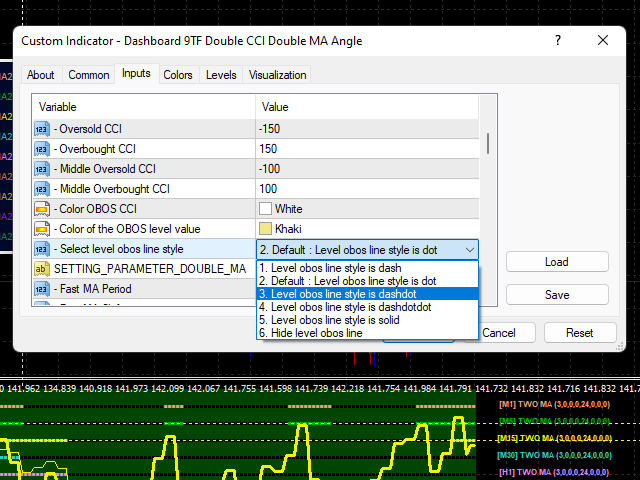
CCI의 OBOS 레벨 라인.
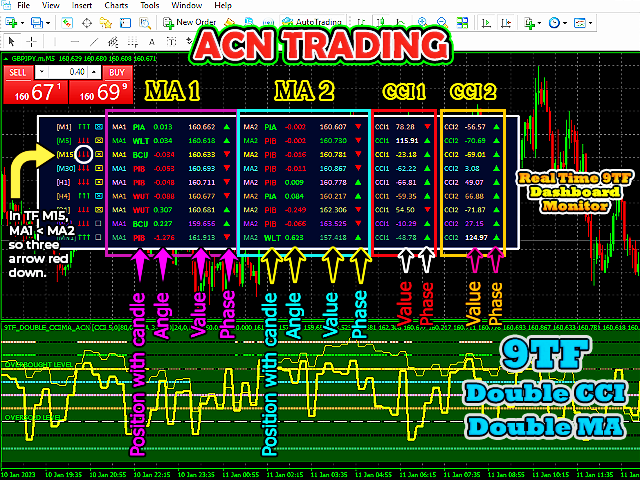
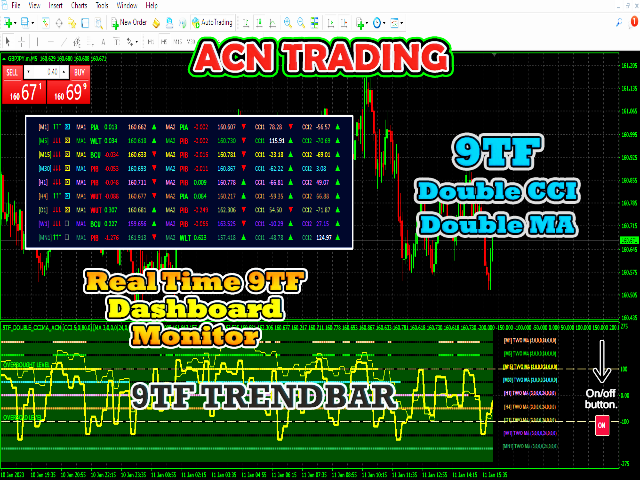
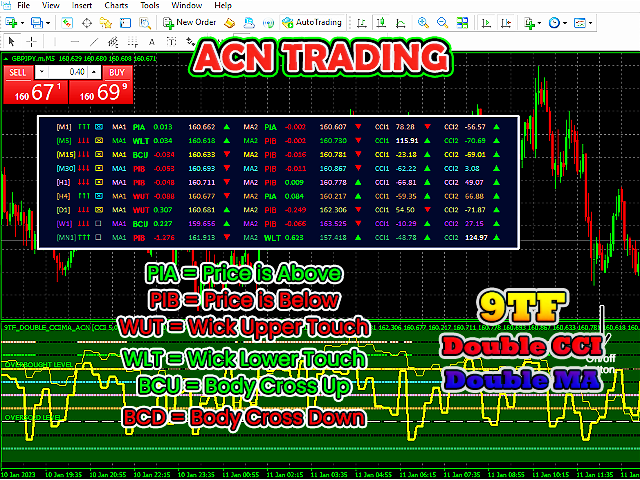
실시간 9TF 대시보드 모니터.
9TF 대시보드 모니터 계산은 한 시간 프레임에서 다른 시간 프레임으로 변경하더라도 매우 정확합니다.
어떤 CCI 곡선이 과매수 수준 위에 있고 과매도 수준 아래에 있는지 모니터링합니다.
MA 빠른 라인이 MA 느린 라인 위에 있는지 또는 그 반대인지 곡선을 모니터링합니다.
MA 고속선과 MA 저속선 사이에 교차점이 있는지 곡선을 모니터링합니다.
이전 신호로 현재 신호의 움직임을 모니터링합니다. 상승 중이거나 하락 중입니다. (참고: 이것은 스캘핑에 매우 중요한 기능입니다!)
장기 추세를 파악하는 데 매우 중요한 추세 막대 기능입니다.
색상을 변경하는 기능.
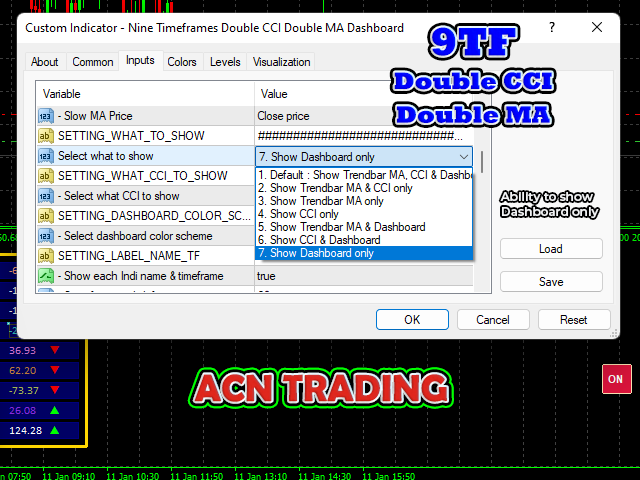
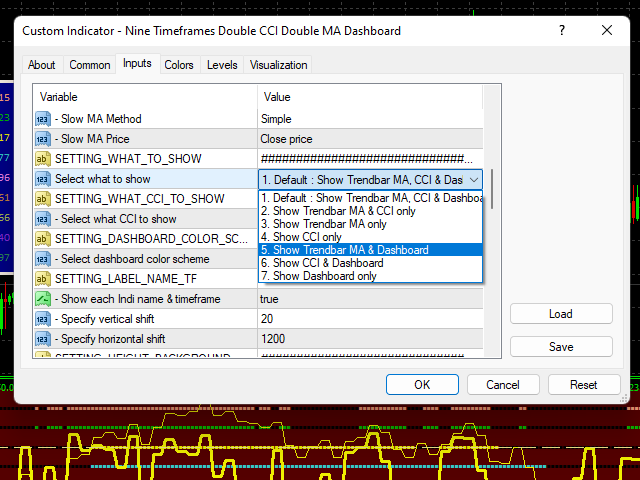
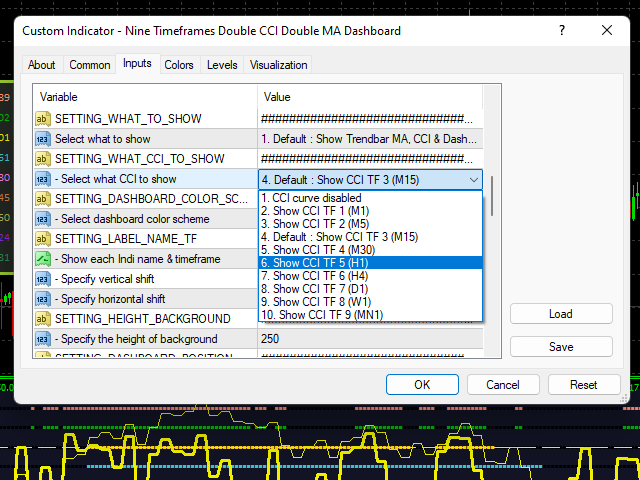
표시할 곡선을 선택하는 기능.
CCI만, MA만, 대시보드만 등을 표시하는 기능
원하는 위치에 9TF 대시보드 모니터를 배치할 수 있는 기능.
한 번의 클릭 버튼으로 지표를 표시하거나 숨길 수 있습니다.
더 높은 시간 프레임에서 작은 시간 프레임으로 가격 행동 움직임을 모니터링하는 기능.
외환, 지수, 금속/에너지, 주식 및 암호 화폐를 분석하는 데 사용할 수 있습니다.
Q1. 현재 CCI 라인이 이전 CCI 라인보다 큰지 또는 그 반대인지 어떻게 알 수 있습니까?
A1. CCI 단계를 살펴보십시오(삼각형 형태로 표현됨). 현재 CCI 라인 > 이전 CCI 라인인 경우 위상은 위를 향한 삼각형 형태이며 라임색입니다. 그 반대는 하향 삼각형이며 빨간색입니다.
Q2. 현재 MA 라인이 이전 MA 라인보다 큰지 또는 그 반대인지 어떻게 알 수 있습니까?
A2. MA 위상(삼각형 형태로 표현됨)을 살펴보십시오. 현재 MA 라인 > 이전 MA 라인인 경우 위상은 위를 향한 삼각형 형태이며 라임색입니다. 그 반대는 하향 삼각형이며 빨간색입니다.
Q3. 현재 MA 빠른 라인이 현재 MA 느린 라인보다 큰지 또는 그 반대인지 어떻게 알 수 있습니까?
A3. 세 개의 화살표를 살펴보십시오. 현재 MA 빠른 라인 > 현재 MA 느린 라인인 경우 세 개의 화살표가 위를 향하고 라임색입니다. 반대쪽은 아래를 향하고 빨간색입니다.
내 YouTube 채널에서 전체 기능을 볼 수 있습니다. 숨길 것이 없습니다.
이 지표를 만드는 나의 의도는 당신의 승리와 이익을 늘리는 것입니다.
최고의 Double CCI Double MA 거래 지표로 자신 있게 입력하세요.
지금 구매하여 전문가처럼 거래하십시오.
고맙습니다.