Price Trender Indicator
- 지표
- Natasha Diedericks
- 버전: 1.1
- 업데이트됨: 30 12월 2022
- 활성화: 15
Uses a trend filter to plot the lines and arrows.
Great for scalping.
Settings:
TrendPeriod: change to your preference.
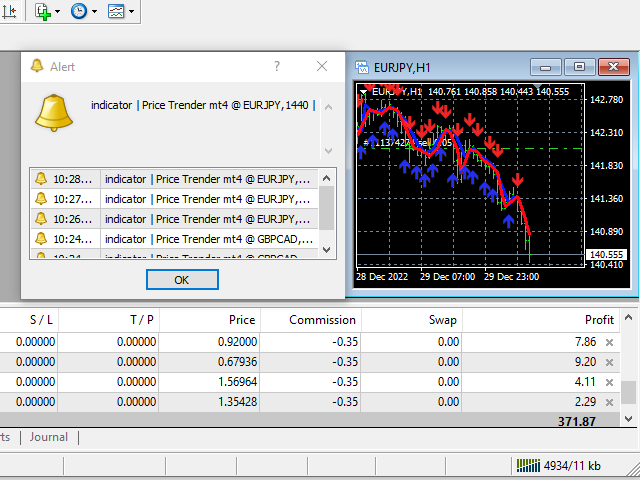
Alerts.
How to use:
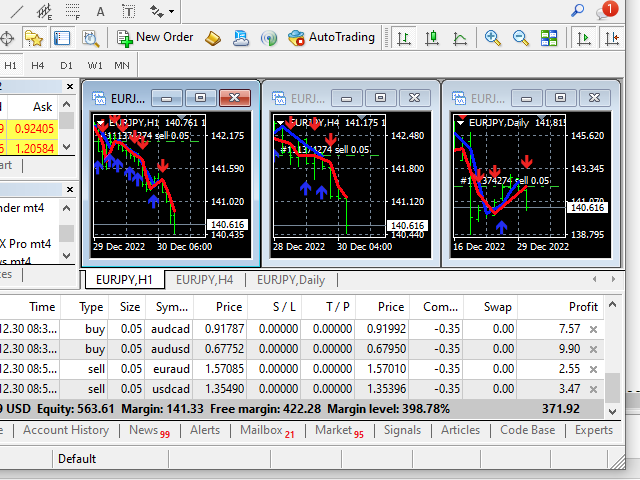
Can be used on any time frame.
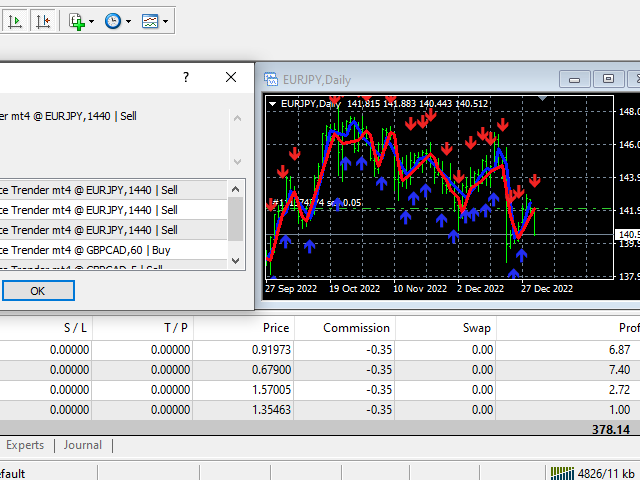
Attached to chart, and wait for arrow to appear on multiple timeframes.
Buy:
- Blue arrow and blue line cross below price on multiple time frames; e.g., on D,W,M or H1,H4,Daily or M30,H1,H4
Sell:
- Yellow arrow and red line cross above price on multiple time frames; e.g., on D,W,M or H1, H4, Daily or M30,H1,H4**Best results when checking more than 3 time frames before entering trades.
**Always check the higher time frames before entering trades on the lower time frames.
**Best results on higher time frames.
Or backtest and use as you see fit for your strategy.
Best results on Major Pairs, but can also be used on other pairs (Metals, Minors).
Important to note:
-
Please do not use this indicator haphazardly. Make sure it compliments your strategy.
-
Don't risk money you cannot afford to lose.
-
You use this indicator at your own risk. Please apply money management wisely.
-
Always test your strategy on a demo account before using a new indicator on a live account.