• 미리보기
  • 리뷰 (1)
  • 코멘트
  • 새 소식

CCI Alert

100 % PER MONTH PROFIT----MY NEW SIGNAL HERE -------> https://www.mql5.com/en/signals/2162238?source=Site+Signals+My#


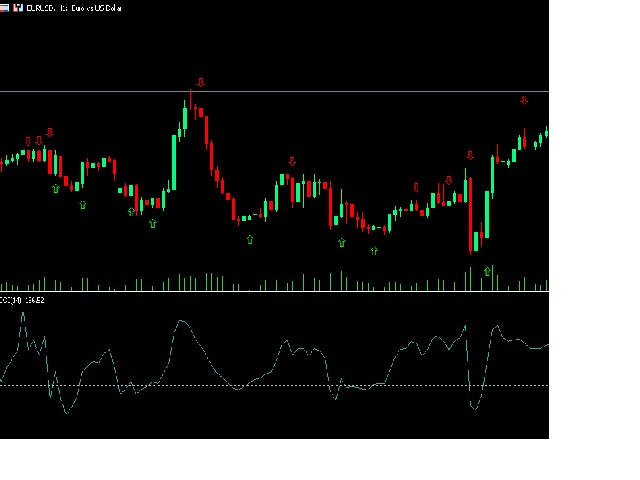
The Commodity Channel Index (CCI) measures the current price level relative to an average price level over a given period of time. CCI is relatively high when prices are far above their average. CCI is relatively low when prices are far below their average. Using this method, CCI can be used to identify overbought and oversold levels.


You can set the period of CCI.
The indicator gives an alert when price crosses below the up level of 100 ,and crosses above down level of -100 ( you can customize the 2 levels in the parameters )

HAPPY TRADING :)

추천 제품
Gekko ADX Plus
Rodrigo Galeote
This is Gekko's Cutomized Cutomized Average Directional Index (ADX), a customized version of the famous ADX indicator. Use the regular ADX and take advantage two entry signals calculations and different ways of being alerted whenever there is potential entry or exit point. Inputs Period: Period for the ADX calculation; PlotSignalType: How will the indicator calculate entry (swing) signals: 1- ShowSwingsOnTrendLevel : Show Signals for Trend Confirmation Swings; 2- ShowSwingsOnTrendLevelDirectio
Donchian Channel DC
Renato Takahashi
Donchian Channel DC is the indicator of Donchian Channels, that plots maximum and minimum values of a specific period, besides mean value line. It´s possible to configure simple period for analysis and the indicator will plot all three values. You can trade with this indicator as trend or reversal, according to each strategy. Do not let to test others indicators as soon as others expert advisors.
Half ma
Artem Svistunov
The Half ma arrow indicator for the MetaTrader 5 trading terminal is a simple but effective tool that gives a signal about a change in the current trend. The Half ma indicator looks like a solid dynamic line that changes color at the points where the trend changes. At these points, the indicator draws arrows of the corresponding color and direction.The Half ma arrow indicator for the MT5 terminal is not an independent source of input signals. It will be most effective to use it as a trend filte
Macd Rsi
Ignacio Agustin Mene Franco
macd rsi It is a macd indicator added to the rsi to capture perfect entries in the average crossovers! As seen in the indicator, it has 2 lines, one of gold color and the other violet line, where the cross of the violet with the gold downwards is a sell signal when it crosses the violet up from the gold it is a buy signal! very good to make shorts works for forex markets and synthetic indices It is used in any temporality! Good profit! World Investor.
Renko Plus
Eadvisors Software Inc.
With Renko Plus you can use the features in the Indicator functionality, just add it to the Metatrader5 chart.             The Renko chart is a type of chart, developed by the Japanese, that is constructed using price movement rather than standardized prices and time intervals like most charts. It is believed to be named after the Japanese word for bricks, "renga", as the graphic looks like a series of bricks.             A new brick is created when the price moves a specified p
Mitimom
Danil Poletavkin
The indicator is based on Robert Miner's methodology described in his book "High probability trading strategies" and displays signals along with momentum of 2 timeframes. A Stochastic oscillator is used as a momentum indicator. The settings speak for themselves period_1 is the current timeframe, 'current' period_2 is indicated - the senior timeframe is 4 or 5 times larger than the current one. For example, if the current one is 5 minutes, then the older one will be 20 minutes The rest of the
FREE
Follow The Line MT5
Oliver Gideon Amofa Appiah
4.4 (30)
This indicator obeys the popular maxim that: "THE TREND IS YOUR FRIEND" It paints a GREEN line for BUY and also paints a RED line for SELL. (you can change the colors). It gives alarms and alerts of all kinds. IT DOES NOT REPAINT and can be used for all currency pairs and timeframes. Yes, as easy and simple as that. Even a newbie can use it to make great and reliable trades. NB: For best results, get my other premium indicators for more powerful and reliable signals. Get them here: https://www.m
FREE
Trend Bands 5
Leonid Basis
Bands are a form of technical analysis that traders use to plot trend lines that are two standard deviations away from the simple moving average price of a security. The goal is to help a trader know when to enter or exit a position by identifying when an asset has been overbought or oversold. This indicator will show upper and lover bands. You can change input parameters nPeriod and  nMethod to calculate those bands for each timeframe. Aqua clouds represent up or down trends.
A professional tool for trading - the divergence indicator between the  RVI and the price, which allows you to receive a signal about a trend reversal in a timely manner or catch price pullback movements (depending on the settings). The indicator settings allow you to adjust the strength of the divergence due to the angle of the  RVI peaks and the percentage change in price, which makes it possible to fine-tune the signal strength. The indicator code is optimized and is tested very quickly as p
FREE
Gino Renko
Stephane, Andr Valette
1 (1)
Another renko-based indicator. It returns different usable values ​​for an EA, and is directly displayed on the main chart. Its setting is very simple: The size of the renko The number of bars taken into account The falling color The color on the rise Returned values: Buffer 0 : Value of the middle Buffer 1 : Value of the Top Buffer 2 : Value of the Bottom Buffer 3 : Direction of renko (0.0 for top ; 1.0 for bottom) Buffer 4 : Ratio of the renko, for example, if it is twice, 3 times, ro more of
Индикатор iVeles_Perfect_Oscilator является опережающим и одним из самых лучших осциляторов на сегодняшний день,  использует специализированный расчет текущих цен графика.  Очень качественно и своевременно показывает смену направления, очень точный подход к уровням перекупленности и перепроданности, что позволяет своевременно принять решение по сделке.  Работает качественно на любом ТФ и с любым инструментом. Параметры: Period - период расчетов Average  - усреднение  МА Method - применяемый мето
ZigZag Wave Entry Alert MT5
Azad Amanuel Gorgis Gorgis
The ZigZag Wave Entry Alert** indicator, created by Azad Gorgis in 2024, is designed for MetaTrader 5 and aims to provide traders with entry signals based on ZigZag patterns. Here's a brief overview of its functionality and key features: Functionality: - Detection of ZigZag Patterns: The indicator identifies significant price movements and outlines potential ZigZag patterns on the chart. It detects new highs and lows based on user-defined parameters such as Depth, Deviation, and Backstep. -
The indicator plots "round" levels, the step of which is specified in the settings. Perfect as an addition to any trading systems. Very low price - only $30! Round levels often become price support or resistance. MT4 version:  https://www.mql5.com/en/market/product/67245 This allows you to either fix a profit, or open a position after a breakdown of the level, work towards a rebound in price. Support: https://www.mql5.com/en/channels/TrendHunter The indicator will be an excellent tool in a
JAC Trend Color Candle
Eduardo Da Costa Custodio Santos
The indicator "JAC Trend Color Candle" for Meta Trader 5, was created to visually facilitate the trend for the trader. It is based on three parameters, which identifies the uptrend, downtrend and non-trending market. The colors are trader-configurable, and the average trader-configurable as well. trend parameters cannot be configured as they are the indicator's differential.
Multi-timeframe trend indicator based on the ADX / ADXWilder indicator with Fibonacci levels The indicator shows trend areas using ADX or ADXWilder indicator data from multiple timeframes. The impulse mode of the indicator allows you to catch the beginning of a trend, and several "Screens" with different timeframes allow you to filter out market noise. Fibonacci levels are added to the price chart, which have flexible settings. How the indicator works: if PDI is greater than NDI, then   it`
FREE
Renko System
Marco Montemari
This indicator can be considered as a trading system. It offers a different view to see the currency pair: full timeless indicator, can be used for manual trading or for automatized trading with some expert advisor. When the price reaches a threshold a new block is created according to the set mode. The indicator beside the Renko bars, shows also 3 moving averages. Features renko mode median renko custom median renko 3 moving averages wicks datetime indicator for each block custom notificatio
The Turning point of price indicator displays assumed turning points of the price on the chart. It is based on data of the Prise Reversal oscillator and standard ADX. When the value of Prise Reversal is in overbought or oversold area (area size is set by a user), and the value of the ADX main line exceeds the preset value, the Turning point of price indicator draws an arrow pointed to the further assumed price movement. This idea is described in the article Indicator of Price Reversal . Inputs
Reversal Candles MT5
Nguyen Thanh Cong
5 (2)
Introduction Reversal Candles is a cutting-edge non-repainting   forex indicator designed to predict price reversals with remarkable accuracy through a sophisticated combination of signals. Signal Buy when the last closed candle has a darker color (customizable) and an up arrow is painted below it Sell when the last closed candle has a darker color (customizable) and a down arrow is painted above it
FREE
What is this indicator? This indicator is the MACD (Moving Average Convergence/Divergence) supporting Virtual Trading mode of  Knots Compositor . When the mode is turned on, the indicator will be recalculated based on the displayed candlesticks. When the mode is turned off, the indicator will be recalculated based on the original chart candlesticks. Types of the applied price - Close - Open - High - Low - Median Price (HL/2) - Typical Price (HLC/3) - Weighted Price (HLCC/4) KC-Indicators
FREE
HMA Color with Alerts MT5
Pavel Zamoshnikov
4.73 (51)
Hull Moving Average (HMA) is well-deservedly popular among traders because of the effective averaging of market noise and a relatively small delay. The current MetaTrader 5 version changes its color when the movement direction changes. Sound and text signals are available. It also supports sending email and push messages. It is possible to trigger a signal on the current incomplete bar, although such a signal may be canceled before completion if conditions are no longer appropriate. One of the p
FREE
UPD1 X00 Levels MT5
Vitaliy Kuznetsov
5 (1)
인디케이터는 차트의 라운드 레벨을 보여줍니다. 심리적, 뱅킹 또는 주요 플레이어 레벨이라고도 합니다. 이 수준에서 황소와 곰 사이에 실제 싸움이 있고 많은 주문이 누적되어 변동성이 증가합니다. 표시기는 모든 악기와 기간에 따라 자동으로 조정됩니다. 80레벨을 돌파하고 테스트를 하면 구매합니다. 20레벨 돌파 후 테스트 하면 판매합니다. 목표는 00입니다. 주목. 강력한 지원 및 저항 수준으로 인해 가격이 00 수준을 약간 놓칠 수 있습니다. 입력 매개변수. Bars Count - 라인 길이. Show 00 Levels - 00 레벨을 표시하거나 표시하지 않음. Show 10, 90 Levels. Show 20, 80 Levels. Show 30, 70 Levels. Show 40, 60 Levels. Show 50 Levels. N Lines - 차트의 레벨 수를 제한하는 매개변수. Distance 00 Levels - 레벨 사이의 거리(자동 또는 수동). Line Posi
FREE
Ichimoku Signals Pro
Shahabeddin Baset
Features All Ichimoku Signals (Selectable) : Display all reliable signals generated by the Ichimoku indicator. You can choose which signals to view based on your preferences. Filter by Signal Strength : Sort signals by their strength—whether they are weak, neutral, or strong. Live Notifications : Receive real-time notifications for Ichimoku signals. Transparent Cloud : Visualize the Ichimoku cloud in a transparent manner. Available Signals Tenkensen-Kijunsen Cross Price-Kijunsen Cross Pri
이 지표는 단일 캔들에 대해 매도 및 매도(공격) 체결된 계약 간의 차이를 감지합니다. 지표는 가격 차트 아래의 전용 창에 판매 및 구매 계약의 차이에 의해 정확하게 주어진 양초를 표시하며, 이는 시장의 체적 강도를 생성합니다. 누적 촛대 델타 차트만 선택하는 방법 또는 양초 자체의 추세선을 선택하는 방법이 가능합니다(스크린샷 참조): 두 번째 상자 u "없음"을 선택하면 추세선이 그려지지 않고 색상을 선택하면, 체적 양초의 추세선이 차트에 함께 나타납니다. 이 표시기는 무엇을 위한 것입니까? 가격 차트를 체적 델타 차트와 비교하면 시장의 진정한 강점을 볼 수 있습니다. 두 차트의 수렴은 가격의 올바른 상승/하강을 결정하는 반면 가격과 체적 델타 간의 발산은 신호 경고여야 합니다 가격이 반전되어야 하기 때문입니다. 이 지표는 잘못된 신호를 필터링하고 가격과 거래량 사이의 분기 단계에서 발생하는 신호를 제거하기 위해 거래 전략과 함께 사용해야 합니다. 주의: 이 표시기
Panic Meter limited
Dmitriy Gurenko
3.5 (2)
The indicator measures the frequency of incoming ticks to analyze the market activity. Bullish and bearish ticks are analyzed separately, informing about the currently predominant market sentiment. According to observations, an increase in the frequency of ticks (panic) indicates the beginning of strong price changes, and an increase in the frequency of ticks in a particular direction not only accompanies a price change in this direction, but also often anticipates it. The indicator is indispens
FREE
TrendDetect
Pavel Gotkevitch
The Trend Detect indicator combines the features of both trend indicators and oscillators. This indicator is a convenient tool for detecting short-term market cycles and identifying overbought and oversold levels. A long position can be opened when the indicator starts leaving the oversold area and breaks the zero level from below. A short position can be opened when the indicator starts leaving the overbought area and breaks the zero level from above. An opposite signal of the indicator can
Qunity ADX Trend
Rodion Kachkin
Trend indicator based on the ADX / ADXWilder indicator The indicator shows trend areas using ADX or ADXWilder indicator data. How the indicator works: if PDI is greater than NDI, then it`s bullish movement; if PDI is less than NDI, then it`s bearish movement; if ADX is less than or equal to the filter value specified in the parameters, then there is no movement state. Input parameters of the indicator: Calculate Timeframe - timeframe for calculation; ADX Type - type of ADX calculation
FREE
The indicator detects and displays М. Gartley's Butterfly pattern. The pattern is plotted by the extreme values of the ZigZag indicator (included in the resources, no need to install). After detecting the pattern, the indicator notifies of that by the pop-up window, a mobile notification and an email. The pattern and wave parameters are displayed on the screenshots. The default parameters are used for demonstration purposes only in order to increase the amount of detected patterns. Parameters
This indicator is a zero-lag indicator and displays  strength of trend change . True Trend  Oscillator Pro works best in combination with True Trend Moving Average Pro that displays exact trend as is. Oscillator value is exact price change in given direction of the trend. True Trend Moving Average Pro: https://www.mql5.com/en/market/product/103586 If you set PERIOD input parameter to 1 this indicator becomes a sharpshooter for binary options. Developers can use True Trend Oscillator in E
FREE
A professional tool for trading - the divergence indicator between the WPR and the price, which allows you to receive a signal about a trend reversal in a timely manner or catch price pullback movements (depending on the settings). The indicator settings allow you to adjust the strength of the divergence due to the angle of the WPR peaks and the percentage change in price, which makes it possible to fine-tune the signal strength. The indicator code is optimized and is tested very quickly as par
FREE
Ice up
Ignacio Agustin Mene Franco
Ice Up. It is an indicator where it fulfills the professional function of a zigzag together with support and resistance. Perfect for grabbing long and short trends. In the new version of Ice, it improves the pivots to %100. works for all seasons It works for forex and synthetic indices, and if the broker also has crypto. works for all forex pairs and synthetic indices.
이 제품의 구매자들이 또한 구매함
우선 이 거래 시스템이 리페인팅, 리드로잉 및 레이그 인디케이터가 아니라는 점을 강조하는 것이 중요합니다. 이는 수동 및 로봇 거래 모두에 이상적인 것으로 만듭니다. "스마트 트렌드 트레이딩 시스템 MT5"은 새로운 및 경험이 풍부한 트레이더를 위해 맞춤형으로 제작된 종합적인 거래 솔루션입니다. 10개 이상의 프리미엄 인디케이터를 결합하고 7개 이상의 견고한 거래 전략을 특징으로 하여 다양한 시장 조건에 대한 다목적 선택이 가능합니다. 트렌드 추종 전략: 효과적인 트렌드 추이를 타기 위한 정확한 진입 및 손절 관리를 제공합니다. 반전 전략: 잠재적인 트렌드 반전을 식별하여 트레이더가 범위 시장을 활용할 수 있게 합니다. 스캘핑 전략: 빠르고 정확한 데이 트레이딩 및 단기 거래를 위해 설계되었습니다. 안정성: 모든 인디케이터가 리페인팅, 리드로잉 및 레이그가 아니므로 신뢰할 수 있는 신호를 보장합니다. 맞춤화: 개별 거래 선호도를 고려한 맞춤형 전략을 지원합니다. 최상의 전략을 찾는
Atomic Analyst MT5
Issam Kassas
5 (12)
우선적으로 언급할 점은이 거래 지표가 다시 그리지 않고 지연되지 않으며 이를 통해 수동 및 로봇 거래 모두에 이상적이라는 점입니다. Atomic Analyst는 가격의 강도와 모멘텀을 활용하여 시장에서 더 나은 이점을 찾는 PA Price Action Indicator입니다. 고급 필터를 장착하여 잡음과 거짓 신호를 제거하고 거래 잠재력을 높이는 데 도움이 됩니다. 복잡한 지표의 다중 레이어를 사용하여 Atomic Analyst는 차트를 스캔하고 복잡한 수학적 계산을 간단한 신호와 색상으로 변환하여 초보 트레이더가 이해하고 일관된 거래 결정을 내릴 수 있도록합니다. "Atomic Analyst"는 새로운 및 경험이 풍부한 트레이더를위한 종합적인 거래 솔루션입니다. 프리미엄 지표와 최고 수준의 기능을 하나의 거래 전략에 결합하여 모든 종류의 트레이더에 대한 다재다능한 선택지가되었습니다. 인트라데이 거래 및 스캘핑 전략 : 빠르고 정확한 일일 거래 및 단기 거래를 위해 설계
Quantum Trend Sniper
Bogdan Ion Puscasu
5 (37)
소개       Quantum Trend Sniper Indicator는   추세 반전을 식별하고 거래하는 방식을 변화시키는 획기적인 MQL5 지표입니다! 13년 이상의 거래 경험을 가진 숙련된 트레이더 팀이 개발한       Quantum Trend Sniper 표시기       매우 높은 정확도로 추세 반전을 식별하는 혁신적인 방법으로 거래 여정을 새로운 차원으로 끌어올리도록 설계되었습니다. ***Quantum Trend Sniper Indicator를 구입하면 Quantum Breakout Indicator를 무료로 받을 수 있습니다!*** Quantum Trend Sniper Indicator는 추세 반전을 식별하고 세 가지 이익실현 수준을 제안할 때 경고, 신호 화살표를 제공합니다. 초보자 거래자와 전문 거래자 모두에게 적합합니다. Quantum EA 채널:       여기를 클릭하세요 MT4 버전:       여기를 클릭하세요
FX Volume MT5
Daniel Stein
4.94 (17)
모닝 브리핑을 통해 세부 정보와 스크린샷으로 매일 시장 업데이트를 받으세요 여기 mql5 및 텔레그램에서 FX 거래량은 브로커의 관점에서 시장 심리에 대한 실제 통찰력을 제공하는 최초이자 유일한 거래량 지표입니다. 브로커와 같은 기관 시장 참여자가 외환 시장에서 어떤 포지션을 취하고 있는지에 대한 훌륭한 통찰력을 COT 보고서보다 훨씬 빠르게 제공합니다. 차트에서 이 정보를 직접 확인하는 것은 트레이딩의 진정한 판도를 바꾸고 획기적인 솔루션입니다. 다음과 같은 고유한 시장 데이터 인사이트의 이점 비율 는 통화의 매수/매도 포지션 비율을 백분율로 표시 비율 변화 는 선택한 기간 내 매수 비율과 비율 변화를 표시 총 거래량 는 해당 통화의 총 거래량(롱 및 숏)을 로트 단위로 보여줍니다 Volumes Long 는 해당 통화의 모든 롱 포지션의 거래량을 보여줍니다 Volumes Short 는 해당 통화의 모든 숏 포지션의 거래량을 보여줍니다 Net Long 는 순 롱 포지션의 거래량
우선적으로, 이 거래 도구는 전문적인 거래에 이상적인 비-다시 그리기 및 지연되지 않는 지표입니다.  스마트 가격 액션 컨셉트 인디케이터는 신규 및 경험 많은 트레이더 모두에게 매우 강력한 도구입니다. Inner Circle Trader Analysis 및 Smart Money Concepts Trading Strategies와 같은 고급 거래 아이디어를 결합하여 20가지 이상의 유용한 지표를 하나로 결합합니다. 이 인디케이터는 스마트 머니 컨셉트에 중점을 두어 대형 기관의 거래 방식을 제공하고 이동을 예측하는 데 도움을 줍니다.  특히 유동성 분석에 뛰어나 기관이 어떻게 거래하는지 이해하는 데 도움을 줍니다. 시장 트렌드를 예측하고 가격 변동을 신중하게 분석하는 데 탁월합니다. 귀하의 거래를 기관 전략에 맞추어 시장의 동향에 대해 더 정확한 예측을 할 수 있습니다. 이 인디케이터는 시장 구조를 분석하고 중요한 주문 블록을 식별하고 다양한 패턴을 인식하는 데 뛰어납니다. 
Advanced Supply Demand MT5
Bernhard Schweigert
4.53 (15)
현재 33% 할인! 초보자나 전문 트레이더를 위한 최고의 솔루션! 이 보조지표는 우리가 다수의 독창적 기능과 새로운 공식을 통합한 독특하고 고품질이며 저렴한 거래 도구입니다. 이 업데이트를 통해 이중 시간대를 표시할 수 있습니다. 더 높은 TF를 표시할 수 있을 뿐만 아니라 차트 TF와 더 높은 TF 모두를 표시할 수 있습니다: 중첩 영역 표시. 모든 Supply Demand 트레이더들이 좋아할 것입니다. :) 중요한 정보 공개 Advanced Supply Demand의 잠재력을 극대화하려면 다음을 방문하십시오. https://www.mql5.com/ko/blogs/post/720245   진입 또는 목표의 명확한 트리거 포인트를 정확히 찾아냄으로 해서 거래가 어떻게 개선될지 상상해 보십시오. 새로운 알고리즘을 기반으로 매수자와 매도자 간의 잠재적인 불균형을 훨씬 더 쉽게 분간할 수 있습니다. 왜냐하면 가장 강한 공급영역과 가장 강한 수요 영역과 과거에 어떻게 진행 되었는지를(이
TPSpro RFI Levels MT5
Roman Podpora
5 (5)
A key element in trading is zones or levels from which decisions to buy or sell a trading instrument are made. Despite attempts by major players to conceal their presence in the market, they inevitably leave traces. Our task was to learn how to identify these traces and interpret them correctly. Reversal First Impulse levels (RFI)   -  Version MT4                  INSTRUCTIONS                 RUS                 ENG                         R ecommended to use with an indicator   -  TREND PRO  
AW Trend Predictor MT5
AW Trading Software Limited
4.76 (55)
하나의 시스템에서 추세와 고장 수준의 조합입니다. 고급 지표 알고리즘은 시장 노이즈를 필터링하고 추세, 진입점 및 가능한 출구 수준을 결정합니다. 표시기 신호는 통계 모듈에 기록되어 가장 적합한 도구를 선택하여 신호 기록의 효율성을 보여줍니다. 이 표시기는 이익 실현 및 손절매 표시를 계산합니다. 매뉴얼 및 지침 ->   HERE   / MT4 버전 ->   HERE 지표로 거래하는 방법: Trend Predictor로 거래하는 것은 3단계로 간단합니다. 1단계 - 포지션 열기 70% 이상의 성공률로 매수 신호를 받았습니다. 2단계 - StopLoss 결정 반대 신호로 트렁크 선택 3단계 - 이익 실현 전략 정의 전략 1: TP1 도달 시 전체 포지션 청산 전략 2: TP1 도달 시 포지션의 50% 청산 및 TP2 도달 시 나머지 50% 청산 전략 3: 추세 반전 시 전체 포지션 청산 이익: 결과를 다시 그리지 않음, 신호는 엄격하게 양초가 닫힐 때 어드바이저에서 사용할 수 있습니
TPSproTREND PrO MT5
Roman Podpora
5 (5)
TPSpro TRENDPRO  - is a trend indicator that automatically analyzes the market and provides information about the trend and each of its changes, as well as giving signals for entering trades without redrawing! The indicator uses each candle, analyzing them separately. referring to different impulses - up or down impulse. Exact entry points into transactions for currencies, crypto, metals, stocks, indices!  -  Version MT4                  DETAILED DESCRIPTION        /       TRADING SETUPS       
FX Power MT5 NG
Daniel Stein
5 (4)
모닝 브리핑 여기 mql5 와 텔레그램에서 FX Power MT5 NG 는 오랫동안 인기 있는 통화 강도 측정기인 FX Power의 차세대 버전입니다. 이 차세대 강도 측정기는 무엇을 제공합니까? 기존 FX Power에서 좋아했던 모든 것 PLUS GOLD/XAU 강도 분석 더욱 정밀한 계산 결과 개별 구성 가능한 분석 기간 더 나은 성능을 위한 사용자 정의 가능한 계산 한도 특별 멀티더 많은 것을보고 싶은 사람들을위한 특별한 다중 인스턴스 설정 모든 차트에서 좋아하는 색상을위한 끝없는 그래픽 설정 수많은 알림 옵션, 중요한 것을 다시는 놓치지 않도록 Windows 11 및 macOS 스타일의 둥근 모서리가 있는 새로운 디자인 마법처럼 움직이는 인디케이터 패널 FX 파워 키 특징 모든 주요 통화의 완전한 강세 이력 모든 시간대에 걸친 통화 강세 이력 모든 브로커 및 차트에서 고유 계산 결과 100% 신뢰할 수있는 실시간100 % 신뢰할 수있는 실시간 계산-> 다시 칠하지 않음
Entry Points Pro for MT5
Yury Orlov
4.54 (157)
다시 색을 칠하지 않고 거래에 진입할 수 있는 정확한 신호를 제공하는 MT5용 지표입니다. 외환, 암호화폐, 금속, 주식, 지수 등 모든 금융 자산에 적용할 수 있습니다. 매우 정확한 추정값을 제공하고 매수와 매도의 가장 좋은 시점을 알려줍니다. 하나의 시그널로 수익을 내는 지표의 예와 함께 비디오 (6:22)시청하십시오! 대부분의 거래자는 Entry Points Pro 지표의 도움으로 첫 거래 주 동안 트레이딩 결과를 개선합니다. 저희의   Telegram Group 을 구독하세요! Entry Points Pro 지표의 좋은점. 재도색이 없는 진입 신호 신호가 나타나고 확인되면(시그널 캔들이 완성된 경우) 신호는 더 이상 사라지지 않습니다. 여타 보조지표의 경우 신호를 표시한 다음 제거되기 때문에 큰 재정적 손실로 이어집니다. 오류 없는 거래 게시 알고리즘을 통해 트레이드(진입 또는 청산)를 할 이상적인 순간을 찾을 수 있으며, 이를 통해 이를 사용하는 모든 거래자의
RelicusRoad Pro MT5
Relicus LLC
4.82 (22)
이제 $ 147 (몇 가지 업데이트 후 $ 499 증가) - 무제한 계정 (PCS 또는 MACS) RelicusRoad 사용 설명서 + 교육 비디오 + 비공개 Discord 그룹 액세스 + VIP 상태 시장을 보는 새로운 방법 RelicusRoad는 외환, 선물, 암호화폐, 주식 및 지수에 대한 세계에서 가장 강력한 거래 지표로서 거래자에게 수익성을 유지하는 데 필요한 모든 정보와 도구를 제공합니다. 우리는 초보자부터 고급까지 모든 거래자가 성공할 수 있도록 기술적 분석 및 거래 계획을 제공합니다. 미래 시장을 예측할 수 있는 충분한 정보를 제공하는 핵심 거래 지표입니다. 우리는 차트에서 말이 안 되는 여러 지표 대신 완전한 솔루션을 믿습니다. 타의 추종을 불허하는 매우 정확한 신호, 화살표 + 가격 조치 정보를 표시하는 올인원 표시기입니다. 강력한 AI를 기반으로 하는 RelicusRoad는 누락된 정보와 도구를 제공하여 교육하고 성공적인 트레이더인 트레이딩 전문
Gartley Hunter Multi
Siarhei Vashchylka
5 (5)
Gartley Hunter Multi - An indicator for searching for harmonic patterns simultaneously on dozens of trading instruments and on all classic timeframes: (m1, m5, m15, m30, H1, H4, D1, Wk, Mn). Manual (Be sure to read before purchasing) | Version for MT4 Advantages 1. Patterns: Gartley, Butterfly, Shark, Crab. Bat, Alternate Bat, Deep Crab, Cypher 2. Simultaneous search for patterns on dozens of trading instruments and on all classic timeframes 3. Search for patterns of all possible sizes. Fr
Noize Absorption Index
Ekaterina Saltykova
Noize Absorption Index - is the manual trading system that measures the difference of pressure between bears forces and bulls forces. Green line - is a noize free index that showing curent situation. Zero value of index shows totally choppy/flat market.Values above zero level shows how powerfull bullish wave is and values below zero measures bearish forces.Up arrow appears on bearish market when it's ready to reverse, dn arrow appears on weak bullish market, as a result of reverse expectation.
ICT, SMC, SMART MONEY CONCEPTS, SMART MONEY, Smart Money Concept, Support and Resistance, Trend Analysis, Price Action, Market Structure, Order Blocks, BOS/CHoCH,   Breaker Blocks ,  Momentum Shift,   Supply&Demand Zone/Order Blocks , Strong Imbalance,   HH/LL/HL/LH,    Fair Value Gap, FVG,  Premium  &   Discount   Zones, Fibonacci Retracement, OTE, Buy Side Liquidity, Sell Side Liquidity, BSL/SSL Taken, Equal Highs & Lows, MTF Dashboard, Multiple Time Frame, BigBar, HTF OB, HTF Market Structure
Professional Scalping Tool on Deriv Attention! The indicator will be sold in limited quantities!!! The previous 5 copies were sold for $250 The next 5 copies will be sold for $350 The next price is $500 Description: This trading indicator is designed for professional traders focused on scalping. Designed with the market in mind, it provides highly accurate spike trading signals. It works on the M1 timeframe and supports the following symbols: Boom 300 Index, Boom 500 Index, Boom 1000 Index,
Volume by Price MT5
Brian Collard
5 (3)
The Volume by Price Indicator for MetaTrader 5 features Volume Profile and Market Profile TPO (Time Price Opportunity). Get valuable insights out of currencies, equities and commodities data. Gain an edge trading financial markets. Volume and TPO histogram bar and line charts. Volume Footprint charts. TPO letter and block marker charts including split structures. Versatile segmentation and compositing methods. Static, dynamic and flexible ranges with relative and/or absolute visualizations. Lay
MetaForecast M5
Vahidreza Heidar Gholami
5 (2)
MetaForecast는 가격 데이터의 조화를 기반으로 모든 시장의 미래를 예측하고 시각화합니다. 시장이 항상 예측 가능한 것은 아니지만 가격에 패턴이 있다면 MetaForecast는 가능한 정확하게 미래를 예측할 수 있습니다. 다른 유사한 제품과 비교했을 때, MetaForecast는 시장 동향을 분석하여 더 정확한 결과를 생성할 수 있습니다. 입력 매개변수 Past size (과거 크기) MetaForecast가 미래 예측을 생성하기 위한 모델을 만드는 데 사용하는 막대의 수를 지정합니다. 모델은 선택한 막대 위에 그려진 노란색 선으로 표시됩니다. Future size (미래 크기) 예측해야 할 미래 막대의 수를 지정합니다. 예측된 미래는 핑크색 선으로 표시되며 그 위에 파란색 회귀선이 그려집니다. Degree (차수) 이 입력은 MetaForecast가 시장에서 수행할 분석 수준을 결정합니다. Degree 설명  0 차수 0의 경우, "Past size" 입력에 모든 봉우리
Auto Order Block with break of structure based on ICT and Smart Money Concepts Futures Break of Structure ( BoS )             Order block ( OB )            Higher time frame Order block / Point of Interest ( POI )    shown on current chart           Fair value Gap ( FVG ) / Imbalance   ,  MTF      ( Multi Time Frame )    Volume Imbalance     ,  MTF          vIMB Gap’s Equal High / Low’s     ,  MTF             EQH / EQL Liquidity               Current Day High / Low           HOD /
Quantum Heiken Ashi PRO MT5
Bogdan Ion Puscasu
4.5 (8)
시장 동향에 대한 명확한 통찰력을 제공하도록 설계된 Heiken Ashi 양초는 노이즈를 필터링하고 잘못된 신호를 제거하는 기능으로 유명합니다. 혼란스러운 가격 변동에 작별을 고하고 더 매끄럽고 신뢰할 수 있는 차트 표현을 만나보세요. Quantum Heiken Ashi PRO를 정말 독특하게 만드는 것은 전통적인 촛대 데이터를 읽기 쉬운 색상 막대로 변환하는 혁신적인 공식입니다. 빨간색과 녹색 막대는 각각 약세와 강세 추세를 우아하게 강조하여 잠재적 진입점과 퇴장점을 매우 정확하게 파악할 수 있습니다. Quantum EA 채널:       여기를 클릭하세요 MT4 버전:       여기를 클릭하세요 이 놀라운 지표는 다음과 같은 몇 가지 주요 이점을 제공합니다. 선명도 향상: Heiken Ashi 바는 가격 변동을 완화하여 시장 추세를 보다 명확하게 나타내므로 유리한 거래 기회를 쉽게 식별할 수 있습니다. 소음 감소: 종종 잘못된 신호로 이어지는 불규칙한 가격 변동
Blahtech Supply Demand MT5
Blahtech Limited
4.57 (14)
Was: $299  Now: $99   Supply Demand uses previous price action to identify potential imbalances between buyers and sellers. The key is to identify the better odds zones, not just the untouched ones. Blahtech Supply Demand indicator delivers functionality previously unavailable on any trading platform. This 4-in-1 indicator not only highlights the higher probability zones using a multi-criteria strength engine, but also combines it with multi-timeframe trend analysis, previously confirmed swings
소개       Quantum Breakout PRO   , 브레이크아웃 존 거래 방식을 변화시키는 획기적인 MQL5 지표! 13년 이상의 거래 경험을 가진 숙련된 트레이더 팀이 개발한       퀀텀 브레이크아웃 PRO       혁신적이고 역동적인 브레이크아웃 존 전략으로 거래 여정을 새로운 차원으로 끌어올리도록 설계되었습니다. Quantum Breakout Indicator는 5개의 이익 목표 영역이 있는 브레이크아웃 영역의 신호 화살표와 브레이크아웃 상자를 기반으로 한 손절 제안을 제공합니다. 초보자 거래자와 전문 거래자 모두에게 적합합니다. Quantum EA 채널:       여기를 클릭하세요 중요한! 구매 후 설치 매뉴얼을 받으려면 개인 메시지를 보내주십시오. 추천: 기간: M15 통화쌍: GBPJPY, EURJPY, USDJPY,NZDUSD, XAUUSD 계정 유형: 스프레드가 매우 낮은 ECN, Raw 또는 Razor 브로커 시간: GM
XQ Indicator MetaTrader 5
Marzena Maria Szmit
5 (1)
Step into the realm of Forex trading with confidence and precision using XQ, a cutting-edge Forex indicator designed to elevate your trading game to unprecedented heights. Whether you're a seasoned trader or just stepping into the world of currency exchange, XQ Forex Indicator empowers you with the insights and signals needed to make informed trading decisions. The signal conditions are a combination of three indicators, and XQ Forex Indicator only display  medium and long-term trends . The ind
Owl Smart Levels MT5
Sergey Ermolov
4.49 (37)
MT4 버전  |  FAQ Owl Smart Levels Indicator 는 Bill Williams 의 고급 프랙탈, 시장의 올바른 파동 구조를 구축하는 Valable ZigZag, 정확한 진입 수준을 표시하는 피보나치 수준과 같은 인기 있는 시장 분석 도구를 포함하는 하나의 지표 내에서 완전한 거래 시스템입니다. 시장과 이익을 취하는 장소로. 전략에 대한 자세한 설명 표시기 작업에 대한 지침 고문-거래 올빼미 도우미의 조수 개인 사용자 채팅 ->구입 후 나에게 쓰기,나는 개인 채팅에 당신을 추가하고 거기에 모든 보너스를 다운로드 할 수 있습니다 힘은 단순함에 있습니다! Owl Smart Levels 거래 시스템은 사용하기 매우 쉽기 때문에 전문가와 이제 막 시장을 연구하고 스스로 거래 전략을 선택하기 시작한 사람들 모두에게 적합합니다. 전략 및 지표에는 눈에 보이지 않는 비밀 공식 및 계산 방법이 없으며 모든 전략 지표는 공개되어 있습니다. Owl Smart Levels를
Eng Gold
Ely Alkrar Xshkaky
ENG-GOLD Scalper It is an auxiliary indicator that identifies potential targets and determines the place of entry with a stop loss that works on Heiken Ashi candles  The green lines are usually the targets, the red lines are the stop loss, and the yellow lines are the entry location.  This file is recognized on small and medium frames, usually less than the watch frame I highly recommend using XAUUSD US100 US30 USOIL 
우선적으로 이 거래 시스템은 다시 그리지 않고, 다시 그리지 않으며, 지연되지 않는 것을 강조할 가치가 있습니다. 이는 전문적인 거래에 이상적입니다. "스마트 서포트 앤 레지스턴스 트레이딩 시스템"은 새로운 및 경험 많은 트레이더를 위해 개발된 고급 지표입니다. 이 시스템은 외환 시장에서 정밀도와 신뢰감을 제공합니다. 이 포괄적인 시스템은 일일 거래 전략, 스윙 거래 전략, 지원 및 저항 전략, 캔들스틱 패턴 전략, VWAP 전략, 다중 시간대 추세 전략 등을 포함한 7개 이상의 전략, 10개의 지표 및 다양한 거래 방식을 결합합니다. 이 시스템은 화살표 신호, 진입 및 출구 지점, 거래 경보, 높은 시간대 추세 분석, 실시간 거래 모니터링 및 트렌드 및 볼륨 캔들 색상 제공합니다. 자동 지원 및 저항 감지로 다양한 시장 상황에서 신중한 결정을 돕는 다면적 인 지표입니다. 스마트 서포트 앤 레지스턴스 트레이딩 시스템은 프리미엄 및 강력한 지표 및 도구 모음을 통합한 견고한
Malaysian SNR Levels
Matthias Horst Pieroth
This indicator can be used to display Support and Resistance levels according to  the  Malaysian SNR concept , in which Support and Resistance are exact levels of a line chart. Malaysian SNR There are 3 different horizontal levels in Malaysian SNR: A-Level : This level is located at the peak of this line chart. (shape looks like the letter A) V-Level : Level at the valley of a line chart, (shape looks like the letter V) Gap-Leve l: This level is located at the Close/Open gap between two cand
Blahtech Market Profile MT5
Blahtech Limited
5 (8)
Was: $249  Now: $99   Market Profile defines a number of day types that can help the trader to determine market behaviour. A key feature is the Value Area, representing the range of price action where 70% of trading took place. Understanding the Value Area can give traders valuable insight into market direction and establish the higher odds trade. It is an excellent addition to any system you may be using. Inspired by Jim Dalton’s book “Mind Over Markets”, this indicator is designed to suit the
Gartley Hunter MT5
Siarhei Vashchylka
5 (13)
Gartley Hunter - An indicator for searching for harmonic patterns (Gartley patterns) and their projections. The indicator is equipped with a system of alerts and push notifications. Manual (Be sure to read before purchasing) | Version for MT4 Advantages 1. 12 harmonic patterns: 7 classical and 5 exotic. New patterns will be added as the indicator develops. 2. Constant automatic search for harmonic patterns. The indicator is capable of finding from the smallest to the largest patterns. 3. Autom
초보자 또는 전문가 트레이더를 위한 최고의 솔루션! 이 지표는 우리가 독점 기능과 비밀 공식을 통합했기 때문에 독특하고 고품질이며 저렴한 거래 도구입니다. 단 하나의 차트로 28개 통화 쌍 모두에 대한 경고를 제공합니다. 새로운 추세 또는 스캘핑 기회의 정확한 트리거 포인트를 정확히 찾아낼 수 있기 때문에 거래가 어떻게 개선될지 상상해 보십시오! 새로운 기본 알고리즘을 기반으로 구축되어 잠재적인 거래를 훨씬 더 쉽게 식별하고 확인할 수 있습니다. 이는 통화의 강세 또는 약세가 가속되는지 여부를 그래픽으로 표시하고 가속 속도를 측정하기 때문입니다. 자동차의 속도계처럼 생각하면 됩니다. 가속화할 때 Forex 시장에서 동일한 일이 분명히 더 빠르게 발생합니다. 즉, 반대 방향으로 가속화되는 통화를 페어링하면 잠재적으로 수익성 있는 거래를 식별한 것입니다. 통화 모멘텀의 수직선과 화살표가 거래를 안내합니다! 역동적인 Market Fibonacci 23 레벨은 경고 트리거로 사
제작자의 제품 더 보기
Martina Advisor
Giovanna Talio
100 % PER MONTH PROFIT---- MY NEW SIGNAL HERE ------->   https://www.mql5.com/en/signals/2162238?source=Site+Signals+My# THANKS FOR TRUST IN OUR PRODUCT AND SUPPORT US ! Martina Advisor 2021 is a 100 % Automatic System . Based on severals indicators on different timeframes and a SECRET TRENDING INDICATOR BUILT IN SYSTEM CHARACTERISTICS: TAKE PROFIT AND STOP LOSS FOR EVERY POSITION SIMPLE SETTINGS PLUG AND PLAY  RECOVERING SYSTEM FOR EVERY LOSS STARTING ALSO FROM 560 USD CENTS PASSED STR
GIVE A LOOK TO MY OTHER PRODUCTS ! 100 % PER MONTH PROFIT---- MY NEW SIGNAL HERE ------->   https://www.mql5.com/en/signals/2162238?source=Site+Signals+My# BROKEN TRENDLINE ALERT IS A SIMPLE TOOL INDICATOR. JUST DRAW IN YOUR CHART A DYNAMIC OR STATIC TRENDLINE,AND THE INDICATOR WILL SEND YOU ALERT WHENEVER THE PRICE CROSSES BELOW OR ABOVE YOUR DRAWN TRENDLINE. IT WORKS IN ANY TIMEFRAME AND ANY CHART YOU WANT.JUST GOT A VPS AND DON'T STRESS IN FRONT OF YOUR COMPUTER. FOR ANY KIND OF QUESTION
MACD Cross Alert
Giovanna Talio
GIVE A LOOK TO MY OTHER PRODUCTS ! 100 % PER MONTH PROFIT---- MY NEW SIGNAL HERE ------->   https://www.mql5.com/en/signals/2162238?source=Site+Signals+My#                       MACD Cross Alert is a tool indicator that notificate directly to your phone whenever the signal line crosses the base line. For more accurate signals,crosses are filtered like this : Buy Signal : SIGNAL LINE CROSSES ABOVE BASE LINE AND BOTH ARE ABOVE THE 0 VALUE Sell Signal : SIGNAL LINE CROSSES BELOW BASE LINE AN
Breakout Wall
Giovanna Talio
5 (1)
GIVE A LOOK TO MY OTHER PRODUCTS ! 100 % PER MONTH PROFIT---- MY NEW SIGNAL HERE ------->   https://www.mql5.com/en/signals/2162238?source=Site+Signals+My# Breakout Wall is a very cool indicator. It paints a resistance and a support in the chart given by a "  n  " number of candles ( you can choose the parameter ),and give you an alert when a candle closes below a support or above a resistance.Very important tool if you trade daily candles for example..... Just close your pc and don'
GIVE A LOOK TO MY OTHER PRODUCTS ! 100 % PER MONTH PROFIT---- MY NEW SIGNAL HERE ------->   https://www.mql5.com/en/signals/2162238?source=Site+Signals+My# Double MA Cross Alert,is a cool indicator that notificate you directly on your telephone or email when 2 Moving average ( you choose the parameters ) crosses. This is very important when you want to know a change of trend and you can't stay in front of your pc! The indicator give you the alert just when the next bar opens ,so give you a more
GIVE A LOOK TO MY OTHER PRODUCTS ! 100 % PER MONTH PROFIT---- MY NEW SIGNAL HERE ------->   https://www.mql5.com/en/signals/2162238?source=Site+Signals+My# There are patterns that are more affidable then others.One of the most important is the  engulfing pattern .It is very helpful to understand if there is a change of trend. This indicator find for you affidable engulfing patterns and send you an alert when a pattern is completely formed . To make this alert indicator more reliable,there is a
GIVE A LOOK TO MY OTHER PRODUCTS !                                                          100 % PER MONTH PROFIT---- MY NEW SIGNAL HERE ------->   https://www.mql5.com/en/signals/2162238?source=Site+Signals+My# Morning and evening star are 2 famous and reliable candlestick patterns, very helpful to understand an imminent change of trend. This indicator finds for you this patterns on your chart and send you an alert just when a pattern is 100 % formed. To make this indicator more reliable,y
GIVE A LOOK TO MY OTHER PRODUCTS ! 100 % PER MONTH PROFIT---- MY NEW SIGNAL HERE ------->   https://www.mql5.com/en/signals/2162238?source=Site+Signals+My# The Parabolic SAR (PSAR) helps trader identifying direction of the stock movement and also provides them with the entry and exit. This indicator on the chart appears as a series of dots either above or below the price bars. When the Dots are below the price bar is then the price movement is considered to be bullish and when the Dots are a
100 % PER MONTH PROFIT---- MY NEW SIGNAL HERE ------->   https://www.mql5.com/en/signals/2162238?source=Site+Signals+My# ENGULFING PATTER EA IS AN EXPERT ADVISOR THAT OPENS POSITION BASED ON THE " ENGULFING CANDLESTICK PATTERN "  FREE INDICATOR HERE  ------>>>>   https://www.mql5.com/en/market/product/62135?source=Site+Profile+Seller PLEASE KINDLY NOTE THAT THIS EA IS NOT OPTIMIZED AND WITH STANDARD SET IS NOT PROFITABLE.SO PLEASE OPTIMIZE THIS ROBOT BEFORE GOING LIVE . THE ROBOT OPENS POSITIO
100 % PER MONTH PROFIT---- MY NEW SIGNAL HERE ------->   https://www.mql5.com/en/signals/2162238?source=Site+Signals+My# What Is the Average True Range (ATR)? The average true range (ATR) is a technical analysis indicator, introduced by market technician J. Welles Wilder Jr. in his book   New Concepts in Technical Trading Systems,   that   measures market volatility   by decomposing the entire range of an asset price for that period. The true range indicator is taken as the greatest of the fol
100 % PER MONTH PROFIT---- MY NEW SIGNAL HERE ------->   https://www.mql5.com/en/signals/2162238?source=Site+Signals+My# GENERAL BREAKOUT EXPERT ADVISOR The EA is 100 % automatic.Suitable for FTMO. Works on breakout levels with SL and TP for every position and a system of trailing for bad positions.SL & TP are put in strategic level points automatically by an innovative algo system. It's possible to use a fixed lot for the first position,or a automatic lot.( If you have doubs,just send me a
GIVE A LOOK TO MY OTHER PRODUCTS ! 100 % PER MONTH PROFIT---- MY NEW SIGNAL HERE ------->   https://www.mql5.com/en/signals/2162238?source=Site+Signals+My# Smoothed MA cross alert,is a cool indicator that notificate you directly on your telephone or email when 2 Smoothed Moving average ( you choose the parameters ) crosses. This is very important when you want to know a change of trend and you can't stay in front of your pc! The indicator give you the alert just when the next bar opens ,so give
필터:
LEONARDO NOCERA
1094
LEONARDO NOCERA 2024.01.14 18:58 
 

사용자가 평가에 대한 코멘트를 남기지 않았습니다

리뷰 답변
버전 1.1 2024.01.17
solved some bugs