Noize Absorption Index
- 지표
- Ekaterina Saltykova
- 버전: 1.0
- 활성화: 5
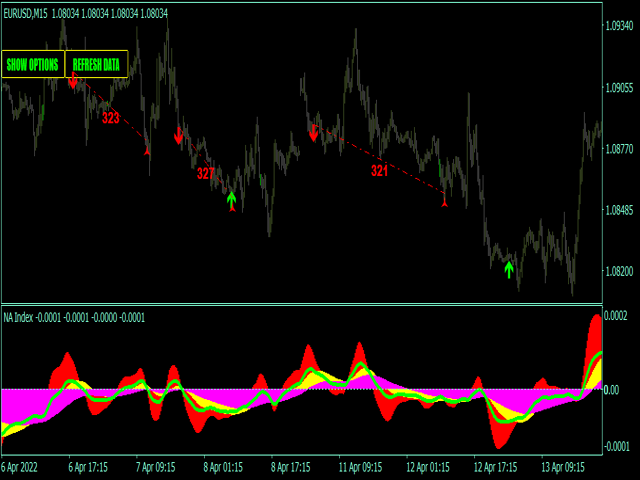
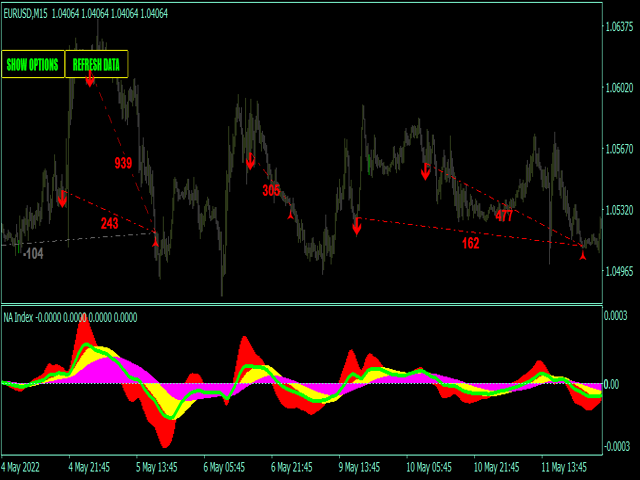
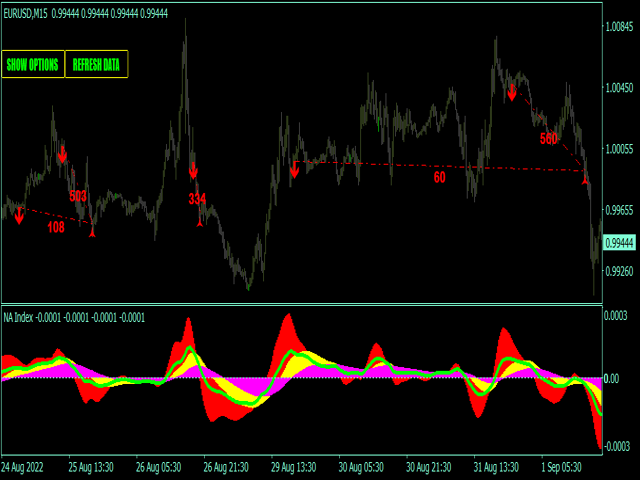
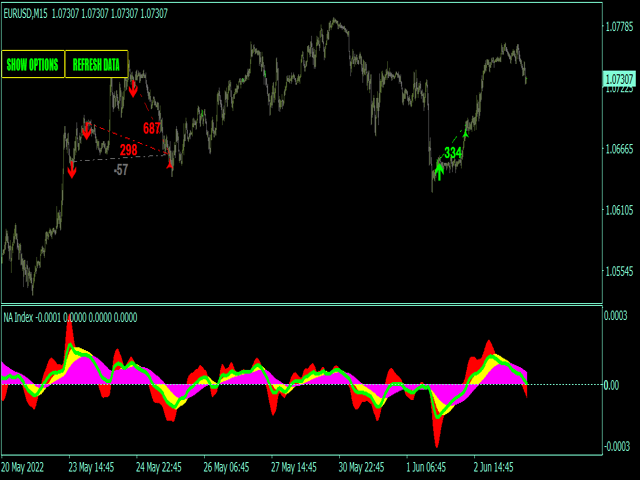
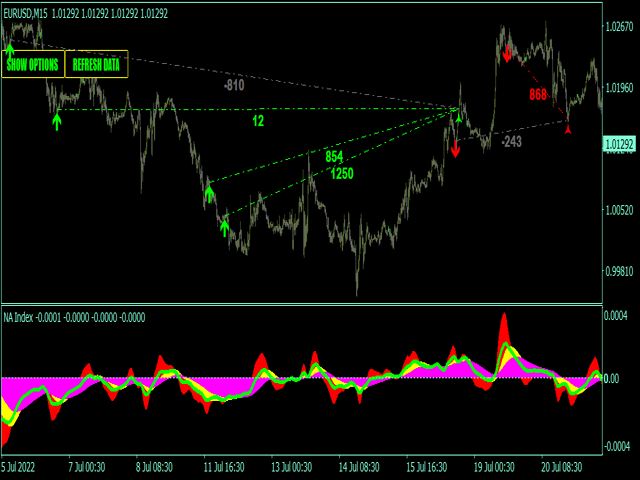
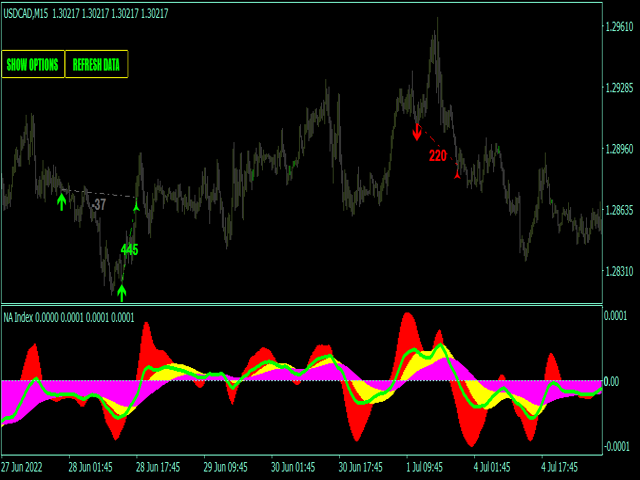
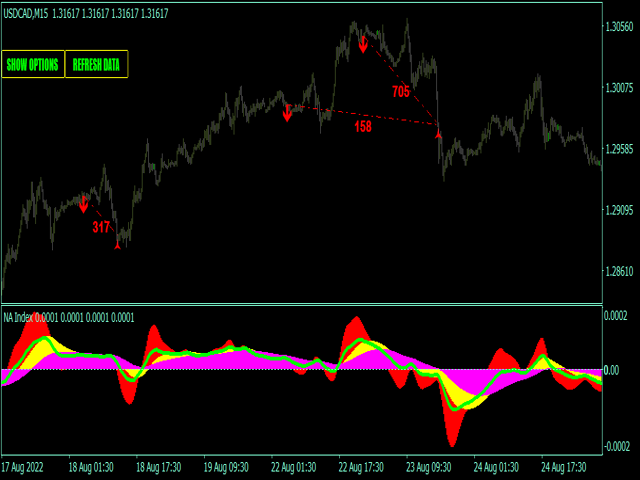
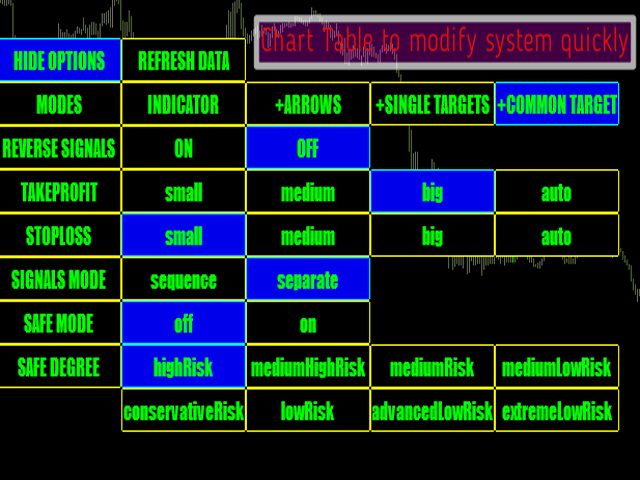
Noize Absorption Index - is the manual trading system that measures the difference of pressure between bears forces and bulls forces. Green line - is a noize free index that showing curent situation. Zero value of index shows totally choppy/flat market.Values above zero level shows how powerfull bullish wave is and values below zero measures bearish forces.Up arrow appears on bearish market when it's ready to reverse, dn arrow appears on weak bullish market, as a result of reverse expectation. System has several trading modes that you can change directly on chart during trading.
Main Indicator's Features
- Signals are not repaint,non-late or disappear(exept cases when system recalculates all history datas,refreshing main settings or Metatrader refreshes new incomming datas);
- Every signal comes at the open of new bar(system uses only confirmed signals);
- Indicator has Alerts, Mail and Push notifications(allow to trade out of PC, from smartphone/mobile app);
- Possible to disable arrow strategy and use only histogram.
Recommendations for trading
- Timeframes in range 5MIN-H4 ;
- First of all recommend Gold and Crypto Market, EURUSD,EURGBP,EURJPY,USDJPY,NZDJPY,NZDUSD;