Imbalance MTF mt5
- 지표
- Barend Paul Stander
- 버전: 1.5
- 업데이트됨: 5 6월 2024
- 활성화: 5
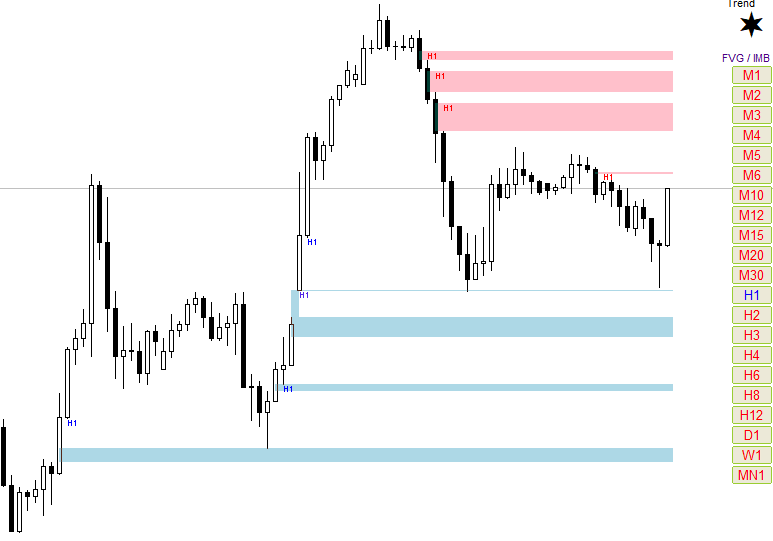
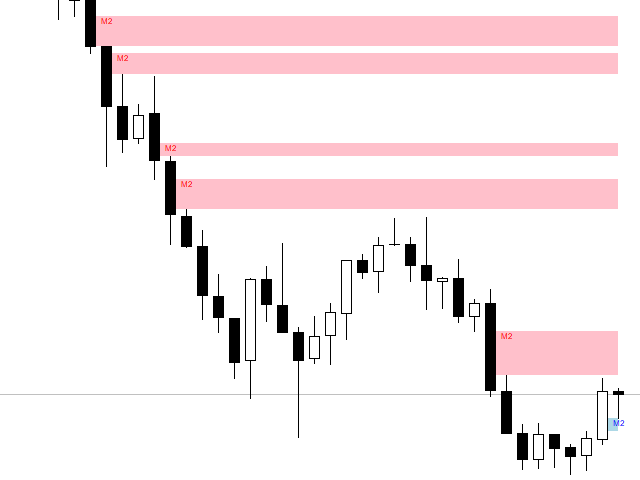
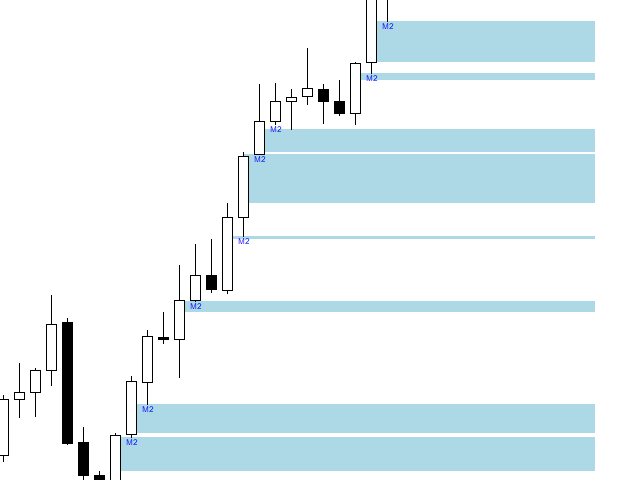
Imbalance / FVG MTF
Mark Imbalance on chart of Selected Multi Time frames. Trend is Manually set to filter signals in the chosen direction by a button on the chart. .
Futures
- Auto Mark Imbalance / FVG on chart on selected time frames
- Select time frames by buttons on chart
- Popup Alert, Push Notification or email when New Imbalance Form
- Popup Alert, Push Notification or email when Imbalance is Taken out
- Select Alert Mode to be a single or multiple Imbalance ( OR / AND option ) when Imbalance is Taken out
- Select / Filter by Manual Trend by a button
- Take Screenshot on Alert