Drawing Pack MT5
- 지표
- John Louis Fernando Diamante
- 버전: 1.0
- 활성화: 10
This indicator provides several drawing tools to assist in various methods of chart analysis.
The drawings will keep their proportions (according to their handle trendline) across different chart scales, update in real time, and multiple drawings are supported.
| # | Drawing Option | Description |
|---|---|---|
| 1 | Grid box | draggable boxed grid, user defines rows x colums, diagonal ray option |
| 2 | Grid | partial or fullscreen grid, sized by handle line |
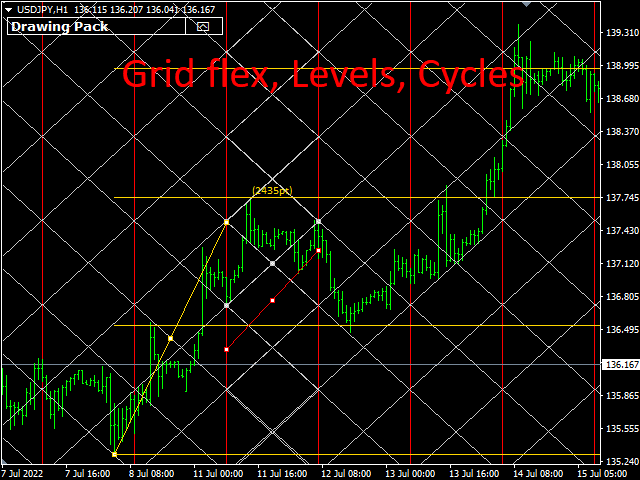
| 3 | Grid flex | a diagonal grid, sized and sloped by handle line |
| 4 | Cycles | similar to built-in cycle line but with option to cycle full screen |
| 5 | Levels | horizontal levels, height defined by handle line, optional full width |
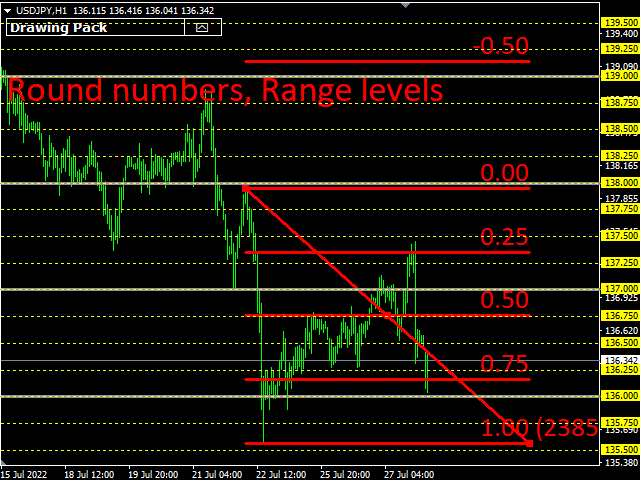
| 6 | Round numbers | user input for round number (in points), multiple levels supported |
| 7 | Range levels | handle line is vertically divided into labelled levels, levels defined by user (as % of handle height), alert option |
| 8 | Channel | upper & lower channel lines, adjustable number of channels, draggable height adjust, optional ray right & left+right, alert |
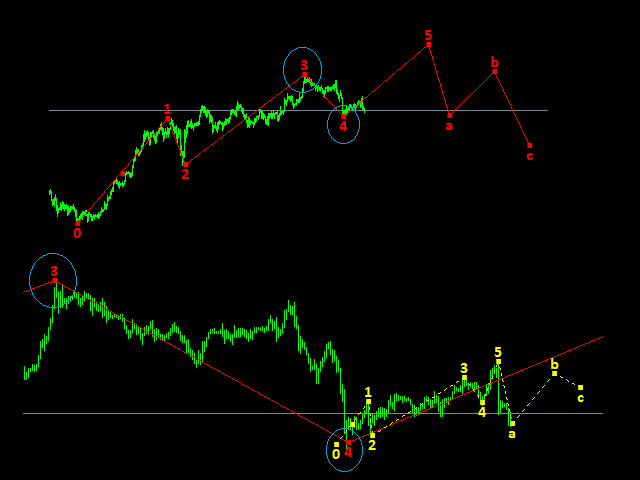
| 9 | Elliott Wave | a single drawing object with 1-2-3-4-5-a-b-c labeled waves |
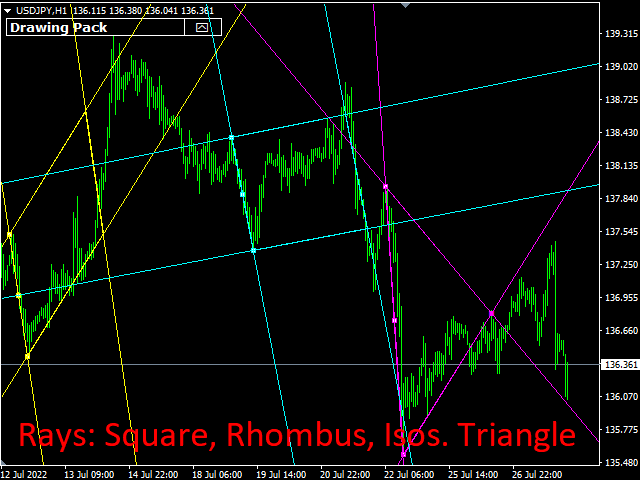
| 10 | Square | keeps proportion, ray option |
| 11 | Rhombus | keeps proportion, each handle anchor end adjusts the diagonally opposite rhombus point, ray option |
| 12 | Triangle | keeps proportion, quadrilateral & isosceles, keeps proportion to handle line and tip for isosceles, ray option |
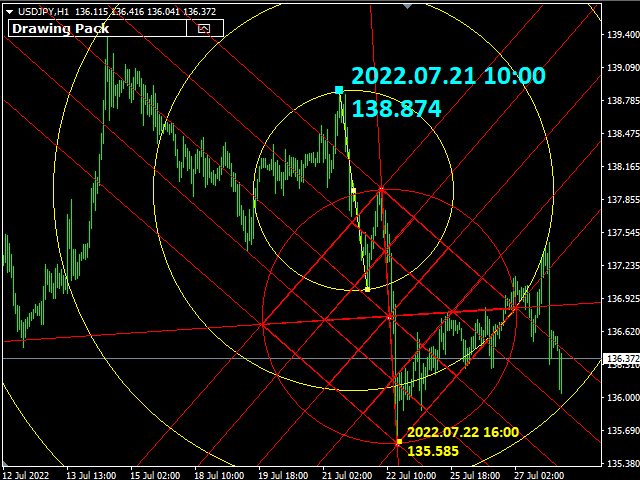
| 13 | Circle set 1 | (grid rows & columns are user defined) grid, overlapped grid, flexi grid, rotatable grid, concentric circles |
| 14 | Circle set 2 | square in circle, quadrilateral triangle in circle, 3 & 4 sized grid inside circle, optional rays |
| 15 | Coordinate Tag | dots with time & price coordinates, time and price alerts |
| 16 | Ruler | a box with measurements of height(points), width(bars or time duration) |
| 17 | Slope | single handle line with slope (pts/bar & size of pts & bars) |
Features:
- all drawings are individually styled, color, style, width, fontsize (not all drawings have all style options)
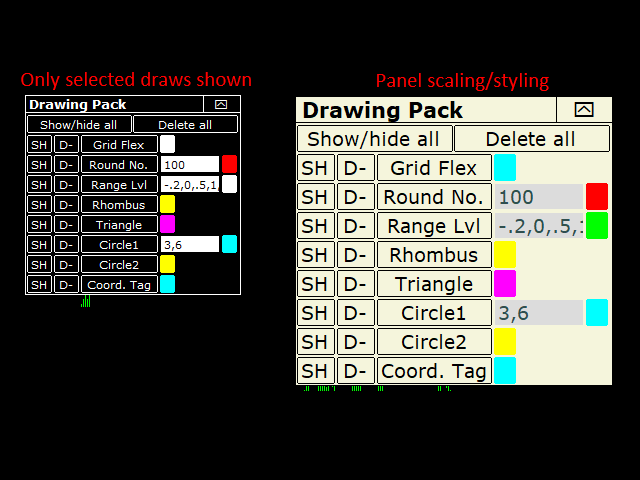
- show/hide each individual drawing type, or all
- delete last drawn object type, or all
- alerts provided for range levels, round numbers, coordinate tags, channels
Panel:
- stylable colors
- scalable in size and font
- movable
- can be minimized
- can show only selected drawing options