UR VolumeTrend MT5
- 지표
- Krzysztof Jan Debski
- 버전: 3.0
- 업데이트됨: 22 7월 2022
- 활성화: 5
UR 볼륨트렌드
UR VolumeTrend는 볼륨 측면에서 진행 중인 추세를 보여주는 가장 명확한 볼륨 표시기입니다. UR TrendExhaustion과 같은 다른 지표와 완벽하게 작동하여 로컬 고점과 저점을 나타냅니다.
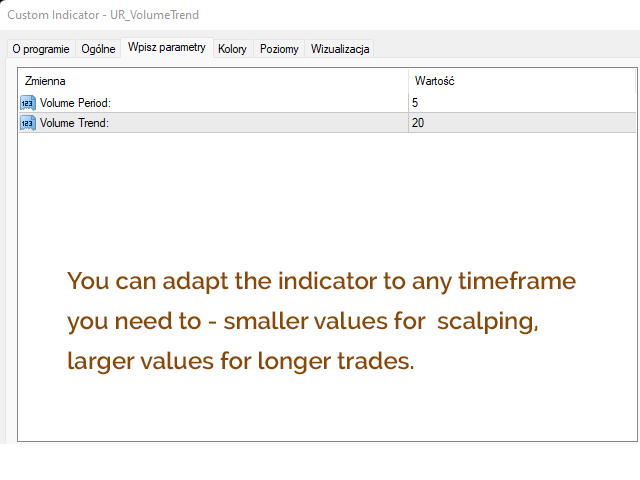
단 2개의 매개변수로 제한됩니다. 값이 높을수록 더 긴 추세가 표시됩니다.
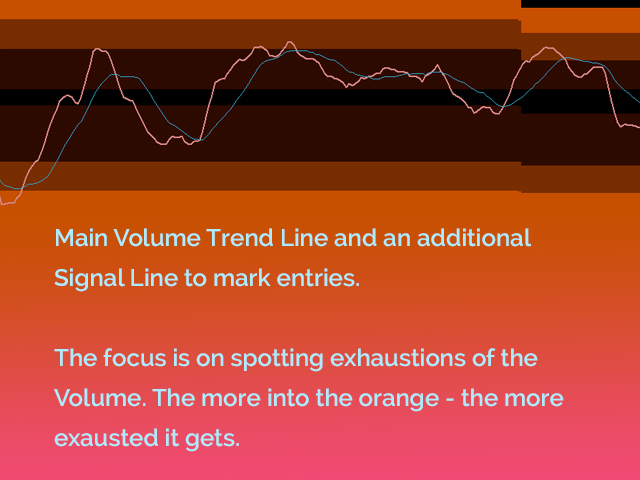
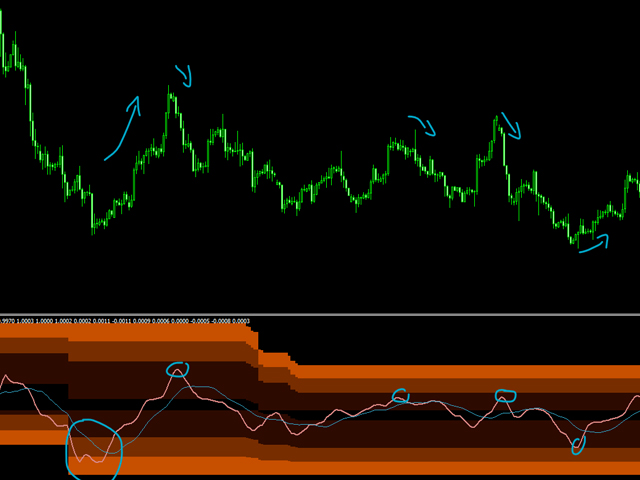
기울기 극단은 잠재적 반전을 포착하기 위해 가능한 볼륨 소진을 보여줍니다.
두 줄 - 거래량 추세 및 평균입니다.
최고의 장점: 쉽고 모든 자산에 맞게 조정됩니다.
도구 업데이트를 최신 상태로 유지하고 빠진 것이 있다고 생각되면 요청을 보낼 수 있는 특별한 텔레그램 채팅이 있습니다!
왜 UR VolumeTrend인가?
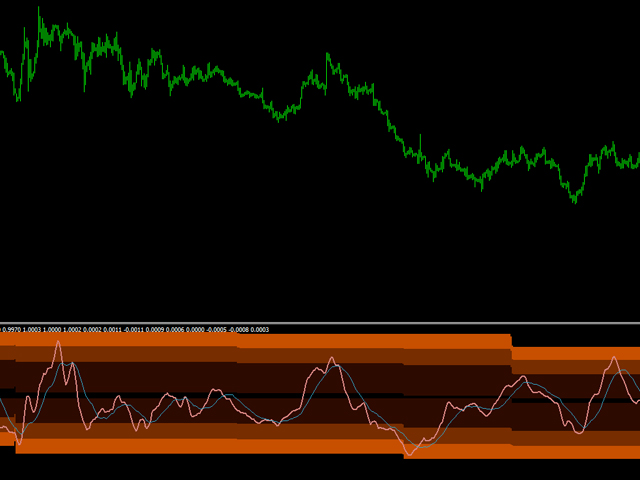
거래량이 추세를 파악하는 데 중요하다는 데 모두 동의할 것입니다. 이 오실레이터는 사용하기 쉬운 하나의 표시기로 압축된 모든 볼륨 도구의 합계입니다. 보기 편한 방식으로 양수/음수 양을 보여줍니다. 뒤의 인터페이스는 볼륨이 과거에 비해 소진될 가능성이 있는지 또는 새로운 수준으로 올라갈 것인지를 보여줍니다.
UR VolumeTrend를 사용하는 방법?
자세한 내용은 아래 설명을 참조하십시오.
설정
거래량 기간: 값이 높을수록 더 큰 추세를 포착하려고 합니다.
거래량 추세: 이 추가 라인은 거래량만을 기준으로 잠재적 반전 항목을 보여줍니다.
표시하다
그라데이션 인터페이스: 과거를 기준으로 레벨 극단을 표시합니다.
거래량 메인 라인: 거래량이 *0 이상* 또는 약세 *0 이하*인지 여부와 거래량이 얼마나 강해졌는지 보여줍니다. 0 주변을 가리키면 시장에 볼륨이 없음을 의미합니다.
거래량 추세선: 거래량의 평균을 표시하여 잠재적 진입 및 반전을 보다 명확하게 보여줍니다.
덧셈
내 모든 도구는 조립할 때 가장 잘 작동합니다. UR TrendExhaustion, UR DivergenceSpotter 또는/및 UR HighsAndLows와 함께 사용하면 진입점의 정확도가 훨씬 더 좋아집니다.