• 미리보기
  • 리뷰
  • 코멘트

Veles ZigZag X

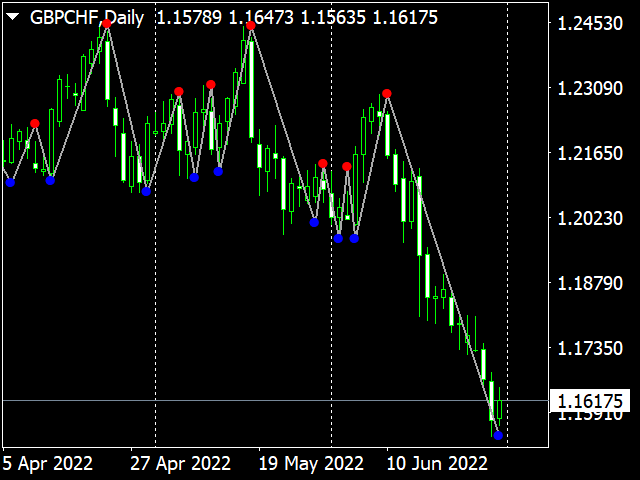
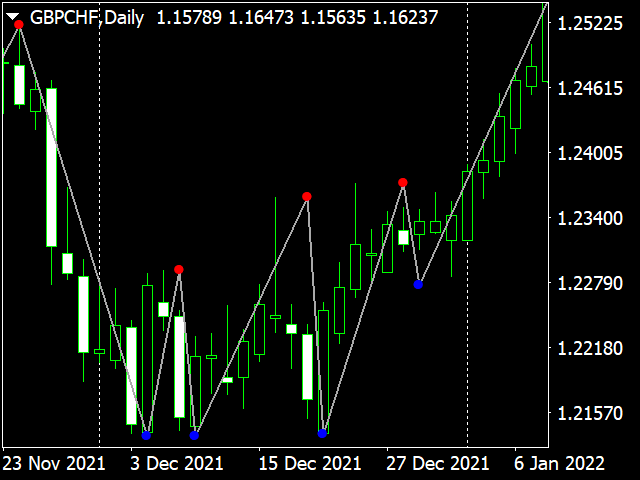
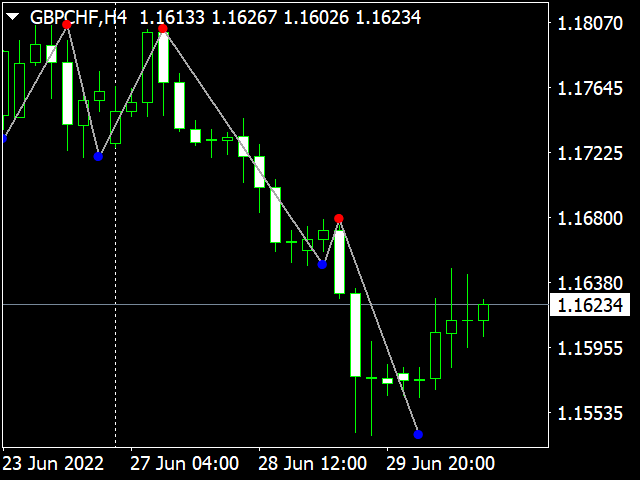
Очень точный индикатор, с его помощью очень легко определять барные паттерны.
Это очередная разновидность ЗигЗага, за исключением, он не рисует текущую линию, которая может перерисоваться,если нарисовал конечную точку, по закрытому бару, то больше ее не изменяет - это означает смену направления и следующая точка будет другого цвета. Может быть применен как для определения основного движения, при использовании увеличенных параметров, так и непосредственно для входа с минимальным риском. Очень хорошо показывает все волны. Работает с любым инструментом и любым ТаймФреймом.

Параметры как у стандартного ЗигЗага.


추천 제품
The indicator detects and displays Shark harmonic pattern (see the screenshot). The pattern is plotted by the extreme values of the ZigZag indicator (included in the resources, no need to install). After detecting the pattern, the indicator notifies of that by a pop-up window, a mobile notification and an email. The indicator highlights the process of the pattern formation and not just the complete pattern. In the former case, it is displayed in the contour triangles. After the pattern is comple
The indicator detects and displays 3 Drives harmonic pattern (see the screenshot). The pattern is plotted by the extreme values of the ZigZag indicator (included in the resources, no need to install). After detecting the pattern, the indicator notifies of that by a pop-up window, a mobile notification and an email. The indicator highlights the process of the pattern formation and not just the complete pattern. In the former case, it is displayed in the contour triangles. After the pattern is com
The indicator detects and displays М. Gartley's Butterfly pattern. The pattern is plotted by the extreme values of the ZigZag indicator (included in the resources, no need to install). After detecting the pattern, the indicator notifies of that by the pop-up window, a mobile notification and an email. The pattern and wave parameters are displayed on the screenshots. The default parameters are used for demonstration purposes only in order to increase the amount of detected patterns. Parameters
Trend Ray
Andriy Sydoruk
The indicator shows the potential trend direction by cyclical-wave dependence. Thus, all the rays of the intersection will be optimal rays, in the direction of which the price is expected to move, taking into account the indicator period. Rays can be used as a direction for potential market movement. But we must not forget that the approach must be comprehensive, the indicator signals require additional information to enter the market.
TrendPlus
Sivakumar Subbaiya
4.21 (14)
Trend Plus   Trendplus  Indicator   Time Frame: Suitable for any time frame.  Purpose: Trend Prediction. Blue and red candle indicate the buy and sell call respectively. Buy: When the blue candle is formed buy call is initiated. close the buy trades when the next red candle will formed.   Sell: When the Red candle is formed Sell call is initiated. close the Sell trades when the next blue candle will formed.   Happy trade!!
FREE
"Adjustable Fractals" - 프랙탈 표시기의 고급 버전으로 매우 유용한 거래 도구입니다! 우리가 알고 있듯이 표준 프랙탈 mt4 표시기에는 설정이 전혀 없습니다. 이는 거래자에게 매우 불편합니다. 조정 가능한 프랙탈(Adjustable Fractals)이 해당 문제를 해결했습니다. 필요한 모든 설정이 포함되어 있습니다. 조정 가능한 표시 기간(권장 값 - 7 이상) 고점/저점과의 거리 조절 가능 프랙탈 화살표에 따라 조정 가능한 디자인 // 더 훌륭한 전문가 자문 및 지표는 여기에서 확인할 수 있습니다: https://www.mql5.com/en/users/def1380/seller // 또한 수익성 있고 안정적이며 신뢰할 수 있는 신호 https://www.mql5.com/en/signals/1887493에 참여하실 수 있습니다. 본 MQL5 홈페이지에서만 제공되는 오리지널 제품입니다.
Peak Trough Analysis is the great tool to detect peaks and troughs in your chart. Peak Trough Analysis tool can use three different peaks and troughs detection algorithm. The three algorithm include the orignal Fractals Indicator by Bill Williams, the Modified Fractals indicator and ZigZag indicator. You can use this peak and trough analysis tool to detect the price pattern made up from Equilibrium Fractal-Wave process. For further usage, there are good guide line on how to use this peak trough
FREE
Wise Men Indicator demo
Bohdan Kasyanenko
3.67 (3)
The indicator displays signals according to the strategy of Bill Williams on the chart. Demo version of the indicator has the same features as the paid, except that it can work only on a demo account . Signal "First Wise Man" is formed when there is a divergent bar with angulation.  Bullish divergent bar - with lower minimum and closing price in the upper half. Bearish divergent bar - higher maximum and the closing price at the bottom half. Angulation is formed when all three lines of Alligat
FREE
Trend Scanner
Vladimir Kalendzhyan
4.38 (8)
By purchasing this indicator, you have the right to receive a free copy of one of   my other indicator's or advisor’s!  (All future updates are included. No limits) . To get it , please contact me by  mql5 message ! The Trend Scanner trend line indicator displays the trend direction and its changes. The indicator works on all currency pairs and  timeframes. The indicator simultaneously displays multiple readings on the price chart: the support and resistance lines of the currency pair, the exist
Trend PA
Mikhail Nazarenko
5 (3)
The Trend PA indicator uses   Price Action   and its own filtering algorithm to determine the trend. This approach helps to accurately determine entry points and the current trend on any timeframe. The indicator uses its own algorithm for analyzing price changes and Price Action. Which gives you the advantage of recognizing, without delay, a new nascent trend with fewer false positives. Trend filtering conditions can be selected in the settings individually for your trading style. The indicator
Extremum Reverse Bar
Yurij Izyumov
3.55 (11)
This indicator has been created for finding the probable reversal points of the symbol price. A small candlestick reversal pattern is used it its operation in conjunction with a filter of extremums. The indicator is not redrawn! If the extremum filter is disabled, the indicator shows all points that have a pattern. If the extremum filter is enabled, the condition works – if the history Previous bars 1 candles back contains higher candles and they are farther than the Previous bars 2 candle, such
FREE
Free automatic fibonacci
Tonny Obare
4.65 (62)
Free automatic Fibonacci is an indicator that automatically plots a Fibonacci retracement based on the number of bars you select on the BarsToScan setting in the indicator. The Fibonacci is automatically updated in real time as new highest and lowest values appears amongst the selected bars. You can select which level values to be displayed in the indicator settings. You can also select the color of the levels thus enabling the trader to be able to attach the indicator several times with differe
FREE
Ppr PA
Yury Emeliyanov
4.75 (4)
"Ppr PA" is a unique technical indicator created to identify "PPR" patterns on the currency charts of the MT4 trading platform. These patterns can indicate possible reversals or continuation of the trend, providing traders with valuable signals to enter the market. Features: Automatic PPR Detection:   The indicator automatically identifies and marks PPR patterns with arrows on the chart. Visual Signals:   Green and red arrows indicate the optimal points for buying and selling, respectively. A
FREE
PZ Penta O MT4
PZ TRADING SLU
2.25 (4)
The Penta-O is a 6-point retracement harmonacci pattern which usually precedes big market movements. Penta-O patterns can expand and repaint quite a bit. To make things easier this indicator implements a twist: it waits for a donchian breakout in the right direction before signaling the trade. The end result is an otherwise repainting indicator with a very reliable trading signal. The donchian breakout period is entered as an input. [ Installation Guide | Update Guide | Troubleshooting | FAQ | A
FREE
ZigZag Fibo Retracement
Dang Khoa Nguyen
5 (1)
ZigZag Fibo Retracement Indicator Optimize Your Trading Strategy! Are you seeking to optimize your trading strategy in the financial markets? Explore the unique features of the ZigZag Fibo Retracement Indicator, a powerful tool designed to help you identify potential support and resistance levels based on the combination of ZigZag patterns and Fibonacci ratios. Integration of ZigZag Patterns and Fibonacci: The ZigZag Fibo Retracement Indicator combines the effectiveness of ZigZag patterns, helpi
FREE
LordChannel
Igor Pereira Calil
LordChannel is an indicator for META TRADER 4 for all forex pairs and financial market metals. The indicator is used to make detections of high/low channels, implementing a technical analysis on possible breakouts and making correct order entries. LordChannel sends signals such as buy and sell in the graphical analysis, it is important to emphasize that the importance of these signals are safe in TIME FRAMES M30, H1, H4. The indicator was created for using bullish/downtrend channels to co
Support and Resistance Channels
Hossam Mohamed Abdelsalam Ahmed Abdelsalam
Support and Resistance technical indicator for mt4 that identifies the Strong support and resistance levels based on  Zigzag indicator with full control of Zigzag indicator setting , selectable Timeframes  as well as  SRL lines formats . Inputs: - Time frame. ----------------- Zigzag setting: ------------------ - Depth. - Deviation. - Backstep. -------------------- Peaks and valleys setting: - Min peaks gap in Points. // to be considered as a new level. - Peak sensitivity. // min no. of peaks
TrendInChannel
Andriy Sydoruk
This indicator is the undisputed leader among the indicators. And for this statement there is a good reason. The indicator builds a very high quality channel in which it generates signals to enter! What is the ideal strategy for the trader, since the trader always hesitates when choosing a strategy for the job. That is, this indicator will allow you to solve the dilemma of choosing a job by trend or to the channel, since it combines these two basic concepts. Working with the indicator is very
KDJ Index 4   交易实用必备工具指标 波浪自动计算指标,通道趋势交易 完美的趋势-波浪自动计算通道计算 , MT4版本 完美的趋势-波浪自动计算通道计算 , MT5版本 本地跟单复制交易 Easy And Fast Copy , MT4版本 Easy And Fast Copy , MT5版本 本地跟单复制交易 模拟试用 Easy And Fast Copy , MT4 模拟账号运行 Easy And Fast Copy , MT5 模拟账号运行 "Cooperative QQ:556024  "  "Cooperation wechat:556024"  "Cooperative email:556024@qq.com" 强烈推荐趋势指标, 波浪的标准自动计算   和   波浪的标准自动计算MT5版本     KDJ指标又叫 随机指标 ,是一种相当新颖、实用的技术分析指标,它起先用于期货市场的分析,后被广泛用于股市的中短期趋势分析,是期货和股票市场上最常用的技术分析工具。 随机指标KDJ一般是用于股票分析的统计体系,根据统计学原理,通过一个特定的周期(常为9日、9周等
COG LR Osc AM
Andriy Matviyevs'kyy
The presented indicator allows you to determine potential entry points into the market and set protective orders at reasonable levels. This product can be useful for both beginners and experienced traders. The indicator is based on calculation methods proven by time and practicing traders. The indicator is calculated in two stages: At the first stage, linear regression (LR) of the selected price type is determined for a given number of chart periods. At the second stage, the obtained data is p
UPD1 X00 Levels
Vitaliy Kuznetsov
4.92 (12)
인디케이터는 차트의 라운드 레벨을 보여줍니다. 심리적, 뱅킹 또는 주요 플레이어 레벨이라고도 합니다. 이 수준에서 황소와 곰 사이에 실제 싸움이 있고 많은 주문이 누적되어 변동성이 증가합니다. 표시기는 모든 악기와 기간에 따라 자동으로 조정됩니다. 80레벨을 돌파하고 테스트를 하면 구매합니다. 20레벨 돌파 후 테스트 하면 판매합니다. 목표는 00입니다. 주목. 강력한 지원 및 저항 수준으로 인해 가격이 00 수준을 약간 놓칠 수 있습니다. 입력 매개변수. Bars Count - 라인 길이. Show 00 Levels - 00 레벨을 표시하거나 표시하지 않음. Show 10, 90 Levels. Show 20, 80 Levels. Show 30, 70 Levels. Show 40, 60 Levels. Show 50 Levels. N Lines - 차트의 레벨 수를 제한하는 매개변수. Distance 00 Levels - 레벨 사이의 거리(자동 또는 수동). Line Posi
FREE
Power Trend Free
Yurij Kozhevnikov
5 (2)
Power Trend Free - the indicator shows the trend strength in the selected period. Input Parameters The indicator has three input parameters: Period - a positive number greater than one, it shows the number of candlesticks used for calculations. If you enter one or zero, there will be no error, but the indicator will not be drawn. Applied Price - the standard "Apply to:" set meaning data used for the indicator calculation: Close - Close prices; Open - Open prices; High - High prices; Low - Low
FREE
Two Period RSI
Libertas LLC
4.5 (8)
Two Period RSI compares long-term and short-term RSI lines, and plots a fill between them for improved visualization. Fill is colored differently according to an uptrend (short period RSI above long period RSI) or a downtrend (short period RSI below long period RSI). Short-term RSI crossing long-term RSI adds a more robust trend confirmation signal than using single period RSI alone. This is a small tool to help visualize and confirm RSI trends. We hope you enjoy! Looking for RSI alerts? You can
FREE
Basic Harmonic Pattern
Mehran Sepah Mansoor
4.64 (61)
이 지표는 시장 반전 시점을 예측하는 가장 인기 있는 하모닉 패턴을 식별합니다. 이러한 하모닉 패턴은 외환 시장에서 지속적으로 반복되는 가격 형성이며 향후 가능한 가격 움직임을 제안합니다 / 무료 MT5 버전 또한 이 보조지표에는 시장 진입 신호와 다양한 이익실현 및 손절매 신호가 내장되어 있습니다. 하모닉 패턴 지표는 자체적으로 매수/매도 신호를 제공할 수 있지만 다른 기술 지표를 사용하여 이러한 신호를 확인하는 것이 좋습니다. 예를 들어, 매수/매도하기 전에 추세의 방향과 모멘텀의 강도를 확인하기 위해 RSI 또는 MACD와 같은 오실레이터를 사용하는 것을 고려할 수 있습니다. 이 인디케이터의 대시보드 스캐너: ( Basic Harmonic Patterns Dashboard ) 포함된 하모닉 패턴 가틀리 버터플라이 박쥐 게 Shark Cypher ABCD 주요 입력 Max allowed deviation (%): 이 매개변수는 하모닉 패턴의 형성에 허용되는
FREE
WH DrawFib Pro MT4
Wissam Hussein
5 (7)
차트에 수동으로 피보나치 레벨을 그리는 데 지쳤습니까? 거래에서 주요 지지선과 저항선을 식별할 수 있는 편리하고 효율적인 방법을 찾고 계십니까? 더 이상 보지 마세요!   자동   피보나치   수준   을   수행하는 최고의 MetaTrader 4 지표인 DrawFib Pro를 소개합니다.       차트에 그림을 그리고 이러한 수준이 위반되면 적시에 경고를 제공합니다. DrawFib Pro를 사용하면 거래 전략을 강화하고 시간을 절약하며 정보에 입각한 결정을 내릴 수 있습니다. 내 피보나치 기반 지표:   WH Advanced Gartley Pattern MT4   ||  WH Price Wave Pattern MT4 주요 특징들: 자동화       피보나치 그리기. 사용자 정의 가능       매개변수  . 정확한    그리고    믿을 수 있는. 실시간       경고. 사용자   친화적       인터페이스. DrawFib Pro는 효율적이고 신뢰할 수 있으며 사용자 친화적
FREE
Divergent Accuracy
Yaroslav Varankin
The Divergent Accuracy indicator is designed to identify discrepancies on the price chart of a currency pair. The Divergent Accuracy indicator recognizes bullish and bearish divergences, and can also output a signal that a divergence has been detected... In addition to identifying divergences, the indicator works with overbought and oversold levels, and also shows arrows to enter the market...
This indicator shows the latest untouched support and resistance as horizontal lines. The indicator can show support/resistance from higher timeframes. With this indicator you can e.g. easily see the support/resistance of the timeframes H4, D1 and W1 on a H1 chart, which can be a big advantage while time your entry on H1. This is the FREE version of the indicator: Support Resistance Multi Time Frame The free version works only on EURUSD and GBPUSD! Parameters referenceTF: the timeframe from wh
FREE
Going straight
Maryna Shulzhenko
American traders say: “Trend is your friend”, which means “Trend is your friend”. And indeed it is! By trading with the trend, you reduce your risks and gain an advantage, as you increase the mathematical expectation of completed trades and, therefore, earn more profit. Together with the Going straight indicator you will trade with the trend with ease! This is one of the most effective ways to deal with market trends. Trading strategies using the channel indicator belong to the classic method
Trend arrow Indicator
NGUYEN NGHIEM DUY
3.23 (13)
Trend arrow Indicator is an arrow Indicator used as an assistant tool for your trading strategy. The indicator analyzes the standard deviation of bar close for a given period and generates a buy or sell signals if the deviation increases. It good to combo with Martingale EA to follow Trend and Sellect Buy Only/Sell Only for EA work Semi-Automatic. You can use this  Indicator with any EAs in my Products.
FREE
Italo Levels Indicator
Italo Santana Gomes
5 (8)
BUY INDICATOR AND GET EA FOR FREE AS A BONUS + SOME OTHER GIFTS! ITALO LEVELS INDICATOR  is the best levels indicator ever created, and why is that? Using high volume zones on the market and Fibonacci the Indicator works on all time-frames and assets, indicator built after 7 years of experience on forex and many other markets. You know many levels indicators around the internet are not complete, does not help, and it's difficult to trade, but the   Italo Levels Indicator is different , the Ital
이 제품의 구매자들이 또한 구매함
Gann Made Easy
Oleg Rodin
4.93 (72)
Gann Made Easy 는 mr.의 이론을 사용하여 최고의 거래 원칙을 기반으로 하는 전문적이고 사용하기 쉬운 Forex 거래 시스템입니다. W.D. 간. 이 표시기는 Stop Loss 및 Take Profit Levels를 포함하여 정확한 BUY 및 SELL 신호를 제공합니다. PUSH 알림을 사용하여 이동 중에도 거래할 수 있습니다. 구매 후 연락주세요! 내 거래 팁과 훌륭한 보너스 지표를 무료로 공유하겠습니다! 아마도 Gann 거래 방법에 대해 이미 여러 번 들었을 것입니다. 일반적으로 Gann의 이론은 초보자 거래자뿐만 아니라 이미 거래 경험이 있는 사람들에게도 매우 복잡한 것입니다. Gann의 거래 방식은 이론적으로 적용하기 쉽지 않기 때문입니다. 나는 그 지식을 연마하고 Forex 지표에 최고의 원칙을 적용하기 위해 몇 년을 보냈습니다. 표시기는 적용하기가 매우 쉽습니다. 차트에 첨부하고 간단한 거래 권장 사항을 따르기만 하면 됩니다. 지표는 지속적으로 시장 분석 작업
Trend Punch
Mohamed Hassan
5 (10)
Manual guide:   Click here PROMO of  $79 for 2 copies left!  -- Next price is  $149 .  This indicator is unstoppable when combined with our other indicator called  Support & Resistance . After purchase, send us a message and you will get it   for  FREE as a BONUS! I like to use Trend Punch on XAUUSD & BTCUSD on the M1 timeframe!  Introducing Trend Punch , the revolutionary forex trend indicator that will transform the way you trade! Trend Punch is uniquely designed to provide preci
Advanced Currency Strength28 Indicator
Bernhard Schweigert
4.9 (663)
현재 26% 할인 초보자 또는 전문가 트레이더를 위한 최고의 솔루션! 이 지표는 우리가 독점 기능과 새로운 공식을 통합했기 때문에 독특하고 고품질이며 저렴한 거래 도구입니다. 단 하나의 차트로 28 Forex 쌍의 통화 강도를 읽을 수 있습니다! 새로운 추세 또는 스캘핑 기회의 정확한 트리거 포인트를 정확히 찾아낼 수 있기 때문에 거래가 어떻게 개선될지 상상해 보십시오. 사용 설명서: 여기를 클릭  https://www.mql5.com/en/blogs/post/697384 그것이 첫 번째, 원본입니다! 쓸모없는 지망생 클론을 사지 마십시오. 더 스페셜  강력한 통화 모멘텀을 보여주는 하위 창의 화살표 GAP가 거래를 안내합니다! 기본 또는 호가 통화가 과매도/과매도 영역(외부 시장 피보나치 수준)에 있을 때 개별 차트의 기본 창에 경고 표시가 나타납니다. 통화 강도가 외부 범위에서 떨어질 때 풀백/반전 경고. 교차 패턴의 특별 경고 추세를 빠르게 볼 수 있는
Atomic Analyst
Issam Kassas
5 (3)
우선적으로 언급할 점은이 거래 지표가 다시 그리지 않고 지연되지 않으며 이를 통해 수동 및 로봇 거래 모두에 이상적이라는 점입니다. 사용자 매뉴얼: 설정, 입력 및 전략. Atomic Analyst는 가격의 강도와 모멘텀을 활용하여 시장에서 더 나은 이점을 찾는 PA Price Action Indicator입니다. 고급 필터를 장착하여 잡음과 거짓 신호를 제거하고 거래 잠재력을 높이는 데 도움이 됩니다. 복잡한 지표의 다중 레이어를 사용하여 Atomic Analyst는 차트를 스캔하고 복잡한 수학적 계산을 간단한 신호와 색상으로 변환하여 초보 트레이더가 이해하고 일관된 거래 결정을 내릴 수 있도록합니다. "Atomic Analyst"는 새로운 및 경험이 풍부한 트레이더를위한 종합적인 거래 솔루션입니다. 프리미엄 지표와 최고 수준의 기능을 하나의 거래 전략에 결합하여 모든 종류의 트레이더에 대한 다재다능한 선택지가되었습니다. 인트라데이 거래 및 스캘핑 전략 : 빠르고 정확한
TPSpro RFI Levels
Roman Podpora
4.82 (17)
Reversal First Impulse levels (RFI)    INSTRUCTIONS        RUS       -       ENG              R ecommended to use with an indicator   -   TREND PRO -  Version MT5 A key element in trading is zones or levels from which decisions to buy or sell a trading instrument are made. Despite attempts by major players to conceal their presence in the market, they inevitably leave traces. Our task was to learn how to identify these traces and interpret them correctly. Main functions: Displaying active zones
Scalper Inside PRO
Alexey Minkov
4.74 (58)
An exclusive indicator that utilizes an innovative algorithm to swiftly and accurately determine the market trend. The indicator automatically calculates opening, closing, and profit levels, providing detailed trading statistics. With these features, you can choose the most appropriate trading instrument for the current market conditions. Additionally, you can easily integrate your own arrow indicators into Scalper Inside Pro to quickly evaluate their statistics and profitability. Scalper Inside
Advanced Supply Demand
Bernhard Schweigert
4.92 (312)
현재 33% 할인! 초보자나 전문 트레이더를 위한 최고의 솔루션! 이 보조지표는 우리가 다수의 독창적 기능과 새로운 공식을 통합한 독특하고 고품질이며 저렴한 거래 도구입니다. 이 업데이트를 통해 이중 시간대를 표시할 수 있습니다. 더 높은 TF를 표시할 수 있을 뿐만 아니라 차트 TF와 더 높은 TF 모두를 표시할 수 있습니다: 중첩 영역 표시. 모든 Supply Demand 트레이더들이 좋아할 것입니다. :) 중요한 정보 공개 Advanced Supply Demand의 잠재력을 극대화하려면 다음을 방문하십시오. https://www.mql5.com/ko/blogs/post/720245   진입 또는 목표의 명확한 트리거 포인트를 정확히 찾아냄으로 해서 거래가 어떻게 개선될지 상상해 보십시오. 새로운 알고리즘을 기반으로 매수자와 매도자 간의 잠재적인 불균형을 훨씬 더 쉽게 분간할 수 있습니다. 왜냐하면 가장 강한 공급영역과 가장 강한 수요 영역과 과거에 어떻게 진행 되었는지를(이
현재 20% 할인 ! 초보자 또는 전문가 트레이더를 위한 최고의 솔루션! 이 대시보드 소프트웨어는 28개의 통화 쌍에서 작동합니다. 2가지 주요 지표(Advanced Currency Strength 28 및 Advanced Currency Impulse)를 기반으로 합니다. 전체 Forex 시장에 대한 훌륭한 개요를 제공합니다. 고급 통화 강도 값, 통화 이동 속도 및 모든(9) 시간대의 28 Forex 쌍에 대한 신호를 보여줍니다. 추세 및/또는 스캘핑 기회를 정확히 파악하기 위해 차트의 단일 지표를 사용하여 전체 시장을 볼 수 있을 때 거래가 어떻게 개선될지 상상해 보십시오! 잠재적인 거래를 식별하고 확인하면서 강력한 통화와 약한 통화를 더욱 쉽게 식별할 수 있도록 이 지표에 기능을 내장했습니다. 이 표시기는 통화의 강세 또는 약세가 증가 또는 감소하는지 여부와 모든 시간대에서 수행되는 방식을 그래픽으로 보여줍니다. 추가된 새로운 기능은 현재 시장 조건 변화에 적
Legacy of Gann
Pavel Zamoshnikov
4.83 (12)
The indicator very accurately determines the levels of the possible end of the trend and profit fixing. The method of determining levels is based on the ideas of W.D.Gann, using an algorithm developed by his follower Kirill Borovsky. Extremely high reliability of reaching levels (according to K. Borovsky  - 80-90%) Indispensable for any trading strategy – every trader needs to determine the exit point from the market! Precisely determines targets on any timeframes and any instruments (forex, met
TPSproTREND PrO
Roman Podpora
4.78 (18)
TPSpro TRENDPRO  - is a trend indicator that automatically analyzes the market and provides information about the trend and each of its changes, as well as giving signals for entering trades without redrawing! The indicator uses each candle, analyzing them separately. referring to different impulses - up or down impulse. Exact entry points into transactions for currencies, crypto, metals, stocks, indices!  -  Version MT5               DETAILED DESCRIPTION                R ecommended to use with
FX Power MT4 NG
Daniel Stein
5 (10)
모닝 브리핑 여기 mql5 와 텔레그램에서 FX Power MT4 NG 는 오랫동안 인기 있는 통화 강도 측정기인 FX Power의 차세대 버전입니다. 이 차세대 강도 측정기는 무엇을 제공합니까? 기존 FX Power에서 좋아했던 모든 것 PLUS GOLD/XAU 강도 분석 더욱 정밀한 계산 결과 개별 구성 가능한 분석 기간 더 나은 성능을 위한 사용자 정의 가능한 계산 한도 특별 멀티더 많은 것을보고 싶은 사람들을위한 특별한 다중 인스턴스 설정 모든 차트에서 좋아하는 색상을위한 끝없는 그래픽 설정 수많은 알림 옵션, 중요한 것을 다시는 놓치지 않도록 Windows 11 및 macOS 스타일의 둥근 모서리가 있는 새로운 디자인 마법처럼 움직이는 인디케이터 패널 FX 파워 키 특징 모든 주요 통화의 완전한 강세 이력 모든 시간대에 걸친 통화 강세 이력 모든 브로커 및 차트에서 고유 계산 결과 100% 신뢰할 수있는 실시간100 % 신뢰할 수있는 실시간 계산-> 다시 칠하지 않음
맞춤형 MT4 지표로 성공적인 외환 거래에 대한 비밀을 발견하십시오! 외환 시장에서 성공을 달성하고 위험을 최소화하면서 일관되게 이익을 얻는 방법을 궁금해 한 적이 있습니까? 여기에 당신이 찾고 있던 답이 있습니다! 거래에 대한 귀하의 접근 방식을 혁신 할 독점적 MT4 지표를 소개 할 수 있습니다. 독특한 다양성 우리의 지표는 Renko 및 Rangebar Candle Formations를 선호하는 사용자를 위해 특별히 설계되었습니다. 우리는 이러한 차트 유형이 많은 숙련 된 거래자들이 선호한다는 것을 이해하기 때문에 우리의 지표가 그들과 완벽하게 통합되어 비교할 수없는 시장 분석을 제공합니다. 명확한 추세 신호 복잡한 분석을 잊어 버리십시오! 우리의 지표는 생생한 색상과 명확한 점 구조를 사용하여 시장 동향을 명확하게 나타냅니다. 빨간색과 파란색 점은 가격 이동 방향에 대해 의심의 여지가 없어 거래에서 빠른 의사 결정을 할 수 있습니다. HH/HL HL/LL
Currency Strength Wizard
Oleg Rodin
4.91 (44)
통화 강도 마법사는 성공적인 거래를 위한 올인원 솔루션을 제공하는 매우 강력한 지표입니다. 표시기는 여러 시간 프레임의 모든 통화 데이터를 사용하여 이 또는 해당 외환 쌍의 힘을 계산합니다. 이 데이터는 특정 통화의 힘을 확인하는 데 사용할 수 있는 사용하기 쉬운 통화 지수 및 통화 전력선의 형태로 표시됩니다. 필요한 것은 거래하려는 차트에 표시기를 부착하는 것뿐입니다. 표시기는 거래하는 통화의 실제 강세를 보여줍니다. 지표는 또한 추세와 거래할 때 유리하게 사용할 수 있는 구매 및 판매 거래량 압력의 극한값을 보여줍니다. 지표는 또한 피보나치에 기반한 가능한 대상을 보여줍니다. 표시기는 PUSH 알림을 포함한 모든 유형의 알림을 제공합니다. 구매 후 연락주세요. 나는 당신과 거래 팁을 공유하고 당신에게 무료로 훌륭한 보너스 지표를 줄 것입니다! 나는 당신에게 행복하고 유익한 거래를 기원합니다!
Volatility Trend System - a trading system that gives signals for entries. The volatility system gives linear and point signals in the direction of the trend, as well as signals to exit it, without redrawing and delays. The trend indicator monitors the direction of the medium-term trend, shows the direction and its change. The signal indicator is based on changes in volatility and shows market entries. The indicator is equipped with several types of alerts. Can be applied to various trading
ICT, SMC, SMART MONEY CONCEPTS, SMART MONEY, Smart Money Concept, Support and Resistance, Trend Analysis, Price Action, Market Structure, Order Blocks, BOS/CHoCH,   Breaker Blocks ,  Momentum Shift,   Supply&Demand Zone/Order Blocks , Strong Imbalance, HH/LL/HL/LH,    Fair Value Gap, FVG,  Premium  &   Discount   Zones, Fibonacci Retracement, OTE, Buy Side Liquidity, Sell Side Liquidity, BSL/SSL Taken, Equal Highs & Lows, MTF Dashboard, Multiple Time Frame, BigBar, HTF OB, HTF Market Structure, 
TakePropips Donchian Trend Pro
Eric John Pajarillaga Aldana
4.82 (17)
TakePropips Donchian Trend Pro   (MT4)는 Donchian 채널을 사용하여 추세의 방향을 자동으로 감지하고 진입 및 퇴장 거래 신호를 제공하는 강력하고 효과적인 도구입니다! 이 다기능 지표에는 추세 스캐너, 거래 신호, 통계 패널, 스크리너, 거래 세션 및 경고 내역 대시보드가 포함됩니다. 거래 신호를 제공하고 차트 분석 시간을 절약하도록 설계되었습니다! 다음 블로그 게시물에서 사용자 설명서 및 설치 가이드를 다운로드할 수 있습니다.   https://www.mql5.com/en/blogs/post/751368 오늘 50% 할인을 받으세요! 가격이 $98에서 $49로 인하되었습니다! 전략 테스터에서 이 지표를 테스트할 수 있습니다(비주얼 모드 활성화).  자세한 내용은 설명 아래에 비디오 자습서도 제공됩니다. 질문이 있거나 도움이 필요하면 저에게 연락하십시오. TakePropips Donchian Trend Pro 지표는 모든 Forex 쌍, 금속
M1 Arrow
Oleg Rodin
5 (14)
시장의 두 가지 기본 원칙에 기반한 일중 전략. 알고리즘은 추가 필터를 사용하여 거래량 및 가격 파동 분석을 기반으로 합니다. 지표의 지능형 알고리즘은 두 가지 시장 요인이 하나로 결합될 때만 신호를 제공합니다. 지표는 더 높은 시간 프레임의 데이터를 사용하여 M1 차트에서 특정 범위의 파도를 계산합니다. 그리고 파동을 확인하기 위해 지표는 볼륨 분석을 사용합니다. 이 표시기는 준비된 거래 시스템입니다. 트레이더가 필요로 하는 모든 것은 신호를 따르는 것입니다. 또한 지표는 자신의 거래 시스템의 기초가 될 수 있습니다. 거래는 분 차트에서만 수행됩니다. 지표가 MTF 원리를 사용한다는 사실에도 불구하고 지표 알고리즘은 가능한 한 안정적입니다. 구매 후 반드시 저에게 편지를 보내주세요! 내 거래 설정 및 권장 사항을 공유하겠습니다!
NAM Order Blocks
NAM TECH GROUP, CORP.
5 (1)
MT4 Multi-timeframe Order Blocks detection indicator. Features - Fully customizable on chart control panel, provides complete interaction. - Hide and show control panel wherever you want. - Detect OBs on multiple timeframes. - Select OBs quantity to display. - Different OBs user interface. - Different filters on OBs. - OB proximity alert. - ADR High and Low lines. - Notification service (Screen alerts | Push notifications). Summary Order block is a market behavior that indicates order collection
FX Volume
Daniel Stein
4.6 (35)
모닝 브리핑을 통해 세부 정보와 스크린샷으로 매일 시장 업데이트를 받으세요 여기 mql5 및 텔레그램에서 FX 거래량은 브로커의 관점에서 시장 심리에 대한 실제 통찰력을 제공하는 최초이자 유일한 거래량 지표입니다. 브로커와 같은 기관 시장 참여자가 외환 시장에서 어떤 포지션을 취하고 있는지에 대한 훌륭한 통찰력을 COT 보고서보다 훨씬 빠르게 제공합니다. 차트에서 이 정보를 직접 확인하는 것은 트레이딩의 진정한 판도를 바꾸고 획기적인 솔루션입니다. 다음과 같은 고유한 시장 데이터 인사이트의 이점 비율 는 통화의 매수/매도 포지션 비율을 백분율로 표시 비율 변화 는 선택한 기간 내 매수 비율과 비율 변화를 표시 총 거래량 는 해당 통화의 총 거래량(롱 및 숏)을 로트 단위로 보여줍니다 Volumes Long 는 해당 통화의 모든 롱 포지션의 거래량을 보여줍니다 Volumes Short 는 해당 통화의 모든 숏 포지션의 거래량을 보여줍니다 Net Long 는 순 롱 포지션의 거래량
BullsEye Signal NoRepaint
Martin Alejandro Bamonte
BullseyeSignal – NoRepaint 은 그 이름이 나타내는 바와 같이 어떤 상황에서도 다시 그려지지 않는 신호입니다. 신호는 이미지에 표시된 동일한 캔들에 발행됩니다. 외환, 암호화폐, 주식, 지수 및 선물과 같은 변동성이 큰 시장에 이상적입니다. 매수에는 녹색 화살표, 매도에는 빨간색 화살표만 보이지만, 더 간단한 거래 경험을 제공하기 위해 많은 지표가 함께 작동하고 있습니다. 이는 정확한 진입점을 제공하도록 설계되었습니다. 많은 진입점이 아니라, 우리 지표가 추세 변화를 나타내고 이전 추세의 반대 방향으로 0 레벨을 넘을 때 특정 진입점을 제공합니다. 더 정확한 거래를 달성하기 위해 지표는 추세 변화를 확인하기 위해 첫 번째 되돌림을 기다려 잘못된 반전을 피합니다. 따라서 이전 추세의 돌파와 되돌림 확인 후 신호가 발행됩니다. 이것은 매우 신중한 거래 접근 방식입니다, 따라서 이러한 팁을 따르는 것이 중요합니다(초보자 및 고급 트레이더 모두 이 전략을 사용할 수
PRO Renko System
Oleg Rodin
5 (25)
PRO Renko System 은 RENKO 차트 거래를 위해 특별히 고안된 매우 정확한 거래 시스템입니다. 이것은 다양한 거래 상품에 적용될 수있는 보편적 인 시스템입니다. 체계는 효과적으로 당신에게 정확한 반전 신호에 접근을 주는 소위 시장 소음을 중화합니다. 이 표시기는 사용하기가 매우 쉽고 신호 생성을 담당하는 매개 변수가 하나만 있습니다. 당신은 쉽게 당신의 선택의 어떤 무역 계기에 공구를 적응시킬 수 있고 renko 막대기의 크기. 나는 항상 당신이 내 소프트웨어로 수익성있게 거래 할 수 있도록 추가 지원을 제공 할 준비가되어 있습니다! 나는 당신에게 행복하고 수익성있는 거래를 기원합니다! 구매 후 저에게 연락하십시오! 내 렌코 차트 생성기를 보내드립니다. 또한 내 개인 권장 사항 및 시스템의 다른 모듈을 무료로 공유 할 것입니다!
Advanced Currency IMPULSE with ALERT
Bernhard Schweigert
4.91 (494)
현재 31% 할인!! 초보자 또는 전문가 트레이더를 위한 최고의 솔루션! 이 지표는 우리가 독점 기능과 비밀 공식을 통합했기 때문에 독특하고 고품질이며 저렴한 거래 도구입니다. 단 하나의 차트로 28개 통화 쌍 모두에 대한 경고를 제공합니다. 새로운 추세 또는 스캘핑 기회의 정확한 트리거 포인트를 정확히 찾아낼 수 있기 때문에 거래가 어떻게 개선될지 상상해 보십시오! 새로운 기본 알고리즘을 기반으로 구축되어 잠재적인 거래를 훨씬 더 쉽게 식별하고 확인할 수 있습니다. 이는 통화의 강세 또는 약세가 가속되는지 여부를 그래픽으로 표시하고 가속 속도를 측정하기 때문입니다. 자동차의 속도계처럼 생각하면 됩니다. 가속화할 때 Forex 시장에서 동일한 일이 분명히 더 빠르게 발생합니다. 즉, 반대 방향으로 가속화되는 통화를 페어링하면 잠재적으로 수익성 있는 거래를 식별한 것입니다. 통화 모멘텀의 수직선과 화살표가 거래를 안내합니다! 역동적인 Market Fibonacci 23
Scalper Vault
Oleg Rodin
5 (29)
Scalper Vault 는 성공적인 스캘핑에 필요한 모든 것을 제공하는 전문 스캘핑 시스템입니다. 이 표시기는 외환 및 바이너리 옵션 거래자가 사용할 수 있는 완전한 거래 시스템입니다. 권장 시간 프레임은 M5입니다. 시스템은 추세 방향으로 정확한 화살표 신호를 제공합니다. 또한 상단 및 하단 신호와 Gann 시장 수준을 제공합니다.  이 시스템은 사용하기가 매우 쉽습니다. 원하는 시장 지역의 화살표만 따라가면 됩니다. 엑시트는 가격이 적정 수준에 도달하거나 시장의 고점 또는 저점 신호가 나타날 때 수행됩니다.  표시기는 PUSH 알림을 포함한 모든 유형의 경고를 제공합니다. 인디케이터 구매 후 연락주세요. 내 개인 거래 권장 사항과 훌륭한 보너스 지표를 무료로 공유합니다! 나는 당신에게 행복하고 유익한 거래를 기원합니다!
TrendMaestro
Stefano Frisetti
5 (3)
note: this indicator is for METATRADER4, if you want the version for METATRADER5 this is the link:  https://www.mql5.com/it/market/product/108106 TRENDMAESTRO ver 2.4 TRENDMAESTRO recognizes a new TREND in the bud, he never makes mistakes. The certainty of identifying a new TREND is priceless. DESCRIPTION TRENDMAESTRO identifies a new TREND in the bud, this indicator examines the volatility, volumes and momentum to identify the moment in which there is an explosion of one or more of these data a
Basic Harmonic Patterns Dashboard
Mehran Sepah Mansoor
5 (2)
이 대시보드는 선택한 심볼에 대해 사용 가능한 최신 고조파 패턴을 표시하므로 시간을 절약하고 더 효율적으로 사용할 수 있습니다 / MT5 버전 . 무료 인디케이터: Basic Harmonic Pattern 인디케이터 열 Symbol : 선택한 심볼이 나타납니다 Trend : 강세 또는 약세 Pattern : 패턴 유형(가틀리, 나비, 박쥐, 게, 상어, 사이퍼 또는 ABCD) Entry : 진입 가격 SL: 스톱로스 가격 TP1: 1차 테이크프로핏 가격 TP2: 2차 테이크프로핏 가격 TP3: 3차 테이크프로핏 가격 Current price: 현재 가격 Age (in bars): 마지막으로 그려진 패턴의 나이 주요 입력 Symbols : "28개 주요 통화쌍" 또는 "선택한 심볼" 중에서 선택합니다. Selected Symbols : 쉼표로 구분하여 모니터링하려는 원하는 심볼("EURUSD,GBPUSD,XAUUSD")을 선택합니다. 브로커에 쌍에 접미사 또는 접두사가
Volume by Price MT4
Brian Collard
4.71 (14)
The Volume by Price Indicator for MetaTrader 4 features Volume Profile and Market Profile TPO (Time Price Opportunity). Volume and TPO histogram bar and line charts. Volume Footprint charts. TPO letter and block marker collapsed and split structure charts. Session filtering and grouping. Static, dynamic and flexible range segmentation and compositing methods with relative and absolute visualizations. Graphical layering, positioning and styling options to suit the user's analytic and aesthetic n
Up down v6T
Guner Koca
5 (1)
Thise indicator is up down v6  comes with tradingwiev pinescript. purchased people, after installed on terminal ,contact me on mql5  to get BONUS  TradingView pinescript. up-down indicator is no repaint and works all pairs and lower than weekly time frames charts. it is suitable also 1 m charts for all pairs. and hold long way to signal. dont gives too many signals. when red histogram cross trigger line that is up signal.and price probably will down when blue histogram cross trigger line that
EasyTrade Indicator
Gabor Bocsak
5 (6)
다중 통화 및 다중 시간대 매수 및 매도 알림. 자동 추적 중지 및 위험 보상 이익 실현! 지표는 시장을 스캔하고 분석하므로 귀하가 할 일이 없습니다! 하나의 차트에서 모든 통화를 거래하세요!   구매 후 댓글 남겨주시면 연락드리겠습니다. 무역도우미 EA를 보내드리겠습니다. 표시기는 여러 오실레이터와 부착된 필터를 사용하여 최상의 확인 진입점을 찾으므로 걱정할 필요가 없습니다! 이는 귀하에게 경고하고 귀하가 시청하기로 선택한 모든 기간과 통화에 대한 버튼을 그립니다. 버튼을 누르면 차트로 이동하여 거래를 시작할 수 있습니다! 이 표시기는 또한 모든 기본 및 시장 감시 통화에 대한 강도 패널을 그립니다(설정에서 조정 가능). 그러면 모든 통화 쌍과 선택한 더 높은 기간의 통화가 표시됩니다. 표시기 창에는 추세 필터가 포함된 특수 MACD 히스토그램과 차트 통화에 대한 다중 기간 추세 패널이 있습니다! 모든 통화와 시간대에 대한 거래 알림을 제공하며 버튼을 누르면
MTF Supply Demand Zones
Georgios Kalomoiropoulos
4.83 (23)
자동화된 수요 및 공급 구역의 차세대. 모든 차트에서 작동하는 새롭고 혁신적인 알고리즘. 모든 구역은 시장의 가격 움직임에 따라 동적으로 생성됩니다. 두 가지 유형의 경고 --> 1)가격이 영역에 도달할 때 2)새로운 영역이 형성될 때 당신은 더 이상 쓸모없는 지표를 얻을 수 없습니다. 입증된 결과로 완벽한 거래 전략을 얻을 수 있습니다.     새로운 기능:     가격이 공급/수요 영역에 도달하면 경고     새로운 공급/수요 구역이 생성되면 알림     푸시 알림 알림     핍의 영역 너비 레이블     기동특무부대에 한 번 더 시간이 주어집니다. 따라서 현재보다 위의 2개의 시간 프레임 대신 현재보다 높은 3개의 시간 프레임을 볼 수 있습니다.     Alerts/Zones/MTF 기능을 활성화/비활성화하는 버튼 당신이 얻는 이점:     거래에서 감정을 제거하십시오.     거래 항목을 객
TrendDecoder Premium
Christophe Pa Trouillas
5 (5)
범위 및 다음 가능한 움직임 식별   |  추세의 초기 신호와 강도를 확인하세요   |  반전 전 명확한 출구 확보   |  가격이 테스트 할 피보 레벨 파악 비추적, 비지연 지표 - 수동 및 자동 거래에 이상적 - 모든 자산 및 모든 시간 단위에 적합 기간 한정 혜택 >>   50% 할인 구매 후 이 채널로 문의 하여 권장 설정을 확인하세요. MT5   버전:   여기를 클릭하세요 BladeSCALPER   및   PowerZONES   로 전체 방법을 확인하세요. 어떤 서비스인가요? 트렌드디코더는 추세 모니터링을 간단하고 쉽게 하기 위한 여러 혁신 기술의 집약체입니다. 투영 추세선(투영 추세선) - 다가오는 추세의 속도 기준 실시간 추세선과 투영 추세선 비교 - 시장이 이전과 같은 방향으로 움직이고 있는지, 아니면 둔화되고 있는지? 실시간 추세선 교차 - 추세가 궤도를 이탈하고 있습니다. 그레이박스 - 시장이 더 이상 추세가 아니며 새로운 전환기에 들어섰습
제작자의 제품 더 보기
The indicator is based on MA with additional processing of all the current prices, as well as all Highs and Lows for an appropriate period. The product efficiently displays trend changes and tracks a trend line and color if conditions remain unchanged. The indicator has only three parameters making it easy to configure. Parameters PeriodTrend  - amount of bars used for a trend calculation PeriodAverage - indicator line averaging period Method - averaging method
The indicator shows the exact price position in the current market on any symbol. It shows the trend direction on the current chart as well as on the two subsequent higher timeframes at the same time (from top to bottom). For example, you can observe the trend direction on M5 and M15 without leaving the M1 chart. The indicator switches all trend depending on the market conditions preventing you from entering against a trend or allowing you to exit a position in a timely manner. The indicator is
This indicator shows the current market situation relative to the price volatility channel, its external and internal boundaries, displays the last direction of the price movement. The main purpose of the indicator is to identify the trend movement and its boundaries. With a wide channel, it can be used for determining the initial price movement waves. It works on any instrument and any time frame of the chart. It works in 2 different modes: The first mode shows any changes in the channel when t
The oscillator shows reversal points and the movement strength very well. It can be used on any symbol and any timeframe. It has a parameter of the level when the signal reaches the required power. The indicator is very easy to setup. Indicator bars are not redrawn. Description of the Parameters PeriodPower - signal power calculation period LevelPower - the required level of the signal power
Индикатор очень своевременно показывает изменение направления рынка на любом инструменте.   Более того, этот индикатор мультитаймфреймовый, что позволяет увидеть на текущем периоде графика смену направления движения рынка с более старшего таймфрейма. Стрелка вверх сигнализирует о восходящем движении, стрелка вниз - о нисходящем. Каждая стрелка имеет свою ценовую составляющую, равную(как правило) значению экстремума на используемом таймфрейме, что можно использовать в качестве установки стоповых
Индикатор очень своевременно показывает входы в рынок на любом инструменте.  Каждая стрелка имеет свою ценовую составляющую, равную(как правило) значению экстремума на используемом таймфрейме, что можно использовать в качестве установки стоповых ордеров или других действий при применении индикатора в советниках. Индикатор имеет минимальное количество параметров, позволяющих без особого труда настроить его работу. Параметр Level_Open  отвечает за скорость выдачи сигнала. Чем больше этот парамет
Veles dMA Plus
Gennady Mazur
Новая серия индикаторов Veles Dynamic.   Индикаторы не перерисовывают своих значений. Эти индикаторы работают быстрее и точнее аналогичных по названию. Индикатор Veles_dMA_Plus представляет собой динамическую МА, рассчитанную по текущим ценам инструмента. Имеется возможность динамического сглаживания линии. Есть возможность отображения текущего трендового канала с изменением его волатильности. Параметры: period - период динамической МА price - применяемая цена shift - сдвиг МА влево от
Veles dMACD
Gennady Mazur
Новая серия индикаторов Veles Dynamic.     Индикаторы не перерисовывают своих значений. Эти индикаторы работают быстрее и точнее аналогичных по названию. Индикатор Veles_dMACD представляет собой разницу показаний между двух динамических МА, рассчитанных по текущим ценам инструмента. Хорошо показывает разворотные моменты, позволяет точно определять дивергенции. Имеет цветовое сопровождение изменения показаний. Параметры: period_Fast - период быстрой динамической МА period_Slow  - период
Veles dChannel
Gennady Mazur
Новая серия индикаторов Veles Dynamic.     Индикаторы не перерисовывают своих значений. Эти индикаторы работают быстрее и точнее аналогичных по названию. Индикатор Veles_dChannel представляет собой динамическую МА с расчетным каналом по текущим ценам инструмента. Индикатор показывает полностью законченное движение в цикле. Данный индикатор может использоваться в качестве установки и траллирования стопов при скальпинге.  Параметры: period - период динамической МА price - применяемая це
Veles dTrend
Gennady Mazur
Новая серия индикаторов Veles Dynamic.     Индикаторы не перерисовывают своих значений. Эти индикаторы работают быстрее и точнее аналогичных по названию. Индикатор Veles_dTrend представляет собой гистограмму, рассчитанную на основе нескольких динамических алгоритмов, использующих текущие цены инструмента. Пока индикатор не покажет смену тренда, будьте уверены, что тренд продолжит свое направление. Кроме этого, есть зоны принятия решения, которые ограниченны уровнями.В этих зонах будет
Этот индикатор - очередная разновидность ЗигЗага, за исключением, он не рисует текущую линию, которая может перерисоваться. Этот индикатор, если нарисовал конечную точку, по закрытому бару, то больше ее не изменяет - это означает смену направления и следующая точка будет другого цвета. Может быть применен как для определения основного движения, при использовании увеличенных параметров, так и непосредственно для входа с минимальным риском.Очень хорошо показывает все волны. Работает с любым инстр
Индикатор iVeles_Channel_Extremum_II_MTF вычисляет точки слома направлений движения цены на установленном в параметрах ТФ, на основе этих точек и выбранного их количества строится основной канал цены, который можно использовать в качестве уровней поддержки и сопротивления для меньшего ТФ, на котором установлен индикатор. В зависимости от направления движения основного тренда рассчитывается средняя линия канала по уровню Фибоначи, от которой, как правило, идет отскок в сторону тренда. Также по ур
Veles MACD Pro
Gennady Mazur
Индикатор iVeles_MACD_Pro представляет симбиоз обычного индикатора MACD или  разницу показаний между двух динамических МА, рассчитанных по текущим ценам инструмента. Сигнальная линия отсутствует, но ее заменяет более точные динамические облачные уровни. Хорошо показывает разворотные моменты, позволяет точно определять дивергенции. Имеет цветовое сопровождение изменения показаний. Параметры: period_Fast - период быстрой МА period_Slow    - период медленной МА price_Bar - применяемая цена leve
Veles RSI
Gennady Mazur
Индикатор iVeles_RSI представляет собой  обычный  RSI, привязанный к нулевой отметке . В отличии от обычного RSI, наложены уровни сигнала в виде облака, что заметно расширяет области применения данного индикатора. Очень хорошо показывает разворотные моменты, так же позволяет точно определять дивергенции. Параметры: period - период RSI price - применяемая цена level - уровень облака
Veles RVI
Gennady Mazur
Индикатор iVeles_RVI представляет собой  обычный  RVI, с пересчитанными и приведенными значениями . В отличии от обычного RVI, наложены уровни сигнала в виде облака, что заметно расширяет области применения данного индикатора. Очень хорошо показывает разворотные моменты и циклы тенденций, так же позволяет определять дивергенции. Параметры: period - период RVI price - применяемая цена level - уровень облака
Veles DeMarker
Gennady Mazur
Индикатор iVeles_DeMarker представляет собой  обычный  DeMarker, с пересчитанными и приведенными к нулю значениями . В отличии от обычного DeMarker, наложены уровни сигнала в виде облака, что заметно расширяет области применения данного индикатора. Очень хорошо показывает разворотные моменты и циклы тенденций, так же позволяет определять дивергенции. Параметры: period - период DeMarker level - уровень облака
Veles CCI
Gennady Mazur
Индикатор iVeles_CCI представляет собой  обычный  CCI . В отличии от обычного CCI, наложены уровни сигнала в виде облака, что заметно расширяет области применения данного индикатора. Очень хорошо показывает окончание трендов, разворотные моменты и циклы тенденций, так же позволяет определять дивергенции. Параметры: period - период CCI price - применяемая цена level - уровень облака
Veles Moment
Gennady Mazur
Индикатор iVeles_Moment представляет собой  обычный  Momentum, с пересчитанными и приведенными к нулю значениями . В отличии от обычного Momentum, наложены уровни сигнала в виде облака, что заметно расширяет области применения данного индикатора. Очень хорошо показывает разворотные моменты и циклы тенденций, может применяться как основной сигнал для входа в позицию. Параметры: period - период Momentum price - применяемая цена level - уровень облака
Индикатор iVeles_Trend_X_II - использует специализированный расчет текущих цен графика. Очень качественно и своевременно показывает смену направления, более того, отображаемая цена индикатора может быть использован в качестве уровня принятия решения. Работает качественно на любом ТФ и с любым инструментом. Параметры: period - период расчетов average   - усреднение  МА method - применяемый метод shift - сдвиг показаний
Индикатор iVeles_Perfect_Oscilator является опережающим и одним из самых лучших осциляторов на сегодняшний день,  использует специализированный расчет текущих цен графика.  Очень качественно и своевременно показывает смену направления, очень точный подход к уровням перекупленности и перепроданности, что позволяет своевременно принять решение по сделке.  Работает качественно на любом ТФ и с любым инструментом. Параметры: period_Osc - период расчетов average_Osc  - усреднение  МА method_Osc - прим
Индикатор iVeles_Perfect_Oscilator является опережающим и одним из самых лучших осциляторов на сегодняшний день,  использует специализированный расчет текущих цен графика.  Очень качественно и своевременно показывает смену направления, очень точный подход к уровням перекупленности и перепроданности, что позволяет своевременно принять решение по сделке.  Работает качественно на любом ТФ и с любым инструментом. Параметры: Period - период расчетов Average  - усреднение  МА Method - применяемый мето
필터:
리뷰 없음
리뷰 답변