• 미리보기
  • 리뷰
  • 코멘트

Reversal High Low

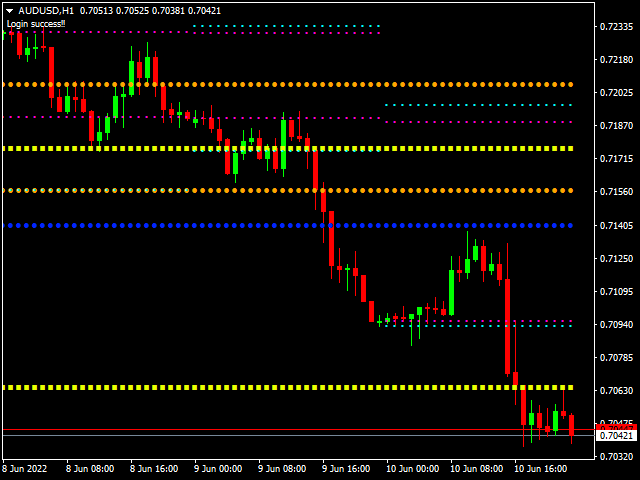
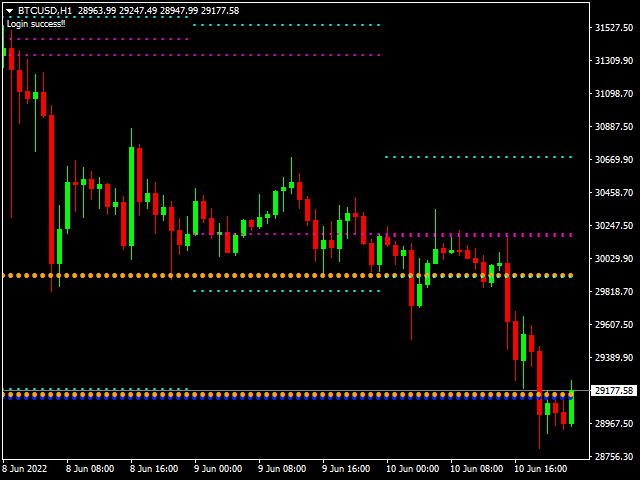
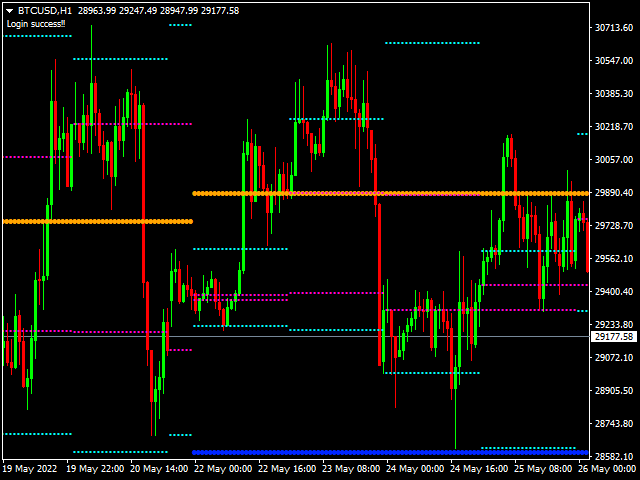
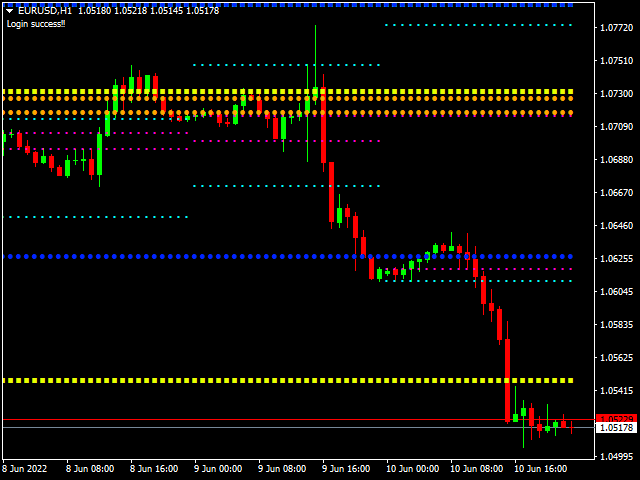
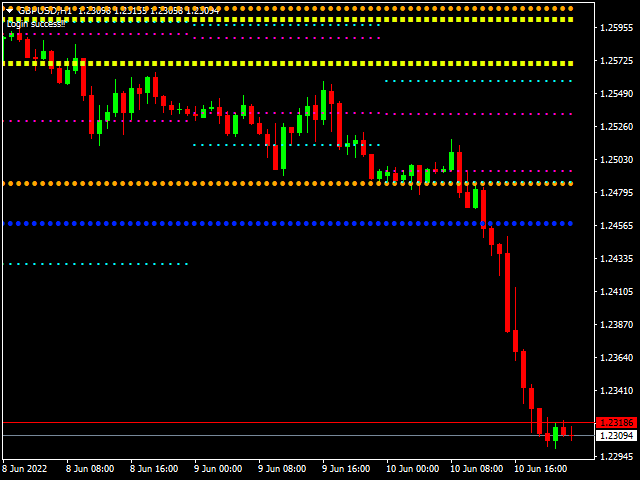
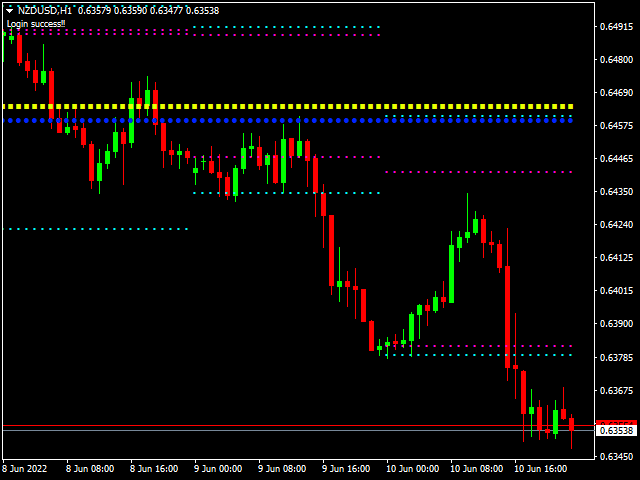
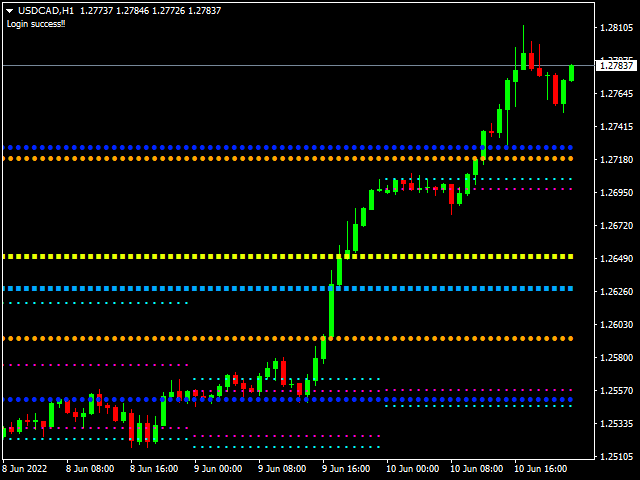
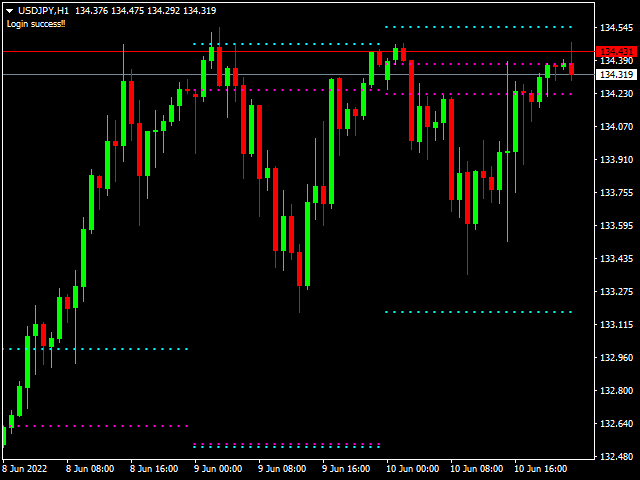
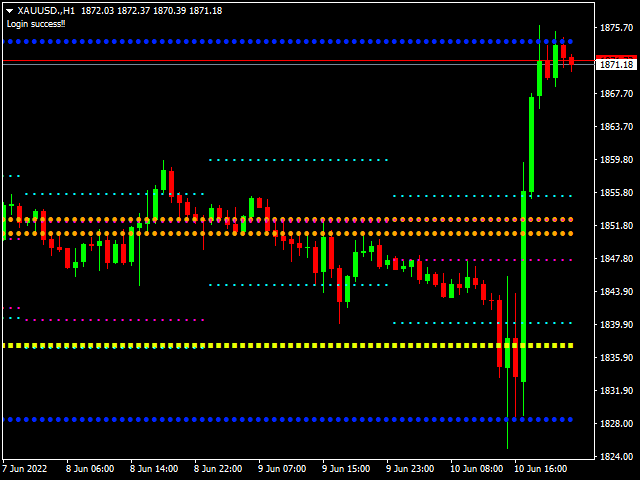
Inficator MT4 : HiLo

Objective : Find Support and Resistance zone


How to set up Indicator  HiLo:

1. Indicators type multi time frame are MN1 W1 D1 H4.

2. Customize for use MN1 only or W1 only or D1 only or H4 only or open all.

3. We use MN1 and W1 for set to Key level.

4. For Close price or Open price to high price set for  Resistance zone.

5. For Close price or Open price to Low price set for  Support zone.


How to trade for success :

Entry point : Buy / Long position

1. Price bid hit the first time Support zone you can entry order Buy and stop loss  when price break support zone 10 pips.

2. Take profit you can consider for 38.2 - 61.8% of High to Low.


Entry point : Sell / Short position

1. Price bid hit the first time Resistance zone you can entry order Sell and stop loss when price break support zone 10 pips.

2. Take profit you can consider for 38.2 - 61.8% of Low to High.


Good luck everyone.


추천 제품
The EA uses scalping strategy at night, trading consists of three algorithms and each algorithm works in its own time interval. The EA uses many smart filters to adapt to almost any economic situation. Pending orders are used for the least slippage when trading scalping. The adviser is safe and does not require any settings from the user, just install it on the chart and you are ready. The EA sets a protective stop order, so the trader does not have to worry that the robot will allow significant
Would you like to learn a technical system refined by centuries of use, but virtually unknown here? A system so versatile that it can be fused with any other indicator/technical tool? A system as pleasurable to use as it is powerful? If so, this indicator which scans candlestick charting techniques is for you. You should find it valuable no matter what your background in technical analysis. This trading system has been designed after years of hard work and back testing. Indicator will find stro
Mars 15  is a Break   indicator is a powerful indicator of Pattern trade for any par and any timeframe. It doesn't requires any additional indicators for the trading setup.The indicator gives clear signals about opening and closing trades.This Indicator is a unique, high quality and affordable trading tool.  Can be used in combination with other indicators Perfect For New Traders And Expert Traders Low risk entries. Never repaints signal. Never backpaints signal. Never recalculates signal. For M
Mars  14  is a Break indicator is a powerful indicator of Pattern trade for any par and any timeframe. It doesn't requires any additional indicators for the trading setup.The indicator gives clear signals about opening and closing trades.This Indicator is a unique, high quality and affordable trading tool.  Can be used in combination with other indicators Perfect For New Traders And Expert Traders Low risk entries. Never repaints signal. Never backpaints signal. Never recalculates signal. For M
Trend New
Vitalii Zakharuk
Trend New Trend Indicator, shows the signals for entry. Displays both entry points and the trend itself. Shows statistically calculated moments for entering the market with arrows. When using the indicator, it is possible to optimally distribute the risk factor. Settings: Uses all one parameter for settings. Selecting a parameter, it is necessary to visually resemble it so that the appropriate graph has a projection of extremes. Options: Length - the number of bars for calculating the ind
Range Dashboard
DIMITAR ILCHEV
A trading range takes place when a financial instrument (stocks, indices, bonds, commodities, Forex currencies or cryptocurrencies) oscillates between two upwards and downwards boundaries for a period of time. This Indicator tool help us to view range on the chart bar per bars, also set range in percent and get clean posicion.  Range trading works best in the absence of a trend. When the markets lack a clear direction, that’s when these consolidation periods settle in. Alternatively, more exper
The Rise of Sky walker   is a trend indicator is a powerful indicator for any par and any timeframe. It doesn't requires any additional indicators for the trading setup.The indicator gives clear signals about opening and closing trades.This Indicator is a unique, high quality and affordable trading tool.  Can be used in combination with other indicators Perfect For New Traders And Expert Traders Low risk entries. Never repaints signal. Never backpaints signal. Never recalculates signal. Great F
Mars 6 is a  Oscillators  indicator  is a powerful indicator of  Break Zone  for any par and any timeframe. It doesn't requires any additional indicators for the trading setup.The indicator gives clear signals about opening and closing trades.This Indicator is a unique, high quality and affordable trading tool. Perfect For New Traders And Expert Traders Low risk entries. Never repaints signal. Never backpaints signal. Never recalculates signal. For MT4 Only Great For Scalping Great For Swing
Immortal
Paranchai Tensit
The EA is based on trend trading strategy . Mechanism " trend trading strategy " is a tendency of a financial market price to move in a particular direction over time. If there is a turn contrary to the trend, This mechanism will exit and wait until the turn establishes itself as a trend in the opposite direction, and re-enter when the trend re-establishes. This EA has been back tested for 4 years of real tick data (2019-2022), consistent with the latest trading accounts. Immortal MT4:   https:
The indicator is like a mother-in-law, who talks often, talks a lot and often inappropriately. The indicator, in addition to giving us an entry signal on parameters which I will then list, monitors the trend of the hourly timeframe, OSMA to understand the entry direction, RSI to sense any overbought or oversold conditions from which to abstain, ATR for the volatility and ADX for the trend. Indicator not recommended for newbies. Only the human judgment of these parameters, combined with the e
Legacy
Ivan Simonika
This is a hybrid trend indicator, as it is based on the signals of elementary indicators and a special algorithm for analysis. The smart algorithm of the indicator determines the trend, filters out market noise and generates input signals. The indicator uses a color alarm: blue - when changing from descending to ascending, and red - on the contrary, to descending. You can use the indicator as the main indicator for determining the trend. The indicator can work both for entry points and as a filt
Indicator Name: Signal Generator Non Repaint MT4 The arrow is non-repaint. Its a non-repaint arrow or money back guarantee. Arrow appeared after candle closed. Very accurate. Time Frame: Any Assets: Any This is MT5 version I use this to trade Gold, US30, Nasdaq and Dax at New York and London Opening. TF m5/m15 Parameters: Push Notifications = True ( You can set the alert send to your mobile phone) To Setup Sending Alert to your mobile phone 1. At Metatrader Options > Options > Notifications >
Bluey EURUSD h1
Raphael Schwietering
2 (1)
Introducing Bluey, the next evolution in automated trading technology. Bluey isn't just another run-of-the-mill trading robot; it's a sophisticated system engineered to redefine your trading experience. Powered by cutting-edge algorithms and state-of-the-art features, Bluey seamlessly blends technical analysis, artificial intelligence, and machine learning to provide traders with accurate and profitable trading signals. Bluey's advanced technology excels at identifying lucrative trading oppor
Candlestick Patterns Scanner MT4
KEENBASE SOFTWARE SOLUTIONS
KT Candlestick Patterns Scanner is a Multi-Symbol and Multi-Timeframe scanner that fetches and shows various candlestick patterns on 28 currency pairs and 9 time-frames concurrently . The scanner finds the candlestick patterns by loading the KT Candlestick Patterns indicator as a resource in the background. Features The scanner can find the candlestick patterns on 252* combinations of symbols and time-frames from a single chart. Open the signal's chart loaded with a predefined template with
Th3 BarPlay Signals Mt4
Nnamdi Kennedy Ifeorah
이것은 3Bar_Play로 알려진 Price Action 기반 전략이며 3Bar 촛대 패턴 형성을 기반으로 합니다. 매수/매도 신호 화살표를 표시하기 전에 필터 및 확인을 위해 추가 표시기가 추가됩니다. 상승 추세, 하락 추세 또는 횡보 시장에서 거래될 수 있습니다. 추가된 지표는 다음과 같습니다. 스토캐스틱 - 모멘텀 피셔 - 트렌드 ATR - 신호 화살표의 베이스에서 손절매 배치를 명확하게 정의하는 변동성(ATR 손절매 방법 사용). 좋은 위험 관리를 통해 보상에 대한 위험은 1:1에서 1:4 사이가 될 수 있습니다. 매수 - 약세 막대 2개와 강세 막대 1개 후에 매수 신호가 나타날 때. 매도 - 2개의 강세 막대와 1개의 약세 막대 후에 매도 신호가 나타날 때. 추가 기능 차트의 신호를 켜거나 끄는 토글 버튼이지만 경보는 아닙니다. 설정 패널에서 조정 가능한 매개변수(다운로드 시 기본 설정). 이메일/푸시 알림을 활성화하여 화면에서 멀리 떨어져 있을 때 신호를 알려줍니다.
The Icarus Reversals(TM) Indicator is a powerful tool to identify high-probability reversal points, across all instruments.  The Reversals Indicator provides traders and investors with a simple-to-use and highly dynamic insight into points of likely price-action reversals.  Generated by a unique proprietary code-set, the Reversals Indicator generates long and short trade signals, which can be customised for all inputs, allowing for the complete optimisation fitted to any trader or investor style
Dear traders and investors, Introducing   Vikopo Fractal MT4 , Developed by a team of experienced traders with trading experience of over 15 years. MT5 Version : https://www.mql5.com/en/market/product/114986 products List : https://www.mql5.com/en/users/vikopoadvise/seller Strategy Introduction : When utilizing this robot, we have harnessed the power of cutting-edge neural plugins to enhance its capabilities. By integrating these neural plugins, our trading robot is equipped with
Big Player EA AUDUSD is an EA that generates trading signals with custom strategies. The EA scans 5 months of history and generates signals and buys or sells on these signals. At least 5 months of data should be behind when testing the EA. Also, cross Takeprofit strategies are implemented in the EA. Single, double, triple and quad TP strategies are applied. Thanks to the cross Takeprofit strategies, the EA works easily even during high activity times.  Big Player EA Family Single Symbols:   EU
MoveWave
Andriy Sydoruk
MoveWave - Moving waves are very handy indicators for determining pivot levels. Most Forex traders make decisions based on technical analysis. This type of analysis determines patterns and trends in the market. With the help of complex mathematical equations that are combined and made out in the form of this indicator, the trader will be able to more accurately determine the price reversal levels. Wave theory mathematically represents various behavioral models of the market. It is used as the ba
Mighty Scalper
Ahmet Metin Yilmaz
Mighty Scalper LightEA A Trend Friendly EA There are different and complex logic mixed in it It begins to work, simply with a BreakOut strategy and Works in PARTIAL CLOSE and CLOSE TIME LIMIT you had never seen before in the market expert... It opens an order and use partial close in a specific levels and close order within a specific time ( if order still live ) No Martingale and hedging It works any kind of broker, but lower spread gets more gain Fast optimization for strategy tester ( for
Elasticity MT4
Marta Gonzalez
Elasticity     - it is a Secure Automated Software for trade Forex market and indices. This EA modifies the distances depending on the market situation, being able to shorten or increase the distances depending on how the algorithm reads the market. The system operates market breaks. Looking for the market point of greater efficiency ris/ benefit , to minimize the risks of margin call. The system uses two different algorithms, one to follow the trend and the other to operate market pullbacks
Premium M15
Raphael Schwietering
Dear Investor, I am a full-time system developer since 2010, having developed thousands of trading systems in the last 11 years. My main goal when developing a strategy is long-term growth. All my systems have to pass strict criteria in terms of backtests, out-of-sample validations on unseen symbols, Monte Carlo simulations on different data feeds, slippage, and increased spreads.  It: Trades the EURUSD M15 with a focus on long-term growth. Opens trades at bar and uses no martingale nor any gri
HERO Time USDJPY
Yang Shu Shen Chuan
"HERO_Time_USDJPY"에 관심을 가져 주셔서 감사합니다. "HERO_Time_USDJPY"의 개요: 최소 자본으로 운용 가능 포지션을 몇 시간 동안만 보유 완전히 방치 가능 이해하기 쉬운 설정 이 EA는 포트폴리오에 추가하고 싶을 만한 가치 있는 EA일 수 있으니 천천히 읽어보시기 바랍니다. "HERO_Time_USDJPY" 세부 정보: 1,000 USD의 마진으로 0.27 Lots로 운용 가능 USDJPY의 1시간 차트에 설정하여 운용 이는 이상형의 데이 트레이딩 EA 유형 데이 트레이딩으로 인해 포지션은 몇 시간 동안만 보유 특정 시간에 진입하며, TP/SL 또는 특정 시간에 청산 시장 상황을 확인하고, 유리할 때에만 진입 스프레드에 대한 내성이 있어 스프레드가 넓은 브로커 및 계정에서도 사용 가능 다음과 같은 분들에게 추천합니다: 철저한 백테스트 및 분석 도구를 활용하여 신뢰성 높은 EA를 사용하고 싶은 분 안정적인 수익을 추구하며 리스크를 관리하고 싶은 분 포트폴리
TrendScanner XTra scans market trends from Multi Symbols and Multi Timeframes with extra additional Entry Point Signals arrow on the current chart. Features: -Entry Point SIgnals :  This is additional feature in the indicator. No repaint arrows. The Trading system in the single indicator. MTF Trend informations and Entry Signals. In order to make it easier for trader to get trading moments from a single chart and  deciding entry time.  -Changeable Panel Display :  Change the value of Max.Symbo
Super Trend Channels
Muhammed Emin Ugur
Super Trend Channels MT4 Indicator Looking for a versatile and powerful channel indicator for your MetaTrader 4 trading platform? Look no further than the "Super Trend Channels" indicator! This advanced tool is designed to help traders identify trend channels accurately, enabling you to make informed trading decisions with confidence. Key Features: Multi-Channel Support: The "Super Trend Channels" indicator supports multiple channels simultaneously. You can visualize various channel types, inclu
VolumeOHLC
Ahmet Metin Yilmaz
An "Intraday" indicator makes no sense anymore above H1 !! VOHLC is calculated using the following formula: VOHLC= ( Price * Volume ) / Volume Where Price= ( Open + High + Low + Close ) / 4 Volume= Tick Volume   This indicator helps us to understand the current direction of the trend in the selected period. Typically, the indicator is calculated for one day, so there is no reason to use it on timeframes larger than the H1 timeframe.
The AlgoKing Lightning Bolt Strategy is a trade manager and has multiple indicators built for a complete trading strategy.  Here is a list of indicators built in. Indicators Auto drawn Support and Resistance signals Auto drawn RSI Divergence signals Auto drawn Fibonacci Retracement signals with buy and sell entry lines. Lightning Bolt reversal signals. Auto drawn trend lines. Trade Management Auto take partials at simple moving average targets. Auto take partial and stop losses at Fibonacci re
KT Displaced Moving Averages MT4
KEENBASE SOFTWARE SOLUTIONS
KT DMA is a modified and advanced version of the classic Displaced Moving Averages with buy/sell crossover alerts and a Multi-Timeframe scanner that shows DMA's direction across each real-time time frame. A Displaced Moving Average is a simple moving average that moves ahead or backward in a time frame (either short-term or long-term). It also allows you to predict price movement more accurately. Features Depicts the trend direction using the alignment of three moving averages. Buy/Sell signa
Dear traders and investors, Introducing   Vikopo ZigZag MT4 , Developed by a team of experienced traders with trading experience of over 15 years. MT5 Version : https://www.mql5.com/en/market/product/116125 products List : https://www.mql5.com/en/users/vikopoadvise/seller Strategy Introduction : When utilizing this robot, we have harnessed the power of cutting-edge neural plugins to enhance its capabilities. By integrating these neural plugins, our trading robot is equipped with
Anemone
Sean Christian Hammond
인공 지능, AI를 사용하여 살아있는 유기체의 눈에 보이는 행동 패턴을 추세 분석에 통합하기 위해 만들어졌습니다. 카오스 이론은 이동 평균을 만납니다. 말미잘을 공급하는 필터는 덩굴손을 영양분의 바다로 뻗어 스스로를 풍요롭게 합니다. 너무 긴 설명으로 시간을 낭비하지 않겠습니다.이 개념은 이러한 용어로 이해할 수 있습니다. 사용자가 지정한 시간 입력에 따라 Simple, Exponential, Weighted 및 Smoothed 사이를 전환하는 사용자 정의 가능한 기간 회전 이동 평균입니다. 로테이션은 Semi Chaotic이며, 시장 자체에 의해 주입되는 무작위성입니다. 이러한 MA가 서로 겹쳐지면 촉수가 환경으로 뻗어 나가는 말미잘의 필터가 공급되는 효과가 나타납니다.,.
이 제품의 구매자들이 또한 구매함
Gann Made Easy
Oleg Rodin
4.96 (48)
Gann Made Easy 는 mr.의 이론을 사용하여 최고의 거래 원칙을 기반으로 하는 전문적이고 사용하기 쉬운 Forex 거래 시스템입니다. W.D. 간. 이 표시기는 Stop Loss 및 Take Profit Levels를 포함하여 정확한 BUY 및 SELL 신호를 제공합니다. PUSH 알림을 사용하여 이동 중에도 거래할 수 있습니다. 구매 후 연락주세요! 내 거래 팁과 훌륭한 보너스 지표를 무료로 공유하겠습니다! 아마도 Gann 거래 방법에 대해 이미 여러 번 들었을 것입니다. 일반적으로 Gann의 이론은 초보자 거래자뿐만 아니라 이미 거래 경험이 있는 사람들에게도 매우 복잡한 것입니다. Gann의 거래 방식은 이론적으로 적용하기 쉽지 않기 때문입니다. 나는 그 지식을 연마하고 Forex 지표에 최고의 원칙을 적용하기 위해 몇 년을 보냈습니다. 표시기는 적용하기가 매우 쉽습니다. 차트에 첨부하고 간단한 거래 권장 사항을 따르기만 하면 됩니다. 지표는 지속적으로 시장 분석 작업
Atomic Analyst
Issam Kassas
5 (2)
우선적으로 언급할 점은이 거래 지표가 다시 그리지 않고 지연되지 않으며 이를 통해 수동 및 로봇 거래 모두에 이상적이라는 점입니다. Atomic Analyst는 가격의 강도와 모멘텀을 활용하여 시장에서 더 나은 이점을 찾는 PA Price Action Indicator입니다. 고급 필터를 장착하여 잡음과 거짓 신호를 제거하고 거래 잠재력을 높이는 데 도움이 됩니다. 복잡한 지표의 다중 레이어를 사용하여 Atomic Analyst는 차트를 스캔하고 복잡한 수학적 계산을 간단한 신호와 색상으로 변환하여 초보 트레이더가 이해하고 일관된 거래 결정을 내릴 수 있도록합니다. "Atomic Analyst"는 새로운 및 경험이 풍부한 트레이더를위한 종합적인 거래 솔루션입니다. 프리미엄 지표와 최고 수준의 기능을 하나의 거래 전략에 결합하여 모든 종류의 트레이더에 대한 다재다능한 선택지가되었습니다. 인트라데이 거래 및 스캘핑 전략 : 빠르고 정확한 일일 거래 및 단기 거래를 위해 설계
TPSproTREND PrO
Roman Podpora
5 (15)
TPSpro TRENDPRO  - is a trend indicator that automatically analyzes the market and provides information about the trend and each of its changes, as well as giving signals for entering trades without redrawing! The indicator uses each candle, analyzing them separately. referring to different impulses - up or down impulse. Exact entry points into transactions for currencies, crypto, metals, stocks, indices!  -  Version MT5               DETAILED DESCRIPTION        /       TRADING SETUPS           
TPSpro RFI Levels
Roman Podpora
5 (13)
A key element in trading is zones or levels from which decisions to buy or sell a trading instrument are made. Despite attempts by major players to conceal their presence in the market, they inevitably leave traces. Our task was to learn how to identify these traces and interpret them correctly. Reversal First Impulse levels (RFI)   -  Version MT5                INSTRUCTIONS                 RUS                 ENG                                       R ecommended to use with an indicator   -  
Scalper Vault
Oleg Rodin
5 (27)
Scalper Vault 는 성공적인 스캘핑에 필요한 모든 것을 제공하는 전문 스캘핑 시스템입니다. 이 표시기는 외환 및 바이너리 옵션 거래자가 사용할 수 있는 완전한 거래 시스템입니다. 권장 시간 프레임은 M5입니다. 시스템은 추세 방향으로 정확한 화살표 신호를 제공합니다. 또한 상단 및 하단 신호와 Gann 시장 수준을 제공합니다.  이 시스템은 사용하기가 매우 쉽습니다. 원하는 시장 지역의 화살표만 따라가면 됩니다. 엑시트는 가격이 적정 수준에 도달하거나 시장의 고점 또는 저점 신호가 나타날 때 수행됩니다.  표시기는 PUSH 알림을 포함한 모든 유형의 경고를 제공합니다. 인디케이터 구매 후 연락주세요. 내 개인 거래 권장 사항과 훌륭한 보너스 지표를 무료로 공유합니다! 나는 당신에게 행복하고 유익한 거래를 기원합니다!
Advanced Currency Strength28 Indicator
Bernhard Schweigert
4.9 (663)
현재 26% 할인 초보자 또는 전문가 트레이더를 위한 최고의 솔루션! 이 지표는 우리가 독점 기능과 새로운 공식을 통합했기 때문에 독특하고 고품질이며 저렴한 거래 도구입니다. 단 하나의 차트로 28 Forex 쌍의 통화 강도를 읽을 수 있습니다! 새로운 추세 또는 스캘핑 기회의 정확한 트리거 포인트를 정확히 찾아낼 수 있기 때문에 거래가 어떻게 개선될지 상상해 보십시오. 사용 설명서: 여기를 클릭  https://www.mql5.com/en/blogs/post/697384 그것이 첫 번째, 원본입니다! 쓸모없는 지망생 클론을 사지 마십시오. 더 스페셜  강력한 통화 모멘텀을 보여주는 하위 창의 화살표 GAP가 거래를 안내합니다! 기본 또는 호가 통화가 과매도/과매도 영역(외부 시장 피보나치 수준)에 있을 때 개별 차트의 기본 창에 경고 표시가 나타납니다. 통화 강도가 외부 범위에서 떨어질 때 풀백/반전 경고. 교차 패턴의 특별 경고 추세를 빠르게 볼 수 있는
우선적으로, 이 거래 도구는 전문적인 거래에 이상적인 비-다시 그리기 및 지연되지 않는 지표입니다.  스마트 가격 액션 컨셉트 인디케이터는 신규 및 경험 많은 트레이더 모두에게 매우 강력한 도구입니다. Inner Circle Trader Analysis 및 Smart Money Concepts Trading Strategies와 같은 고급 거래 아이디어를 결합하여 20가지 이상의 유용한 지표를 하나로 결합합니다. 이 인디케이터는 스마트 머니 컨셉트에 중점을 두어 대형 기관의 거래 방식을 제공하고 이동을 예측하는 데 도움을 줍니다.  특히 유동성 분석에 뛰어나 기관이 어떻게 거래하는지 이해하는 데 도움을 줍니다. 시장 트렌드를 예측하고 가격 변동을 신중하게 분석하는 데 탁월합니다. 귀하의 거래를 기관 전략에 맞추어 시장의 동향에 대해 더 정확한 예측을 할 수 있습니다. 이 인디케이터는 시장 구조를 분석하고 중요한 주문 블록을 식별하고 다양한 패턴을 인식하는 데 뛰어납니다. 
현재 20% 할인 ! 초보자 또는 전문가 트레이더를 위한 최고의 솔루션! 이 대시보드 소프트웨어는 28개의 통화 쌍에서 작동합니다. 2가지 주요 지표(Advanced Currency Strength 28 및 Advanced Currency Impulse)를 기반으로 합니다. 전체 Forex 시장에 대한 훌륭한 개요를 제공합니다. 고급 통화 강도 값, 통화 이동 속도 및 모든(9) 시간대의 28 Forex 쌍에 대한 신호를 보여줍니다. 추세 및/또는 스캘핑 기회를 정확히 파악하기 위해 차트의 단일 지표를 사용하여 전체 시장을 볼 수 있을 때 거래가 어떻게 개선될지 상상해 보십시오! 잠재적인 거래를 식별하고 확인하면서 강력한 통화와 약한 통화를 더욱 쉽게 식별할 수 있도록 이 지표에 기능을 내장했습니다. 이 표시기는 통화의 강세 또는 약세가 증가 또는 감소하는지 여부와 모든 시간대에서 수행되는 방식을 그래픽으로 보여줍니다. 추가된 새로운 기능은 현재 시장 조건 변화에 적
Scalper Inside PRO
Alexey Minkov
4.75 (55)
SALE NOW! Limited Time Offer! An exclusive indicator that utilizes an innovative algorithm to swiftly and accurately determine the market trend. The indicator automatically calculates opening, closing, and profit levels, providing detailed trading statistics. With these features, you can choose the most appropriate trading instrument for the current market conditions. Additionally, you can easily integrate your own arrow indicators into Scalper Inside Pro to quickly evaluate their statistics and
맞춤형 MT4 지표로 성공적인 외환 거래에 대한 비밀을 발견하십시오! 외환 시장에서 성공을 달성하고 위험을 최소화하면서 일관되게 이익을 얻는 방법을 궁금해 한 적이 있습니까? 여기에 당신이 찾고 있던 답이 있습니다! 거래에 대한 귀하의 접근 방식을 혁신 할 독점적 MT4 지표를 소개 할 수 있습니다. 독특한 다양성 우리의 지표는 Renko 및 Rangebar Candle Formations를 선호하는 사용자를 위해 특별히 설계되었습니다. 우리는 이러한 차트 유형이 많은 숙련 된 거래자들이 선호한다는 것을 이해하기 때문에 우리의 지표가 그들과 완벽하게 통합되어 비교할 수없는 시장 분석을 제공합니다. 명확한 추세 신호 복잡한 분석을 잊어 버리십시오! 우리의 지표는 생생한 색상과 명확한 점 구조를 사용하여 시장 동향을 명확하게 나타냅니다. 빨간색과 파란색 점은 가격 이동 방향에 대해 의심의 여지가 없어 거래에서 빠른 의사 결정을 할 수 있습니다. HH/HL HL/LL
FX Power MT4 NG
Daniel Stein
5 (8)
모닝 브리핑 여기 mql5 와 텔레그램에서 FX Power MT4 NG 는 오랫동안 인기 있는 통화 강도 측정기인 FX Power의 차세대 버전입니다. 이 차세대 강도 측정기는 무엇을 제공합니까? 기존 FX Power에서 좋아했던 모든 것 PLUS GOLD/XAU 강도 분석 더욱 정밀한 계산 결과 개별 구성 가능한 분석 기간 더 나은 성능을 위한 사용자 정의 가능한 계산 한도 특별 멀티더 많은 것을보고 싶은 사람들을위한 특별한 다중 인스턴스 설정 모든 차트에서 좋아하는 색상을위한 끝없는 그래픽 설정 수많은 알림 옵션, 중요한 것을 다시는 놓치지 않도록 Windows 11 및 macOS 스타일의 둥근 모서리가 있는 새로운 디자인 마법처럼 움직이는 인디케이터 패널 FX 파워 키 특징 모든 주요 통화의 완전한 강세 이력 모든 시간대에 걸친 통화 강세 이력 모든 브로커 및 차트에서 고유 계산 결과 100% 신뢰할 수있는 실시간100 % 신뢰할 수있는 실시간 계산-> 다시 칠하지 않음
Quantum Trend Sniper Indicator MT4
Bogdan Ion Puscasu
4.59 (39)
소개       Quantum Trend Sniper Indicator는   추세 반전을 식별하고 거래하는 방식을 변화시키는 획기적인 MQL5 지표입니다! 13년 이상의 거래 경험을 가진 숙련된 트레이더 팀이 개발한       Quantum Trend Sniper 표시기       매우 높은 정확도로 추세 반전을 식별하는 혁신적인 방법으로 거래 여정을 새로운 차원으로 끌어올리도록 설계되었습니다. ***Quantum Trend Sniper Indicator를 구입하면 Quantum Breakout Indicator를 무료로 받을 수 있습니다!*** Quantum Trend Sniper Indicator는 추세 반전을 식별하고 세 가지 이익실현 수준을 제안할 때 경고, 신호 화살표를 제공합니다. 초보자 거래자와 전문 거래자 모두에게 적합합니다. Quantum EA 채널:       여기를 클릭하세요 MT5 버전:       여기를 클릭하세요
Break and Retest
Mohamed Hassan
5 (4)
Break & Retest is unstoppable when combined with our other divergence indicator. After purchase, send us a message and you could get this  2nd indicator  for  FREE  as a  BONUS! ‍You can visually backtest Break & Retest to see how it behaved in the past!    Manual guide:   Click here $59  for the first 25 copies ( 1  left)! Next price is $120 .  This Indicator only places quality trades when the market is really in your favor with a clear break and retest. Patience is key
Currency Strength Wizard
Oleg Rodin
4.91 (44)
통화 강도 마법사는 성공적인 거래를 위한 올인원 솔루션을 제공하는 매우 강력한 지표입니다. 표시기는 여러 시간 프레임의 모든 통화 데이터를 사용하여 이 또는 해당 외환 쌍의 힘을 계산합니다. 이 데이터는 특정 통화의 힘을 확인하는 데 사용할 수 있는 사용하기 쉬운 통화 지수 및 통화 전력선의 형태로 표시됩니다. 필요한 것은 거래하려는 차트에 표시기를 부착하는 것뿐입니다. 표시기는 거래하는 통화의 실제 강세를 보여줍니다. 지표는 또한 추세와 거래할 때 유리하게 사용할 수 있는 구매 및 판매 거래량 압력의 극한값을 보여줍니다. 지표는 또한 피보나치에 기반한 가능한 대상을 보여줍니다. 표시기는 PUSH 알림을 포함한 모든 유형의 알림을 제공합니다. 구매 후 연락주세요. 나는 당신과 거래 팁을 공유하고 당신에게 무료로 훌륭한 보너스 지표를 줄 것입니다! 나는 당신에게 행복하고 유익한 거래를 기원합니다!
FX Volume
Daniel Stein
4.6 (35)
모닝 브리핑을 통해 세부 정보와 스크린샷으로 매일 시장 업데이트를 받으세요 여기 mql5 및 텔레그램에서 FX 거래량은 브로커의 관점에서 시장 심리에 대한 실제 통찰력을 제공하는 최초이자 유일한 거래량 지표입니다. 브로커와 같은 기관 시장 참여자가 외환 시장에서 어떤 포지션을 취하고 있는지에 대한 훌륭한 통찰력을 COT 보고서보다 훨씬 빠르게 제공합니다. 차트에서 이 정보를 직접 확인하는 것은 트레이딩의 진정한 판도를 바꾸고 획기적인 솔루션입니다. 다음과 같은 고유한 시장 데이터 인사이트의 이점 비율 는 통화의 매수/매도 포지션 비율을 백분율로 표시 비율 변화 는 선택한 기간 내 매수 비율과 비율 변화를 표시 총 거래량 는 해당 통화의 총 거래량(롱 및 숏)을 로트 단위로 보여줍니다 Volumes Long 는 해당 통화의 모든 롱 포지션의 거래량을 보여줍니다 Volumes Short 는 해당 통화의 모든 숏 포지션의 거래량을 보여줍니다 Net Long 는 순 롱 포지션의 거래량
Quantum Breakout Indicator PRO
Bogdan Ion Puscasu
4.96 (26)
소개       Quantum Breakout PRO   , 브레이크아웃 존 거래 방식을 변화시키는 획기적인 MQL5 지표! 13년 이상의 거래 경험을 가진 숙련된 트레이더 팀이 개발한   Quantum Breakout PRO는   혁신적이고 역동적인 브레이크아웃 영역 전략으로 거래 여정을 새로운 차원으로 끌어올리도록 설계되었습니다. Quantum Breakout Indicator는 5개의 이익 목표 영역이 있는 브레이크아웃 영역의 신호 화살표와 브레이크아웃 상자를 기반으로 한 손절 제안을 제공합니다. 초보자 거래자와 전문 거래자 모두에게 적합합니다. Quantum EA 채널:       여기를 클릭하세요 MT5 버전 :   여기를 클릭하세요 중요한! 구매 후 설치 매뉴얼을 받으려면 개인 메시지를 보내주십시오. 추천: 기간: M15 통화쌍: GBPJPY, EURJPY, USDJPY,NZDUSD, XAUUSD 계정 유형: 스프레드가 매우 낮은 ECN, Ra
기적적인 외환 지표 소개: 정확한 트레이딩의 힘을 발휘하세요 모든 시간대에서 뛰어난 결과를 제공하는 최고의 외환 지표를 찾는데 지친 적이 있나요? 더 이상 찾을 필요가 없습니다! 기적적인 외환 지표가 도래하여 귀하의 트레이딩 경험을 혁신하고 수익을 새로운 고도로 끌어올립니다. 최첨단 기술과 수년간의 정성스런 개발을 토대로 기적적인 외환 지표는 외환 시장에서의 힘과 정확성의 정점으로 떠오릅니다. 이 탁월한 도구는 모든 수준의 트레이더의 요구를 충족시키고 지속적인 수익을 추구하는 데에서 비길 데 없는 우위를 제공하기 위해 설계되었습니다. 기적적인 외환 지표의 가장 큰 장점은 그 뛰어난 적응성에 있습니다. 당신이 데이 트레이더, 스윙 트레이더이든 장기 포지션을 선호하든, 이 지표는 모든 시간대에서 뛰어난 결과를 제공하기 위해 최적화되었습니다. 그러나 그 정확성과 시장의 복잡한 움직임을 포착하는 능력이 참으로 빛을 발하는 것은 1시간 기간대에서 사용할 때입니다. 기적적인 외환 지표의 정확성
Advanced Supply Demand
Bernhard Schweigert
4.92 (310)
현재 33% 할인! 초보자나 전문 트레이더를 위한 최고의 솔루션! 이 보조지표는 우리가 다수의 독창적 기능과 새로운 공식을 통합한 독특하고 고품질이며 저렴한 거래 도구입니다. 이 업데이트를 통해 이중 시간대를 표시할 수 있습니다. 더 높은 TF를 표시할 수 있을 뿐만 아니라 차트 TF와 더 높은 TF 모두를 표시할 수 있습니다: 중첩 영역 표시. 모든 Supply Demand 트레이더들이 좋아할 것입니다. :) 중요한 정보 공개 Advanced Supply Demand의 잠재력을 극대화하려면 다음을 방문하십시오. https://www.mql5.com/ko/blogs/post/720245   진입 또는 목표의 명확한 트리거 포인트를 정확히 찾아냄으로 해서 거래가 어떻게 개선될지 상상해 보십시오. 새로운 알고리즘을 기반으로 매수자와 매도자 간의 잠재적인 불균형을 훨씬 더 쉽게 분간할 수 있습니다. 왜냐하면 가장 강한 공급영역과 가장 강한 수요 영역과 과거에 어떻게 진행 되었는지를(이
Price Action Entry Alerts
Stephen Sanjeeve Sahayam
5 (3)
이 지표는 매수 또는 매도 압력에 대한 모든 막대를 선별하고 볼륨이 가장 높은 4가지 유형의 캔들 패턴을 식별합니다. 이 양초는 여러 선형 필터를 사용하여 필터링되어 매수 또는 매도 신호를 표시합니다. 신호는 더 높은 시간 프레임 방향과 함께 거래량이 많은 시간에 거래될 때 가장 잘 작동합니다. 모든 필터는 사용자 정의가 가능하며 독립적으로 작동합니다. 버튼 클릭으로 단일 방향의 신호를 볼 수 있습니다. 또한 이 지표에는 의사 결정 과정을 지원할 수 있는 가장 중요한 가격 조치 및 스마트 머니 개념이 포함되어 있습니다. 하나의 도구에서 신호 및 거래 교육을 모두 제공합니다. 특징: 신호는 다시 칠하지 않습니다. Engulfing candles, Rejection candles, Expanded range candles 및 Pinbars를 식별합니다. 각 유효한 신호에 대해 여러 항목, 손절매 및 여러 이익 실현 수준을 표시합니다. 대량 세션으로 필터링합니다. 지원/저항 수준 및
TrendDecoder Premium
Christophe, Pa Trouillas
5 (3)
범위 및 다음 가능한 움직임 식별   |  추세의 초기 신호와 강도를 확인하세요   |  반전 전 명확한 출구 확보   |  가격이 테스트 할 피보 레벨 파악 비추적, 비지연 지표 - 수동 및 자동 거래에 이상적 - 모든 자산 및 모든 시간 단위에 적합 기간 한정 혜택 >>   50% 할인 구매 후 이 채널로 문의 하여 권장 설정을 확인하세요. MT5   버전:   여기를 클릭하세요 BladeSCALPER   및   PowerZONES   로 전체 방법을 확인하세요. 어떤 서비스인가요? 트렌드디코더는 추세 모니터링을 간단하고 쉽게 하기 위한 여러 혁신 기술의 집약체입니다. 투영 추세선(투영 추세선) - 다가오는 추세의 속도 기준 실시간 추세선과 투영 추세선 비교 - 시장이 이전과 같은 방향으로 움직이고 있는지, 아니면 둔화되고 있는지? 실시간 추세선 교차 - 추세가 궤도를 이탈하고 있습니다. 그레이박스 - 시장이 더 이상 추세가 아니며 새로운 전환기에 들어섰습
TrendMaestro
Stefano Frisetti
5 (2)
note: this indicator is for METATRADER4, if you want the version for METATRADER5 this is the link: TRENDMAESTRO recognizes a new TREND in the bud, he never makes mistakes. The certainty of identifying a new TREND is priceless. DESCRIPTION TRENDMAESTRO identifies a new TREND in the bud, this indicator examines the volatility, volumes and momentum to identify the moment in which there is an explosion of one or more of these data and therefore the moment in which prices have strong probability of f
Advanced Currency IMPULSE with ALERT
Bernhard Schweigert
4.91 (494)
현재 31% 할인!! 초보자 또는 전문가 트레이더를 위한 최고의 솔루션! 이 지표는 우리가 독점 기능과 비밀 공식을 통합했기 때문에 독특하고 고품질이며 저렴한 거래 도구입니다. 단 하나의 차트로 28개 통화 쌍 모두에 대한 경고를 제공합니다. 새로운 추세 또는 스캘핑 기회의 정확한 트리거 포인트를 정확히 찾아낼 수 있기 때문에 거래가 어떻게 개선될지 상상해 보십시오! 새로운 기본 알고리즘을 기반으로 구축되어 잠재적인 거래를 훨씬 더 쉽게 식별하고 확인할 수 있습니다. 이는 통화의 강세 또는 약세가 가속되는지 여부를 그래픽으로 표시하고 가속 속도를 측정하기 때문입니다. 자동차의 속도계처럼 생각하면 됩니다. 가속화할 때 Forex 시장에서 동일한 일이 분명히 더 빠르게 발생합니다. 즉, 반대 방향으로 가속화되는 통화를 페어링하면 잠재적으로 수익성 있는 거래를 식별한 것입니다. 통화 모멘텀의 수직선과 화살표가 거래를 안내합니다! 역동적인 Market Fibonacci 23
Entry Points Pro
Yury Orlov
4.7 (225)
다시 색을 칠하지 않고 거래에 진입할 수 있는 정확한 신호를 제공하는 MT4용 지표입니다. 외환, 암호화폐, 금속, 주식, 지수 등 모든 금융 자산에 적용할 수 있습니다. 매우 정확한 추정값을 제공하고 매수와 매도의 가장 좋은 시점을 알려줍니다. 하나의 시그널로 수익을 내는 지표의 예와 함께 비디오 (6:22)시청하십시오! 대부분의 거래자는 Entry Points Pro 지표의 도움으로 첫 거래 주 동안 트레이딩 결과를 개선합니다. 저희의   Telegram Group 을 구독하세요! Entry Points Pro 지표의 좋은점. 재도색이 없는 진입 신호 신호가 나타나고 확인되면(시그널 캔들이 완성된 경우) 신호는 더 이상 사라지지 않습니다. 여타 보조지표의 경우 신호를 표시한 다음 제거되기 때문에 큰 재정적 손실로 이어집니다. 오류 없는 거래 게시 알고리즘을 통해 트레이드(진입 또는 청산)를 할 이상적인 순간을 찾을 수 있으며, 이를 통해 이를 사용하는 모든 거래자의
Indicator : RealValueIndicator Description : RealValueIndicator is a powerful tool designed specifically for trading on the EURUSD pair. This indicator analyzes all EUR and USD pairs, calculates their real currency strength values, and displays them as a single realistic value to give you a head start on price. This indicator will tell you moves before they happen if you use it right. RealValueIndicator allows you to get a quick and accurate overview of the EURUSD currency pair tops and bottoms,
EasyTrade Indicator
Gabor Bocsak
5 (5)
다중 통화 및 다중 시간대 매수 및 매도 알림. 자동 추적 중지 및 위험 보상 이익 실현! 지표는 시장을 스캔하고 분석하므로 귀하가 할 일이 없습니다! 하나의 차트에서 모든 통화를 거래하세요!   구매 후 댓글 남겨주시면 연락드리겠습니다. 무역도우미 EA를 보내드리겠습니다. 표시기는 여러 오실레이터와 부착된 필터를 사용하여 최상의 확인 진입점을 찾으므로 걱정할 필요가 없습니다! 이는 귀하에게 경고하고 귀하가 시청하기로 선택한 모든 기간과 통화에 대한 버튼을 그립니다. 버튼을 누르면 차트로 이동하여 거래를 시작할 수 있습니다! 이 표시기는 또한 모든 기본 및 시장 감시 통화에 대한 강도 패널을 그립니다(설정에서 조정 가능). 그러면 모든 통화 쌍과 선택한 더 높은 기간의 통화가 표시됩니다. 표시기 창에는 추세 필터가 포함된 특수 MACD 히스토그램과 차트 통화에 대한 다중 기간 추세 패널이 있습니다! 모든 통화와 시간대에 대한 거래 알림을 제공하며 버튼을 누르면
How to use Pair Trading Station Pair Trading Station is recommended for H1 time frame and you can use it for any currency pairs. To generate buy and sell signal, follow few steps below to apply Pair Trading Station to your MetaTrader terminal. When you load Pair Trading Station on your chart, Pair Trading station will assess available historical data in your MetaTrader platforms for each currency pair. On your chart, the amount of historical data available will be displayed for each currency pai
PRO Renko System
Oleg Rodin
5 (24)
PRO Renko System 은 RENKO 차트 거래를 위해 특별히 고안된 매우 정확한 거래 시스템입니다. 이것은 다양한 거래 상품에 적용될 수있는 보편적 인 시스템입니다. 체계는 효과적으로 당신에게 정확한 반전 신호에 접근을 주는 소위 시장 소음을 중화합니다. 이 표시기는 사용하기가 매우 쉽고 신호 생성을 담당하는 매개 변수가 하나만 있습니다. 당신은 쉽게 당신의 선택의 어떤 무역 계기에 공구를 적응시킬 수 있고 renko 막대기의 크기. 나는 항상 당신이 내 소프트웨어로 수익성있게 거래 할 수 있도록 추가 지원을 제공 할 준비가되어 있습니다! 나는 당신에게 행복하고 수익성있는 거래를 기원합니다! 구매 후 저에게 연락하십시오! 내 렌코 차트 생성기를 보내드립니다. 또한 내 개인 권장 사항 및 시스템의 다른 모듈을 무료로 공유 할 것입니다!
우선적으로 이 거래 시스템은 다시 그리지 않고, 다시 그리지 않으며, 지연되지 않는 것을 강조할 가치가 있습니다. 이는 전문적인 거래에 이상적입니다. "스마트 서포트 앤 레지스턴스 트레이딩 시스템"은 새로운 및 경험 많은 트레이더를 위해 개발된 고급 지표입니다. 이 시스템은 외환 시장에서 정밀도와 신뢰감을 제공합니다. 이 포괄적인 시스템은 일일 거래 전략, 스윙 거래 전략, 지원 및 저항 전략, 캔들스틱 패턴 전략, VWAP 전략, 다중 시간대 추세 전략 등을 포함한 7개 이상의 전략, 10개의 지표 및 다양한 거래 방식을 결합합니다. 이 시스템은 화살표 신호, 진입 및 출구 지점, 거래 경보, 높은 시간대 추세 분석, 실시간 거래 모니터링 및 트렌드 및 볼륨 캔들 색상 제공합니다. 자동 지원 및 저항 감지로 다양한 시장 상황에서 신중한 결정을 돕는 다면적 인 지표입니다. 스마트 서포트 앤 레지스턴스 트레이딩 시스템은 프리미엄 및 강력한 지표 및 도구 모음을 통합한 견고한
AW Trend Predictor
AW Trading Software Limited
4.74 (39)
하나의 시스템에서 추세와 고장 수준의 조합입니다. 고급 지표 알고리즘은 시장 노이즈를 필터링하고 추세, 진입점 및 가능한 출구 수준을 결정합니다. 표시기 신호는 통계 모듈에 기록되어 가장 적합한 도구를 선택하여 신호 기록의 효율성을 보여줍니다. 이 표시기는 이익 실현 및 손절매 표시를 계산합니다. 매뉴얼 및 설명 ->   여기   / MT5 버전 ->   여기 지표로 거래하는 방법: Trend Predictor로 거래하는 것은 3단계로 간단합니다. 1단계 - 포지션 열기 70% 이상의 성공률로 매수 신호를 받았습니다. 2단계 - StopLoss 결정 반대 신호로 트렁크 선택 3단계 - 이익 실현 전략 정의 전략 1: TP1 도달 시 전체 포지션 청산 전략 2: TP1 도달 시 포지션의 50% 청산 및 TP2 도달 시 나머지 50% 청산 전략 3: 추세 반전 시 전체 포지션 청산 이익: 결과를 다시 그리지 않음, 신호는 엄격하게 양초가 닫힐 때 어드바이저에서 사용할 수 있습니다. 이
PTS Precision Index Oscillator V2
PrecisionTradingSystems
5 (1)
프리시전 트레이딩 시스템의 로저 메드칼프에 의한 프리시전 인덱스 오실레이터 (Pi-Osc) 버전 2는 차트에 신속하게 로드되도록 주의 깊게 다시 코딩되었으며 경험을 향상시키기 위해 몇 가지 다른 기술적 개선 사항이 통합되었습니다. Pi-Osc는 정확한 거래 타이밍 신호를 제공하도록 개발되었으며 시장이 모든 사람의 스톱을 청산하기 위해 가야 하는 극도의 고갈 지점을 찾는 데 목적이 있습니다. 이 제품은 극단적인 지점이 어디에 있는지 알고 있는 고전적인 문제를 해결하며 트레이더로서의 삶을 훨씬 간단하게 만듭니다. 이것은 업계 표준 오실레이터와는 상당히 다른 강력한 차이점을 가지고 있는 고도로 복잡한 합의 지표입니다. 사용하는 기능 중 일부는 수요 지수, 자금 흐름, RSI, 스토캐스틱, 패턴 인식, 거래량 분석, 표준 편차 극단점 및 다양한 길이에서 위와 유사한 변형을 갖습니다. 미숙한 눈에는 다른 오실레이터와 비슷해 보일 수 있지만 RSI 또는 모멘텀과 같은 다
제작자의 제품 더 보기
EMA Alert
Santi Dankamjad
5 (6)
Indicator overview   Trend indicator usage Moving averages. Highest quality alerts that need no introduction. It is completely loyal to the original algorithm and uses other useful features. Easy to trade Carry out all kinds of notifications It's not a new paint and it's not a back paint. Setting Indicator EMA50 in Time frame H1 for any pair currency and Gold Spot. EMA200 in Time frame H1 for any pair currency and more than EMA250 for Gold spot. Using it for maximum benefit Set up notificatio
FREE
RSI MA Alert
Santi Dankamjad
Indicator MT4 : RSI MA is Moving average of strength index Objective : Find entry price for the good trade How to set up indicators RSI MA : 1. RSI period 14. 2. MA you can set calculate price and method price. 3. MA period 9. 4. Arrow setting : 6 types. 5. Alert setting : Next bar or Instant bar. 6. Choose display for 1 or 2 calculation by formula. How to trade for success : Entry point : Buy / Long position 1. When arrow up direction show 2. TP : RSI OVB Entry point : Sell / Short posi
Madx Cobra MT5
Santi Dankamjad
Madx Cobra   Madx Cobra Indicator. Create to traders both experienced and inexperienced to use it because it is a basic indicator How to use : Setting Indicator 1. MA Fast  : Moving Average fast (10) 2. MA Slow :  Moving Average Slow control trend markets.(200) 3. ADX : Control trend(5) 4. For alert you can set to alert Next bar or instant bars.  When arrow sky blue show or arrow up, you can entry order "Buy" or "Long" and arrow red show or arrow down, you can entry order "Sell" or "Short"
SMA Alert
Santi Dankamjad
Indicator overview   Trend indicator usage Moving averages. Highest quality alerts that need no introduction. It is completely loyal to the original algorithm and uses other useful features. Easy to trade Carry out all kinds of notifications It's not a new paint and it's not a back paint. Setting Indicator SMA50 in Time frame H1 for any pair currency and Gold Spot. EMA200 in Time frame H1 for any pair currency and more than EMA250 for Gold spot. Using it for maximum benefit Set up notificatio
FREE
SSMA Alert
Santi Dankamjad
Indicator overview   Trend indicator usage Moving averages. Highest quality alerts that need no introduction. It is completely loyal to the original algorithm and uses other useful features. Easy to trade Carry out all kinds of notifications It's not a new paint and it's not a back paint. Setting Indicator SSMA50 in Time frame H1 for any pair currency and Gold Spot. EMA200 in Time frame H1 for any pair currency and more than EMA250 for Gold spot. Using it for maximum benefit Set up notificati
FREE
WMA Alert
Santi Dankamjad
Indicator overview   Trend indicator usage Moving averages. Highest quality alerts that need no introduction. It is completely loyal to the original algorithm and uses other useful features. Easy to trade Carry out all kinds of notifications It's not a new paint and it's not a back paint. Setting Indicator WMA50 in Time frame H1 for any pair currency and Gold Spot. EMA200 in Time frame H1 for any pair currency and more than EMA250 for Gold spot. Using it for maximum benefit Set up notificatio
FREE
OBTE = Order Block Type I OBTI Indicator MT4 is the most accurate and customizable indicator on the market. It was developed to facilitate the analysis of operations based on candlestick patterns and supply-demand zones. These zones are possible movement reversal points. For this indicator is generated by the order block of smart money concept. Input parameters: 1. Multiple timeframes : M1 M5 M15 M30 H1 H4 D1 W1 MN1 2. Default input: H1 H4 D1 W1 MN1 3. Notifications / Send Emails / Notificatio
RSI Color and Notification
Santi Dankamjad
1 (1)
RSI Color and Notification Setting Usages :: 1. Set value Oversold and Overbought 2. Set period RSI 3. Set Color 4. Notify to Alert, Email and Mobile. For Trading :: Forex and Binary option 1. When the color alarm occurs in the OVB area, do the preparation. To enter a Sell order 2. When the color alarm occurs in the OVS area, do the preparation. To enter a Buy order 3. When RSI is between OVB and OVS, consider another indicator to trade.
FREE
There are 8 types of this indicator. Consisted of 1. Bullish and Bearish Engulfing 2. Morning and Evening Star 3. Three Green Soldiers and Three Red Crows 4. Three Inside Up and Down 5. Three Outside Up and Down 6. Bullish and Bearish Harami 7. Tweezers Top and Bottom 8. Piercing and Dark cloud cover Signal Filter :: 1. The appearance of the candle stick 2. SMA 3. 2EMA :: EMA Fast and EMA Slow 4. RSI N otification :: 1. Via screen 2. Email 2. Phone For trading 1. Scaling 2. Binary options
This indicator is an upgrade of traditional MACD on MT4. Macd Base line cross above Macd signal line the color of histogram change is red color and entry order Sell. Macd Base line cross below Macd signal line the color of histogram change is green color and entry order Buy. For above histogram of Macd can change color to good looking by can change color above zero line and lower line.
Trading is a trade war. So a trader is a warrior. A warrior needs to be armed with a weapon This Binary Star Wars Pro  is your workout routine. That can accelerate the results precisely Who deserves this kind of precision weapon? 1. People who want to profit. From binary options trading 2. Those who want to trade short, profit fast 3. People who want long-term Can be done 4. Newbie can use it. 5. Old hands can be used very well. How it works It works very easy. For binary options Time fra
For this set of indicators 1. General information     - Calculates with high performance mathematical algorithms.     - Calculated from the price of candles     - The entry point of this order is filtered by the train EMA and the oscillator.     - Calculate the integrity of the candle 2. How does it work?     - You can see two types of order entry points: the notification on the monitor and the arrow.     - You can trust 75-95 percent of this entry point. 3. Settings     - A complete candle
For this set of indicators 1. General information     - Calculates with high performance mathematical algorithms.     - Calculated from the price of candles     - The entry point of this order is filtered by the train EMA and the oscillator.     - Calculate the integrity of the candle 2. How does it work?     - You can see two types of order entry points: the notification on the monitor and the arrow.     - You can trust 75-95 percent of this entry point. 3. Settings     - Retracement is re
For this set of indicators 1. General information     - Calculates with high performance mathematical algorithms.     - Calculated from the price of candles     - The entry point of this order is filtered by the train EMA and the oscillator.     - Calculate the integrity of the candle 2. How does it work?     - You can see two types of order entry points: the notification on the monitor and the arrow.     - You can trust 75-95 percent of this entry point. 3. Settings     - A complete candle
Harami 4Umbrella
Santi Dankamjad
For this set of indicators 1. General information     - Calculates with high performance mathematical algorithms.     - Calculated from the price of candles     - The entry point of this order is filtered by the train EMA and the oscillator.     - Calculate the integrity of the candle 2. How does it work?     - You can see two types of order entry points: the notification on the monitor and the arrow.     - You can trust 75-95 percent of this entry point. 3. Settings     - A complete candle
Binary Galaxy A1
Santi Dankamjad
Trading is a trade war So traders are warriors. A warrior needs a weapon. The Binary Galaxy A1 is a powerful weapon. Extremely accurate This tool can be customized as you like. Who deserves such an accurate weapon? 1. People who want profits From binary options trading 2. Those who want to trade short, profit fast 3. People who want long-term can do it. 4. Beginners can use it. 5. Old hand works very well. How it works It works very easy. For binary options Time frame M1 or M5 and expires
Trading is a trade war So traders are warriors. A warrior needs a weapon. The Scalping One Plus A1 is a powerful weapon. Extremely accurate This tool can be customized as you like. Who deserves such an accurate weapon? 1. People who want profits From binary options trading 2. Those who want to trade short, profit fast 3. People who want long-term can do it. 4. Beginners can use it. 5. Old hand works very well. How it works It works very easy. For binary options Time frame M1 or M5 and exp
We know for sure that The Fibonacci sequence is a science used to calculate or estimate target distances. How does this indicator work? 1. Tell the spread status 2. Tell me the current price 3. Indicate whether the candlestick status is bullish or bearish on each time frame. 4. Indicates the status of the past 2 candles 5. Tell Pivot Point 6. Tell the Fibonacci sequence. 7.The Fibonacci measurement can be set. 8. Pivot can be set backward. 9. Look at support and resistance. Suitable for 1.
Binary MA Cross
Santi Dankamjad
MA Cross indicator by 4Umbella Create for traders both experienced and inexperienced to use it because it is a basic indicator How to use : 1. MA Fast  : Moving Average fast (Period 4 upto 50) 2. MA Middle :  Moving Average Middle (Period 10 upto 100) 3. MA Slow :  Moving Average Slow (Period 50 upto 200) to control trend markets. and trader can be set for Apply to price (Close, Open,Low,High,Median,Typical,weightd) For alert you can set to alert Next bar or instant bars.  The work is
Madx Cobra
Santi Dankamjad
Madx Cobra Indicator. Create to traders both experienced and inexperienced to use it because it is a basic indicator How to use : Setting Indicator 1. MA Fast  : Moving Average fast (10) 2. MA Slow :  Moving Average Slow control trend markets.(200) 3. ADX : Control trend(5) 4. For alert you can set to alert Next bar or instant bars.  When arrow sky blue show or arrow up, you can entry order "Buy" or "Long" and arrow red show or arrow down, you can entry order "Sell" or "Short" Setting s
Sto Extreme
Santi Dankamjad
Concept : Sto Extreme  Entry order point  is a set of Stochastic oscillator (5,3,3) (customizable). There are 4 types of entry points: 1. Main line  cross above/below Signal line : Main line Intersect Signal Line (2 lines intersect) 2. Main line line or Signal line cross out OVB/OVS : Main line /Signal Line (Optional) cross above OVB and cross below OVS 3. Main line line or Signal line cross in OVB/OVS : Main line /Signal Line (Optional) cross below OVB and cross above OVS 4. Main line line or S
For This Indicator 'WL Percent R' This indicator is an upgrade of traditional Williams %R on MT4. 1. Up trend : indicator is above -50 and strong trend is above -20. 2. Down trend : indicator is below -50 and strong trend is below -80. How to use... 1. You can be customize color and level of indicator. 2. You can be customize alert and define alert on next bar or instant bar. Williams Percent R (Williams %R)  credit : https://www.investopedia.com/terms/w/williamsr.asp Williams %R, also
OrderBlock
Santi Dankamjad
OB = Order Block When it comes to trading, an order block is a price level where multiple market participants either want to buy or sell. An order block may indicate that a price is likely to fluctuate. This is because there is a lot of pressure either from buyers or sellers, whether it rises or falls depends on where that pressure is coming from. Highlights   1. Order blocks in forex are price levels where institutions attempt to buy or sell a foreign exchange pair without potentially having
Fair value gap
Santi Dankamjad
Fair value gap (FVG) = Imbalance zone Fair value gap Indicator MT4 is the most accurate and customizable indicator on the market. It was developed to facilitate the analysis of operations based on candlestick patterns and supply-demand zones. These zones are possible movement reversal points. For this indicator is generated by the order block of smart money concept. High Time Frame (HTF) To Find High Quality Order Block Low Time Frame (LTF) To Find a secure Entry W1 D1, H4 D1 H4, H1, M30 H4
Indicator MT4 : UTBMA (Universal trend boundary moving average) Objective: To track price trends and price reversals. How to set up Indicator UTBMA : 1. The standard value is SMA 20 and SMA 50, you can set it as you like. 2. UTBx 14 is Universal Trend Boundary Index, standard value 14. 3. UTBx Method is a method for calculating the standard value is Exponential. Meaning of symbols in indicators : 1. The line of the green group means the trend is up. 2. The line of the red group represents
필터:
리뷰 없음
리뷰 답변