CandleFilter
- 지표
- Igor Gerasimov
- 버전: 1.1
- 업데이트됨: 12 4월 2023
- 활성화: 5
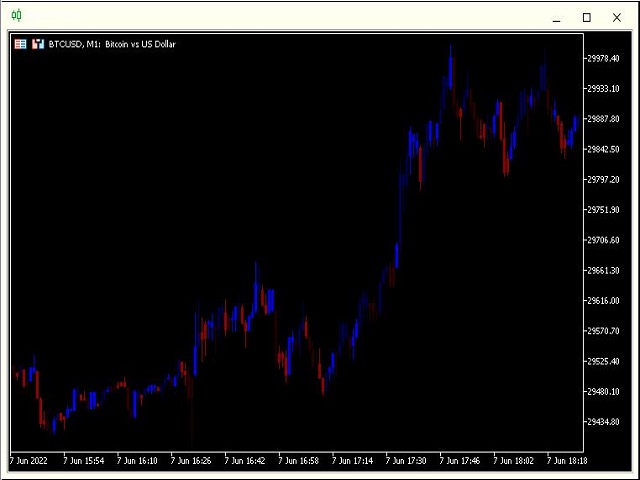
이 표시기는 필터링된 가격 정보를 표시합니다.
64가지 색상 범위를 사용하는 촛대 차트 형태.
가격 움직임 방향의 강도를 결정하는 데 완벽하게 유용합니다.
이 표시기는 설정이 없습니다.
64가지 색상 모두 이미 프로그램에 포함되어 있으며,
파란색이 밝을수록 구매하려는 움직임의 힘이 강해지며,
붉은색이 밝을수록 매도세력이 강해집니다.
/////////////////////////////////////////////////////
/////////////////////////////////////////////////////
이 지표가 성공적인 거래에 매우 유용하기를 바랍니다.
행운을 빕니다.
/////////////////////////////////////////////////////