• 미리보기
  • 리뷰
  • 코멘트

Support and Resistance Levels by svidoks

Support and Resistance Levels by svidoks

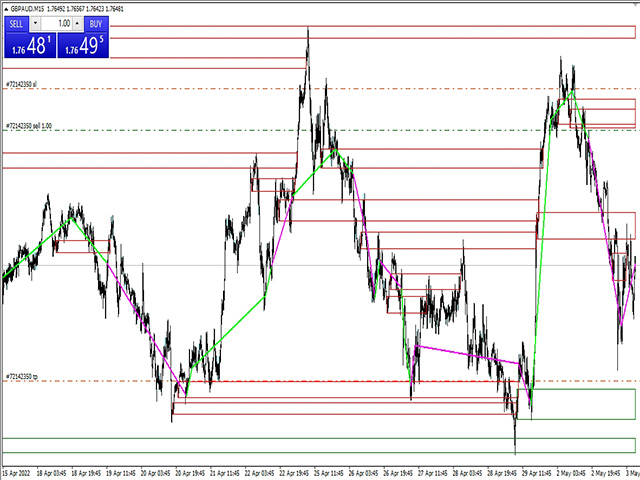
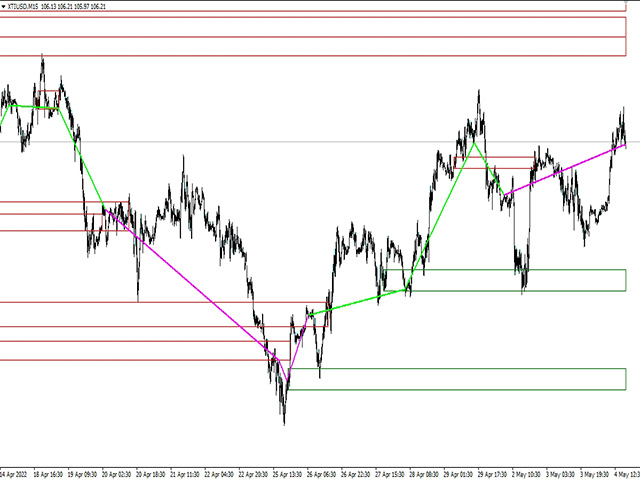
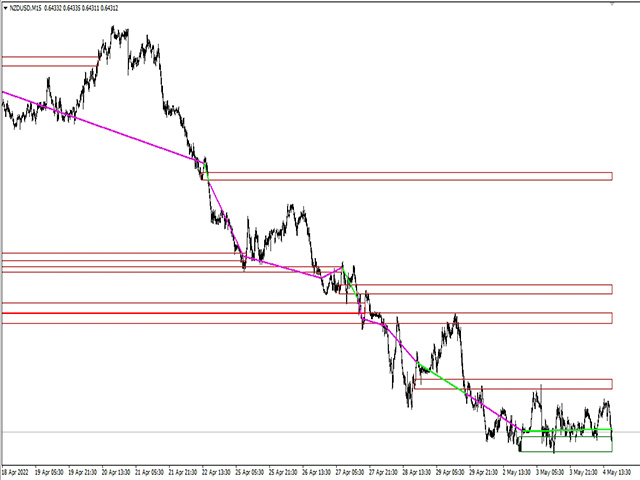
This utility draws support and resistance zones to which the price reacts well.
It also has a trend indicator that works on the basis of support and resistance zones.
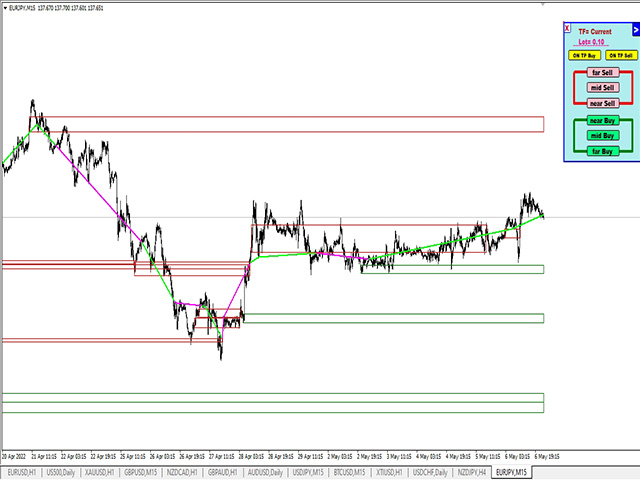
You can work with the indicator-advisor both manually and automatically (there is also an external control panel).
Group for support, you can also write your Wishlist and wishes - telegram chat
Supports all currency pairs

Options:
Dist_set_limit - 300, this is the value in pips. When the price approaches at this distance, a limit will be set to the zone
Dist_del_limit - 400, this is the value in pips. When the price moves at this distance from the zone, the limit will be removed
shift_trend_ind - parameter affecting the drawing of trend lines

One_Limit_Zone - set only one limit per zone
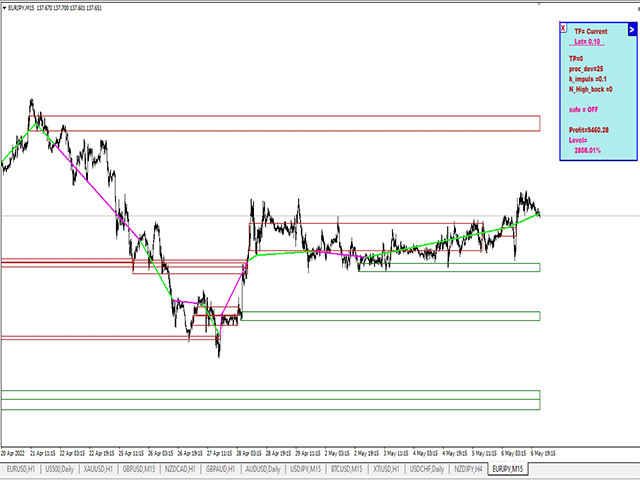
proc_deviation, koef_impuls, N_High_back, Z_bar_min - the default settings are optimal, you can certainly play around.
The drawing of the support and resistance zone depends on these parameters.

safe - safe
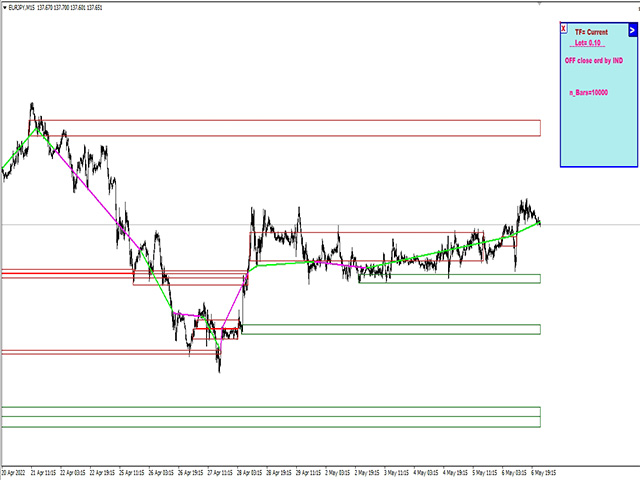
n_Bars - number of bars involved in drawing zones

On_TP_Buy - take profit when reaching the support level
On_TP_Sell - take profit when the resistance level is reached
ON_Close_zone - Close an order when the zone is closed?

ON_Close_ind - Close orders by indicator (trend line)

Key level order block indicator automatically draws order blocks on the chart for you

The key level order block does not re-paint

The key level order block works on all markets from stocks, indices to currency pairs aswell as crypto-currency.

support resistance automated

Advantages:

✅Work with all pairs (Forex, Crypto, indices and commodities)

✅We work with all timeframes. (Recommended timeframe: M15 and above)

✅Support and resistance levels are used to identify key levels at which the price trend is more likely to stop and possibly change direction.

✅ Low risk entries.

✅Can be used as an advisor.

✅Can determine supply demand zones.

✅Can place orders in zones.


추천 제품
FreqoMaster
Stanislav Korotky
The main idea of this indicator is rates analysis and prediction by Fourier transform. The indicator decomposes exchange rates into main harmonics and calculates their product in future. The indicator shows 2 price marks in history, depicting price range in the past, and 2 price marks in future with price movement forecast. Buy or sell decision and take profit size are displayed in a text label in the indicator window. The indicator uses another indicator as an engine for calculations - FreqoMet
This scanner is a tool used to support trading. Scanner searches on a wide market, in real time setups, created by mutual arrangements of candles (candles pattern). Its basic features are:  8 implemented trading setups (it is possible to add further setups, additional versions of the scanner),  the possibility of simultaneous scanning, all financial instruments available on the platform,  the possibility of simultaneous scanning, in all timeframes available on the platform,  the ability to manua
Daily Pivots Multi indicator for MT4
Renaud Herve Francois Candel
Daily Pivots Multi Indicator Daily Pivots Multi is an exclusive indicator to draw your pivots levels and much more. Most indicators draw daily pivots for the day. Daily Pivots Multi is able to draw levels for different days. The indicator can do the calculation for unlimited number of days backward. It means that you can draw the levels for today but also for the past days. This is very useful if you want to study a strategy with Pivots levels over a period of time. Another problem is th
Year2Year
Stanislav Korotky
This indicator shows price changes for the same days in past years. D1 timeframe is required. This is a predictor indicator that finds D1 bars for the same days in past 8 years and shows their relative price changes on the current chart. Parameters: LookForward - number of days (bars) to show "future" price changes; default is 5; Offset - number of days (bars) to shift back in history; default is 0; ShowAverage - mode switch; true - show mean value for all 8 years and deviation bounds; false - s
FREE
VR Cub
Vladimir Pastushak
VR Cub 은 고품질 진입점을 얻는 지표입니다. 이 지표는 수학적 계산을 용이하게 하고 포지션 진입점 검색을 단순화하기 위해 개발되었습니다. 지표가 작성된 거래 전략은 수년 동안 그 효율성을 입증해 왔습니다. 거래 전략의 단순성은 초보 거래자라도 성공적으로 거래할 수 있다는 큰 장점입니다. VR Cub은 포지션 개시 지점과 이익 실현 및 손절매 목표 수준을 계산하여 효율성과 사용 편의성을 크게 높입니다. 간단한 거래 규칙을 이해하려면 아래 전략을 사용한 거래 스크린샷을 살펴보세요. 설정, 세트 파일, 데모 버전, 지침, 문제 해결 등은 다음에서 얻을 수 있습니다. [블로그] 다음에서 리뷰를 읽거나 작성할 수 있습니다. [링크] 버전 [MetaTrader 5] 진입점 계산 규칙 포지션 개설 진입점을 계산하려면 VR Cub 도구를 마지막 최고점에서 마지막 최저점까지 늘려야 합니다. 첫 번째 지점이 두 번째 지점보다 빠른 경우, 거래자는 막대가 중간선 위에서 마감될 때까지 기다립
FFx Pivot SR Suite PRO
Eric Venturi-Bloxs
5 (2)
MetaTrader 5 version available here: https://www.mql5.com/en/market/product/25794 FFx Pivot SR Suite PRO is a complete suite for support and resistance levels. Support and Resistance are the most used levels in all kinds of trading. Can be used to find reversal trend, to set targets and stop, etc. The indicator is fully flexible directly from the chart 4 periods to choose for the calculation: 4Hours, Daily, Weekly and Monthly 4 formulas to choose for the calculation: Classic, Camarilla, Fibona
Pivot Pro
Igor Semyonov
Description Pivot Pro  is a universal color indicator of the  Pivot Points  levels systems. You can select one of its three versions:  Standard   Old , Standard New  and  Fibo . The system will automatically calculate the  Pivot Point  on the basis of market data for the previous day ( PERIOD_D1 ) and the system of support and resistance levels, three in each. It can also display price tags for each level. You can color the indicator lines. Only a method of calculation of the third level of supp
이 표시기는 시장 분석을 위한 가장 효과적인 도구 중 하나인 피보나치 지원 및 저항 수준을 자동으로 계산하고 표시합니다. 계산은 선택한 기간 및 기간 동안의 평균 가격 데이터를 사용합니다. 이 기간의 최소값과 최대값은 이동의 시작과 끝으로 간주됩니다. 피보나치 수준을 사용하면 가격 움직임이 느려지거나 역전될 수 있는 잠재적인 기준점을 볼 수 있습니다. 즉, 추가 움직임을 예측하고 정지 및 지정가 주문을 하는 데 사용됩니다. 매개변수: PartsShow - 현재 막대에서 표시된 과거 레벨의 수 CalcPeriod - 가격 평균화 기간 SmoothingMethod - 가격 평균화 방법(26개 옵션) TF - 계산에 사용되는 기간 LevelColor - 레벨 라인의 색상 ZeroLevelColor - 제로 레벨 색상 ShowVerticalLine - 레벨 사이의 수직선 표시 활성화/비활성화 VLineStyle - 수직선의 스타일 VLineColor - 수직선의 색상 ShowInfo - 레
Custom Pivots
Tsvetan Tsvetanov
4.2 (5)
Pivots Points are significant levels traders can use to determine directional movement, support and resistance. Pivot Points use the prior period's high, low and close to formulate future support and resistance. In this regard, Pivot Points are predictive and leading indicators. Pivot Points were originally used by floor traders to set key levels. Floor traders are the original day traders. They deal in a very fast moving environment with a short-term focus. At the beginning of the trading day,
Trade with Gann on your side!! MASTER CIRCLE 360 CIRCLE CHART, originally created by Gann admitted that this is “The Mother of all charts”. It is one of the last studies that this great trader left for us. The numeric tab le is apparently quite simple like all the tables and is based on square numbers, the SQUARE OF 12 and is by evolution, one of the most important square numbers. Here we can find CYCLE, PRICE AND TIME thanks to angles and grades, to show past and future support and resistance.
Owl smart levels
Sergey Ermolov
4.63 (54)
MT5 버전  |   FAQ Owl Smart Levels Indicator 는   Bill Williams 의 고급 프랙탈, 시장의 올바른 파동 구조를 구축하는 Valable ZigZag, 정확한 진입 수준을 표시하는 피보나치 수준과 같은 인기 있는 시장 분석 도구를 포함하는 하나의 지표 내에서 완전한 거래 시스템입니다. 시장과 이익을 취하는 장소로. 전략에 대한 자세한 설명 표시기 작업에 대한 지침 고문-거래 올빼미 도우미의 조수 개인 사용자 채팅 ->구입 후 나에게 쓰기,나는 개인 채팅에 당신을 추가하고 거기에 모든 보너스를 다운로드 할 수 있습니다 힘은 단순함에 있습니다! Owl Smart Levels   거래 시스템은 사용하기 매우 쉽기 때문에 전문가와 이제 막 시장을 연구하고 스스로 거래 전략을 선택하기 시작한 사람들 모두에게 적합합니다. 전략 및 지표에는 눈에 보이지 않는 비밀 공식 및 계산 방법이 없으며 모든 전략 지표는 공개되어 있습니다. Owl Smart Lev
COG LR Osc AM
Andriy Matviyevs'kyy
The presented indicator allows you to determine potential entry points into the market and set protective orders at reasonable levels. This product can be useful for both beginners and experienced traders. The indicator is based on calculation methods proven by time and practicing traders. The indicator is calculated in two stages: At the first stage, linear regression (LR) of the selected price type is determined for a given number of chart periods. At the second stage, the obtained data is p
5TT Pivot Lines is a visual display of pivot lines. These are primarily support and resistance points with the 'Blue' Pivot Point. Pivot points are useful for determining key levels for entry or exits (setting targets and stop loss levels). Having these support & resistance lines visually displayed on the chart is very useful for intraday traders. 5TT Pivot Lines come with some user-friendly settings to decide if to display the lines or connectors on the chart Settings CandlesBack: This gives th
Trendiness Index
Libertas LLC
5 (3)
"The trend is your friend" is one of the best known sayings in investing, because capturing large trendy price movements can be extremely profitable. However, trading with the trend is often easier said than done, because many indicators are based on price reversals not trends. These aren't very effective at identifying trendy periods, or predicting whether trends will continue. We developed the Trendiness Index to help address this problem by indicating the strength and direction of price trend
Magic Pivot
Evgeny Belyaev
Magic Pivot is a professional indicator for finding the support and resistance lines; it has been developed by a group of professional traders. The indicator plots three support lines and three resistance lines, where a price reversal is highly probable. Magic Pivot is an excellent tool for scalping and intraday trading.   Advantages High accuracy of signals. Suitable for scalping and intraday trading. The indicator does not redraw. Simple indicator setup, minimum parameters. Works on any finan
CityScape summarizes prices into an easy to read pattern that oscillates between 0 and 1. Repetition of CityScape pattern may indicate that the price pattern will also be repeated. CityScape pattern can be used as a quick reference to predict what the price may do by looking for a similar CityScape Pattern in the recent past. Cross currency pairs and cross timescale pattern comparisons may also provide insight into what the price will do. Inputs Local Max period: Controls the width of the City
Like you when I first started trading, It was overwhelming...learning about indicators, about lotsize, leverage and many more things. Its been almost 3 years. I am more knowledgeable in trading. My trading continues to improve as I work on my strategy, technical analysis, trading psychology and trade management. One thing I am not worried about though is being able to close my trades quicky if a trade goes against me or if the trade has reached my take profit level with the help of my Close Tr
Fibonacci retracements can be used to draw support lines, identify resistance levels, place stop-loss orders and set target prices. The Advanced Automatic Fibonacci retracements draws automatically all the levels. You have a lot of options to choose. For exemple you can use the tracements of another time frame (MTF) in the current chart, you can also choose between the closest level or less close to draw the retracements. You can also add 2 levels of your choice. You can add levels extensions o
Pivot System
Igor Semyonov
4 (1)
Description Pivot System  is a universal color multicurrency/multisymbol indicator of the  Pivot Points  levels systems. You can select one of its three versions:  Standard   Old ,  Standard New  and  Fibo . It plots pivot levels in a separate window. The system will automatically calculate the  Pivot Point  on the basis of market data for the previous day ( PERIOD_D1 ) and the system of support and resistance levels, three in each. It can also display price tags for each level. You can color t
In the stock market technical analysis, support and resistance is a concept that the movement of the price of a security will tend to stop and reverse at certain predetermined price levels. Support and resistance levels can be identified on any timeframe. However, the most significant ones are found on the higher time frames, such as daily, weekly, and monthly. This indicator using the weekly OHLC data to identify the relevant levels. This is a support and resistance indicator and providing majo
This indicator provides the technical overview using following tools: Pivot Points Technical Indicators Moving Averages Pivot Points are calculated using five different methods: Classic Fibonacci Camarilla Woodie DeMark With the technical indicator , you can find the trading signals using the combination of different indicators. It supports the following technical indicators: RSI Stochastic Stochastic RSI MACD ADX CCI ATR Ultimate Oscillator ROC Bull/Bear Power Moving Averages is used to find th
Lines Target ZFS
Vasiliy Smirnov
The main function of the indicator is to draw the target lines (support and resistance lines). The lines are plotted according to a special fractal algorithm. The lines are calculated with consideration of the zero bar. A different, more complicated calculation algorithm is used on the zero bar, in contrast to the other bars. This allows reacting to the market situation in real time, but on the other hand, redrawing is possible on the zero bar. If necessary, the zero bar can be omitted from calc
PZ Support Resistance
PZ TRADING SLU
3.33 (3)
Tired of plotting support and resistance lines? This is a multi-timeframe indicator that detects and plots supports and resistance lines in the chart with the same precision as a human eye would. As price levels are tested over time and its importance increases, the lines become thicker and darker, making price leves easy to glance and evaluate. [ Installation Guide | Update Guide | Troubleshooting | FAQ | All Products ] Boost your technical analysis Customizable timeframe selection Read pri
Update:ver1.53 (2023/08/16) ・概要と必要環境 手動発注もしくは他ツール等からの発注に対し、指値発注予約の複製を生成します。こちらは「発注操作の簡易化」に特化したものになります。発注判断となる分析は、資料を漁る、経験則を導く、他の分析ツールやEAを併用する等、利用者ご自身で頑張ってください。なお、ver1.28より、「決済後、自動で再発注する」機能が実装されました。(有償版でのみ有効化できます) ・導入と導入後の操作 導入そのものは簡単です。「自動売買可能なEA」として、適当なチャートにて動作させるだけです。(チャートの対象相場は問いません。このEAは、チャートを見ていません)。あとは、「このEAでのローカルコピー以外の発注」があれば、それに応じて「損失が出た場合に備えての追加取引の予約」という形で、指値発注が自動生成されます。 導入操作上の注意として、「本EAを、複数のチャートで動作」はできません。EAがチャート自体を見ておらず、注文状況だけを見ているため、複数のチャートで動かす意味もありません。また、ターミナルとEAの設定として「自動売買」を許可しな
FREE
Super Gator
Agustinus Biotamalo Lumbantoruan
This indi shows the following 1. Supertrend 2. Alligator (Not a regular alligator) 3. ZigZag 4. Moving Average 5. Trend Continuation/Mini correction Signal (plotted in X) (See screenshots in green background color 6. Early Signal Detection (See screenshots in green background color) You may treat Alligator as the lagging indicator The leading indicator is the supertrend. The zig zag is based on the leading indicator where it gets plotted when the leading indicator got broken to the opposite.
Price Spread Candletime
Sven Hans-rainer Uebel-scholz
Indicator with price, spread and candle time display + changeable font size + any color choice + can be placed in all four corners + Price and spread display runs on all timeframes + Candle Time runs on M1, M5, M15, M30, H1, H4, D1 + Price Up / Down with changing color + Spread display + Candle time display (time until the next candle) + All ads can also be hidden + Display Markt Open / Close as a comment
Line Magnit
Aleksey Trenin
The LineMagnit Indicator for MT4 is a highly precise tool that builds support and resistance levels which magnetically attract prices. This feature allows traders to easily determine the most probable entry and exit points in the market, as well as identify the market's directional forces, as levels are based on capital inflows into the instrument. Equipped with an intuitively understandable graphical interface, the LineMagnit Indicator enables users to quickly locate and analyze support and res
Square Dashboard is a new generation indicator that has the task of simplifying the technical analysis of the market and speeding up access to the charts. The logic of this indicator is really simple but effective, you can observe the daily, weekly and monthly opening values. The confluence of these values leads to the generation of the warning, red to identify bearish conditions, green to identify bullish conditions, while the gray color identifies the lateral condition. Having the whole market
PipFinite Trend PRO
Karlo Wilson Vendiola
4.9 (2775)
Breakthrough Solution For Trend Trading And Filtering With All Important Features Built Inside One Tool! Trend PRO's smart algorithm detects the trend, filters out market noise and gives entry signals with exit levels. The new features with enhanced rules for statistical calculation improved the overall performance of this indicator. Important Information Revealed Maximize the potential of Trend Pro, please visit www.mql5.com/en/blogs/post/713938 The Powerful Expert Advisor Version Automa
Trend Master Chart MT4
Frederic Jacques Collomb
Trend Master Chart는 귀하에게 필요한 추세 지표입니다. 차트를 오버레이하고 색상 코딩을 사용하여 다양한 시장 동향/움직임을 정의합니다. 두 개의 이동 평균과 서로 다른 오실레이터를 결합하는 알고리즘을 사용합니다. 이 세 가지 요소의 기간은 수정 가능합니다. 모든 시간대와 모든 쌍에서 작동합니다. 한 눈에 상승 또는 하락 추세와 이 추세의 다양한 진입점을 식별할 수 있습니다. 예를 들어 뚜렷한 상승 추세(밝은 녹색) 동안 이 추세 내의 다양한 시장 충동은 짙은 녹색 양초로 표시됩니다. 구성 가능한 경고를 사용하면 이러한 충동 중 하나를 놓치지 않을 수 있습니다. MT5 버전. 입력 매개변수: Period 1: 빠른 기간 이동 평균. Period 2: 느린 기간 이동 평균. Oscillator period: 오실레이터 기간. Sell/Buy alert: 시장 충동 경고, 추세 진입점. Bullish/Bearish a
FREE
이 제품의 구매자들이 또한 구매함
The product will copy all telegram signal to MT4   ( which you are member  ) , also it can work as remote copier.  Easy to set up, copy order instant, can work with almost signal formats, image signal, s upport to translate other language to English Work with all type of channel or group, even channel have "Restrict Saving Content", work with  multi channel, multi MT5 Work as remote copier: with signal have ticket number, it will copy exactly via ticket number. Support to backtest signal. How to
-25% discount ($199 -> $149) Advanced trading tool: One click smart orders that execute under your conditions Developed by trader for trading community:  position size calculator (lot size), open position after price action, strategy builder, set and forget trading, mobile notifications... Risk Management -  Risk percentage position size calculator, gain percentage, target risk reward ratio, spread and commissions are included in calculations 7 Advanced order types   - Set and forget trading
Trade Assistant GS
Vasiliy Strukov
5 (33)
거래 패널은 주문 관리로 제한됩니다. 버튼을 사용하여 열거나 사용자가 열 수 있습니다. 컬렉션에서 간단하고 편리합니다. 모든 구매자를 보완합니다. Gold Stuff 표시기와 함께 사용하는 것이 좋습니다. 단일 주문으로 거래를 설정하고 거리가 있는 그리드를 구축하십시오. 표준 그리드를 만들려면 10000과 같이 큰 거리를 설정하기만 하면 됩니다. 실시간 결과는 여기에서 볼 수 있습니다. 설정 및 개인 보너스를 받으려면 구매 후 즉시 저에게 연락하십시오!   설정 새 시리즈 열기 - 새 주문 시리즈의 온/오프 시작. Lot miltiplier - 다음 주문에 대한 로트 승수. TP - 핍으로 이익을 얻습니다. SL - 손절매, 첫 주문부터 핍 단위. 트레일 시작 - 트레일링 스톱 활성화. 트레일 스텝 - 트레일링 스톱을 활성화할 때 가격으로부터의 거리. DD 감소 알고리즘 - 수익이 있는 마지막 주문이 손실이 있는 첫 번째 주문 시리즈와 마감될 때 손실 감소 알고리즘입
The product will copy all  Discord  signal   to MT4   ( which you are member  ) , also it can work as remote copier.  Easy to set up. Work with almost signal formats, support to translate other language to English Work with multi channel, multi MT4. Work with Image signal. Copy order instant, auto detect symbol. Work as remote copier: with signal have ticket number, it will copy exactly via ticket number. How to setup and guide: Let read all details about setup and download Discord To MetaTrade
Mentfx Mmanage
Anton Jere Calmes
5 (16)
The added video will show you the full functionality, effectiveness, and simplicity of this trade manager. Drag and Drop Trade Manager. Draw your entry and have the tool calculate the rest. Advanced targeting and close portions of a trade directly available in tool (manage trades while you sleep). Market order or limit order on either side with factored spread. Just draw the entry, the tool does the rest. Hotkey setup to make it simple. Draw where you want to enter, and the stop loss, the tool c
당신이 멤버인 어떤 채널에서든(비공개 및 제한된 채널 포함) 신호를 직접 MT4로 복사하세요.  이 도구는 사용자를 고려하여 설계되었으며 거래를 관리하고 모니터하는 데 필요한 많은 기능을 제공합니다. 이 제품은 사용하기 쉽고 시각적으로 매력적인 그래픽 인터페이스로 제공됩니다. 설정을 사용자 정의하고 제품을 몇 분 안에 사용하십시오! 사용자 가이드 + 데모  | MT5 버전 | Discord 버전 데모를 시도하려면 사용자 가이드로 이동하십시오. Telegram To MT5 수신기는 전략 테스터에서 작동하지 않습니다! Telegram To MT4 특징 한 번에 여러 채널에서 신호를 복사합니다. 비공개 및 제한된 채널에서 신호를 복사합니다. Bot 토큰이나 채팅 ID가 필요하지 않습니다(필요한 경우 계속 사용할 수 있음). 위험 % 또는 고정된 로트를 사용하여 거래합니다. 특정 심볼을 제외합니다. 모든 신호를 복사할지 복사할 신호를 사용자 정의할지 선택합니다. 모든 신호를 인식하
Trade Copier Pro
Vu Trung Kien
4.6 (15)
Trade Copier Pro is a tool to copy trade remotely between multiple MT4/MT5 accounts at different computers/locations over internet. This is an ideal solution for signal provider, who want to share his trade with the others globally on his own rules. One provider can copy trades to multiple receivers and one receiver can get trade from multiple providers as well. The provider can even set the subscription expiry for each receiver, so that receiver will not be able to receive the signal after that
Custom Ultimate Sniper Dashboard
Hispraise Chinedum Abraham
5 (2)
이 맞춤형 Ultimate Sniper 대시보드는 원래 Ultimate Sniper 대시보드 지표에 대한 EA 업그레이드입니다. 최대 98개의 서로 다른 알고리즘과 함께 작동하여 작업하는 자산 클래스에 대한 추세의 진정한 특성을 포착합니다. 이는 몇 달 동안 대부분의 고객으로부터 받은 많은 제안과 조언에 대한 직접적인 응답입니다. 이 사용자 정의 버전은 완전히 사용자 정의할 수 있습니다. 98개의 개별 맞춤형 알고리즘으로 구동됩니다. 매우 멋진 시각적 인터페이스로 모든 쌍 또는 기간에 대한 전체 시장 추세를 쉽고 자신 있게 따를 수 있습니다. 텔레그램에 실시간 알림을 보낼 수 있습니다. 거래 쌍에 따라 자신의 인덱스를 만들 수 있습니다. 휴대폰으로 실시간으로 알림을 보낼 수 있으므로 움직임이 설정되고 있음을 알기 위해 PC에 있을 필요가 없습니다. 입력 설정에서 8개의 인덱스를 설정할 수 있습니다. 알림을 받을 인덱스 및 기간을 설정할 수 있습니다. 인터넷 연결이 감지되지 않으면 경
MT4 Alert Signal Trader  is an EA that helps you trade MT4 Alert popup. Some indicators can provide signals by showing an alert popup containing signal texts. This EA will read and trade these signal texts. The alert texts should contain at least 2 elements:  (1) a symbol text   (ex: "EURUSD") and  (2) a command type   (ex: "Buy", "Sell", "Close") that trigger EA's trading activities. Some other contents that may have or not are open price, stop loss, take profit values... The EA needs an aweso
TakePropips TradePad Pro
Eric John Pajarillaga Aldana
5 (4)
TakePropips TradePad Pro 에는 강력한 거래 관리자, 통화 강도 측정기, 계정 보고 도구, 위험 관리 도구 등이 포함되어 있습니다! 그것은 당신이 만나게 될 가장 진보된 외환 거래 관리자이자 거래 도우미 중 하나입니다! 보다 효율적인 무역 거래 관리 방법을 원하는 트레이더를 위한 완벽한 솔루션입니다. 다음 블로그 게시물에서 사용 설명서를 다운로드할 수 있습니다.   https://www.mql5.com/en/blogs/post/751180 Strategy Tester에서 이 거래 시스템을 테스트할 수 있습니다(비주얼 모드 활성화). 실시간 차트에서 테스트하고 싶다면 저에게 메시지를 보내 7일 평가판을 받을 수도 있습니다. 자세한 내용은 설명 아래에 비디오 자습서도 제공됩니다. 질문이 있거나 도움이 필요한 경우 언제든지 저에게 연락해 주시면 기꺼이 도와드리겠습니다. TradePad Pro는 모든 Forex 쌍, 금속, 상품, 지수 및 암호화폐에서 작동합니다.
RedFox Copier Pro
Rui Manh Tien
4.75 (12)
FREE SIGNAL CHANEL:  https://t.me/redfox_daily_forex_signals Time saving and fast execution Whether you’re traveling or sleeping, always know that Telegram To Mt4 performs the trades for you. In other words, Our   Telegram MT4 Signal Trader  will analyze the trading signals you receive on your selected Telegram channels and execute them to your Telegram to MT4 account. Reduce The Risk Telegram To Mt4   defines the whole experience of copying signals from   Telegram signal copier to mt4  p
ADAM for FTMO 40
Vyacheslav Izvarin
ADAM EA Special Version for FTMO  Our 1st EA created using ChatGPT technology Trade only GOOD and checked PROP FIRMS  Default parameters for Challenge $100,000 Tested on EURUSD and GBPUSD only  Use 15MIN Time Frame Close all deals and Auto-trading  before Weekend at 12:00 GMT+3  Friday For Prop Firms MUST use special Protector  https://www.mql5.com/en/market/product/94887 Signal using ADAM  https://www.mql5.com/en/signals/2190554 --------------------------------------------------------------
Unlimited Trade Copier Pro is a tool to copy trade remotely between multiple MT4/MT5 accounts at different computers/locations over internet. This is an ideal solution for signal provider, who want to share his trade with the others globally on his own rules. One provider can copy trades to multiple receivers and one receiver can get trade from multiple providers as well. The provider can even set the subscription expiry for each receiver, so that receiver will not be able to receive the signal
-25% discount ($149 -> $111) Everything for chart Technical Analysis indicator mt4 in one tool Draw your supply demand zone with rectangle and support resistance with trendline and get alerts to mobile phone or email alert -  Risk reward indicator Video tutorials, manuals, DEMO download   here .  Find contacts on my   profile . 1.   Extended rectangles and trendlines Object will be extended to the right edge of the chart when price will draw new candles on chart. This is rectangle extender or
News Trader Pro
Vu Trung Kien
4.41 (17)
News Trader Pro is a unique robot that allows you to trade the news by your predefined strategy. It loads every piece of news from several popular Forex websites. You can choose any news and preset the strategy to trade it, and then News Trader Pro will trade that news by selected strategy automatically when the news comes. News release gives opportunity to have pips since the price usually has big move at that time. Now, with this tool, trading news becomes easier, more flexible and more exciti
FiboPlusWaves
Sergey Malysh
5 (1)
FiboPlusWave Series products Ready-made trading system based on Elliott waves and Fibonacci retracement levels . It is simple and affordable. Display of the marking of Elliott waves (main or alternative option) on the chart. Construction of horizontal levels, support and resistance lines, a channel. Superposition of Fibonacci levels on waves 1, 3, 5, A Alert system (on-screen, E-Mail, Push notifications).    Features: without delving into the Elliott wave theory, you can immediately open one of
FTMO Sniper 4
Vyacheslav Izvarin
Dedicated for FTMO and other Prop Firms Challenges 2020-2023 Trade only GOOD and checked PROP FIRMS  Default parameters for Challenge $100,000 Best results on GOLD and US100  Use any Time Frame Close all deals and Auto-trading  before  US HIGH NEWS, reopen 2 minutes after Close all deals and Auto-trading  before Weekend at 12:00 GMT+3  Friday Recommended time to trade 09:00-21:00 GMT+3 For Prop Firms MUST use special Protector  https://www.mql5.com/en/market/product/94887 -------------------
50% off. Original price: $375 Reward Multiplier is a semi-automatic trade manager based on pyramid trading that opens additional orders with the running profit of your trades to maximize return exponentially without increasing the risk. Unlike other similar EAs, this tool shows potential profit/loss and reward to risk ratio before even entering the first trade! Download Demo here  (starting lot is fixed at 0.01) Guide + tips here MT5 version   here You only open the first order. When your t
FX28 Trader
Tsvetan Tsvetanov
5 (1)
FX28 Trader Dashboard 소개 - 귀하의 궁극적인 트레이드 매니저 FX28 Trader Dashboard는 외환 거래를 새로운 차원으로 끌어올릴 수 있는 포괄적이고 직관적인 트레이드 매니저로 귀하의 거래 경험의 전체 잠재력을 발휘합니다. 귀하가 경험이 풍부한 트레이더이든, 금융 여정을 시작한 지 얼마 안 된 초보자이든, 이 강력한 도구는 귀하의 거래 활동을 효율적으로 정리하고 의사 결정 과정을 향상시키기 위해 개발되었습니다. 주요 특징: 사용자 친화적 인터페이스: FX28 Trader Dashboard는 모든 수준의 트레이더에게 적합한 사용자 친화적 인터페이스를 자랑합니다. 다양한 기능과 도구를 쉽게 탐색하여 몇 번의 클릭으로 거래를 완전히 통제할 수 있습니다. 실시간 시장 데이터: 실시간 시장 데이터 피드를 통해 통화 쌍, 트렌드 및 시장 변동에 대한 최신 정보를 얻어 자신감 있게 거래를 실행하세요. 고급 트레이드 분석: FX28 Trader Dashboard를 사
The  Easy Strategy Builder (ESB)  is a " Do It Yourself " solution that allows you to create a wide range of the automated trading strategies without any line of codes. This is the world’s easiest method to automate your strategies that can be used in STP, ECN and FIFO brokers. No drag and drop is needed. Just by set conditions of your trading strategy and change settings on desired values and let it work in your account. ESB has hundreds of modules to define unlimited possibilities of strategi
Trade Copier Agent는 여러 MetaTrader(4/5) 계정/터미널 간에 거래를 복사하도록 설계되었습니다. 이 도구를 사용하면 제공자(소스) 또는 수신자(대상) 역할을 할 수 있습니다. 모든 거래 행위는 지연 없이 제공자에서 수신자로 복사됩니다. 이 도구를 사용하면 0.5초 미만의 매우 빠른 복사 속도로 동일한 컴퓨터의 여러 MetaTrader 터미널 간에 거래를 복사할 수 있습니다. 무역 복사기 에이전트 설치 및 입력 가이드 복사를 시작하기 전이나 주문이 없을 때 공급자 계정의 설정을 적용하십시오! 주문이 있는 동안 모든 변경 사항은 수신자 계정에 영향을 미칩니다. 예: 공급자 계정이 구매 주문을 적용한 다음 구매를 비활성화하면 수신자 계정의 모든 구매 주문이 닫힙니다. EA에 대한 알림을 받으려면 URL(   http://autofxhub.com   ) MT4 터미널을 추가하십시오(스크린샷 참조). MT5 버전   https://www.mql5.com/en
This Dashboard displays signals in grid view for the 28 major fx currency pairs. It is Mainly used for forex scalping in between 10 to 20 pips maximum and can be used on major trend market decisions. It Uses mainly Moving average and does not give false signal. All you need to note is the point in the grid where the signal occurs.  A beep sound is heard whenever there is a new signal and it will be displayedat the top of the chart.
What Exactly Is A Smart Trading Tool? Smart Trading Tool was developed for fast and comfortable trading of the financial markets especially for ORDER BLOCKS TRADERS . It provides traders functionalities, such as: A Drawing Tool One-Click Trading Panel Automated Lot Sizes Calculation based on your risk appetite & Money Management ( Watch this video , how this tool can help manage your risk per trade better!) Built in PRICE LEVELS (Fibonacci, Round Numbers, Daily hi-low, etc) Shows Trading Informa
This is exactly what the name says. Visual strategy builder . One of a kind. Turn your trading strategies and ideas into Expert Advisors without writing single line of code. Generate mql source code files with a few clicks and get your fully functional Expert Advisors, which are ready for live execution, strategy tester and cloud optimization. There are very few options for those who have no programming skills and can not create their trading solutions in the MQL language. Now, with Bots Build
Telegram MT4 Signal Trader는 Telegram 채널, 그룹, 채팅을 통해 수신되는 신호를 거래하는 데 도움이 되는 EA입니다. 채널의 소유자일 필요도 없습니다. 텔레그램 계정에서 시그널 텍스트를 읽을 수 있다면 모두 거래할 수 있습니다. EA는 Telegram API를 통해 Telegram 채널, 그룹, 개인 채팅에서 신호 텍스트를 읽는 데 도움이 되는 Telegram Reader 응용 프로그램인 멋진 무료 도구가 필요합니다. 설정 방법 여기에서 사용자 가이드를 읽고 EA가 어떻게 작동하는지 설정하고 이해하십시오. * 주요 특징: 10개의 라이선스: 10개의 VP, 데스크톱, 노트북에서 EA를 실행할 수 있습니다. 무제한 MT4 계정 및 텔레그램 채널: 무제한 MT4 계정(데모 및 실제), 무제한 텔레그램 채널(모든 채널, 그룹, 채팅), 무제한 텔레그램 계정(귀하의 계정 및 다른 사람의 계정)에 대해 EA를 사용할 수 있습니다. 모든 신호
Smart Channel M4
Vahidreza Heidar Gholami
The trend in the market can be predicted using trend lines but the problem is you don’t know where exactly the price is going to touch the trend line where you can put your pending orders on. Smart Channel Expert Advisor makes it possible to put an advanced channel around the price data, which can be configured to handle placing orders, opening and closing positions, managing risk per trade, spread, slippage, and trailing stop-loss and take-profit automatically. Features Money Management (Calcul
Trade Assistant Pro 36 in 1
Makarii Gubaydullin
4.95 (20)
다기능 도구: 로트 계산기, 가격 조치, R/R 비율, 무역 관리자, 공급 및 수요 영역을 포함한 65개 이상의 기능 데모 버전   |   사용자 매뉴얼   |   MT5 버전 이 유틸리티는 전략 테스터에서 작동하지 않습니다. 여기에서 데모 버전을 다운로드하여 제품을 테스트할 수 있습니다. Contact me   질문/개선 아이디어가 있는 경우/버그가 발견된 경우 저에게 연락 하십시오. 거래 프로세스를 간소화, 가속화 및 자동화하십시오. 이 대시보드로 표준 터미널 기능을 확장하십시오. 유틸리티는 외환, 주식, 지수, 암호화폐 등 모든 거래 수단에서 작동합니다. 1. 새로운 거래 열기 : 로트/리스크/RR 계산: 1. Lot 계산기 (리스크 규모에 따른 거래량 계산) 2. 리스크 계산기 (로트 규모에 따른 리스크 금액) 3. 위험/보상 비율(RR) 4. 주문에 대한 활성화 트리거 + StopLimit 구매 / StopLimit 판매 5. 가상 SL / TP 레벨 (숨겨진 SL
Strategy Builder offers an incredible amount of functionality. It combines a trade panel with configurable automation (covert indicators into an EA), real-time statistics (profit & draw down) plus automatic optimization of SL, TP/exit, trading hours, indicator inputs. Multiple indicators can be combined into an single alert/trade signal and can include custom indicators, even if just have ex4 file or purchased from Market. The system is easily configured via a CONFIG button and associated pop-up
Forex Market View Dashboard and CSM
Opengates Success International
5 (2)
FFXMV Dashboard + CSM is a custom indicator combined with Currency Strength Meter . It is created to give the Traders a full view of what is going on in the market. It uses a real time data to access the market and display every bit of information needed to make a successful trading. Before attaching this Indicator to your window chart, go to your MT4's Market Watch panel and HIDE all the Currency pairs you don't need or trade and leave the rest there. The reason is that FFMV Dashboard will DISP
AntiMartingale-Execution is a pyramidal Money Management system capable of increasing positions as equity increases using the positive margin of the transaction. It is possible to set the capital for each operation, the operating and maximum margins and the target level to be reached. Once the general trade settings have been made, it is possible to preview the grid of operations that will be activated by pressing the BUY / SELL button. If necessary, it is also possible to close all operations
필터:
리뷰 없음
리뷰 답변