Ransa IND 0
- 지표
- Ranjit Kumar Dehury
- 버전: 1.2
- 업데이트됨: 28 3월 2022
- 활성화: 10
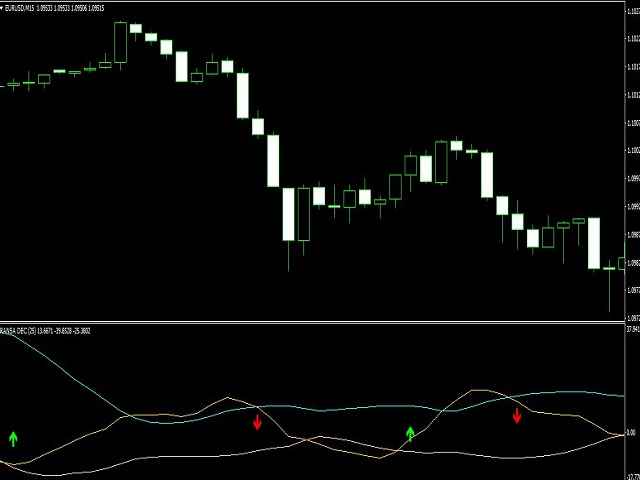
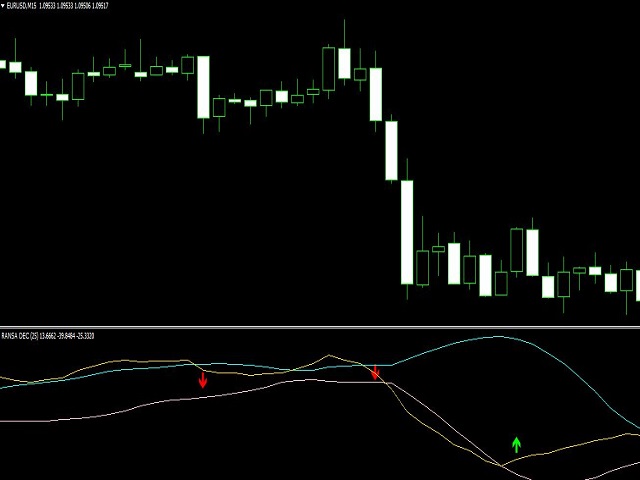
The indicator is extremely versatile and can be used successfully on all time frames!
This indicator is 100% NON repainting! It will never recalculate or back paint!
The Signal indicator will give you the BUY & SELL suggestions which you can use if you prefer.
==================================================
Disclaimer: Please remember that past performance does not guarantee future results. Please practice on a demo account first to get familiar with the indicator's operation and settings before trading it live, and ALWAYS use a good money management! This indicator is not perfect and there will be losses sometimes, that's why its imperative to always use a stop loss to help mitigate the losses and protect your profits!
The frequency and amount of signals you can have will depend on many factors like current market conditions, market volatility, time frame traded, how many pairs you trading, and settings being used. Some days you might have many signals and some days none, this is completely normal. Our indicator focuses on quality not quantity. Pay close attention to scheduled high impact news events, unscheduled geopolitical news events, and strong fundamentals as these can cause the indicator to have some false signals even though technically the order is valid and correct.