Naked Forex Tweezer Standard indicator for MT4
- 지표
- Renaud Herve Francois Candel
- 버전: 3.50
- 업데이트됨: 10 7월 2023
- 활성화: 5
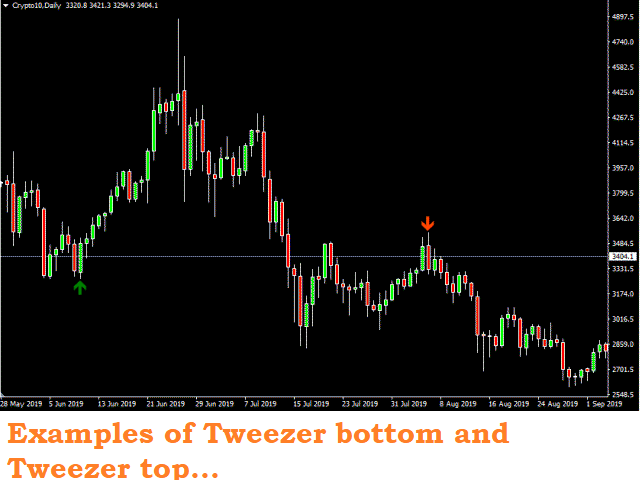
Naked Forex Tweezer Standard Indicator
Tweezer Indicator is a pattern recognition indicator for Forex, Stocks, Indices, Futures, Commodities and Cryptos.
The standard Tweezer is a two bar pattern. Our enhanced version is a multi-bar pattern. We filter the patterns for you so that you only get the best and most effective patterns and ignore the noise.
The Tweezer pattern is a simple and effective pattern to trade.
The strategy that comes with the Tweezer is based on price action.
The indicator does what it was designed for: displaying Tweezer patterns. Don't expect to follow the up and down arrows and make money. Trading is not that simple. The Tweezer pattern is a starting point. The arrow is not a confirmed BUY and SELL signal in itself. The Tweezer indicator alerts you that the market might be at a turning point now. Then you must use other elements of your strategy (trend, momentum, support/resistance, volatility, daily bias, and other indicators) to confirm the signal and place a trade.
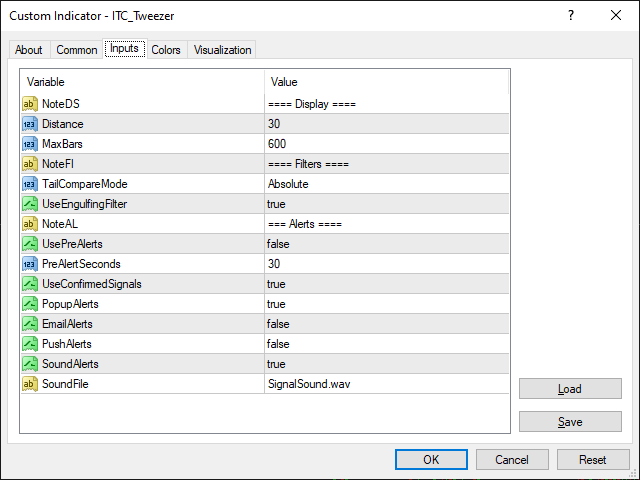
Inputs of the indicator are:
- Distance: distance in pixel relative to top or bottom of candle to display the arrow symbol
- MaxBars: maximum number of bars back to calculate searching for signals
- TailCompareMode (Relative/Absolute): use size of candles (Relative) or size of tails themselves (Absolute) as a reference to compare tails sizes differences and valid the pattern.
- UseEngulfingFilter (true/false): if set to true then ignore patterns that do not include engulfing pattern.
- UsePreAlerts (true/false): to enable pre-alerts. It is required to set this value to true if you want to receive pre-alerts.
- PreAlertsSeconds (30): time in seconds before the close of the candle when pre-alerts will be activated (pre-alerts can disappear).
- UseConfirmedSignals (true/false): generate alerts for confirmed signals (at the close of the bar). It is required to set this value to true if you want to receive confirmed signals alerts.
- PopupAlerts (true/false): to enable alerts of type Popup window
- EmailAlerts (true/false): to enable alerts of type Email
- PushAlerts (true/false): to enable alerts of type Push Notification
- SoundAlerts (true/false): to enable alerts of type Sound
- SoundFile: file to be used for sound alerts
Trading rules:
- For BUY: wait for a bullish Tweezer (Tweezer bottom) to print on a support zone after a down trend. Wait for price to break high of the Tweezer pattern (5 pips above the high for H1 and higher time frames). Immediately enter in the trade once high is broken. You also can use a BUY STOP order placed 5 pips above the high of the candle (plus spread). Stop Loss should be placed below the low of the Tweezer pattern. If order is not triggered in the next candle then trade is invalidated and should be canceled.
- For SELL: wait for a bearish Tweezer (Tweezer top) to print on resistance zone after an up trend. Wait for price to break the low of the Tweezer pattern (5 pips below the low for H1 and higher time frames). Immediately enter in the trade once low is broken. You also can use a SELL STOP order place 5 pips below the low of the candle. Stop Loss should be placed above the high of the Tweezer pattern. If order is not triggered in the next candle then trade is invalidated and should be canceled.
Other indicators for MT4:
We developed more than 60 indicators and utilities for Metatrader 4 and Metatrader 5.
All our indicators are developed both for MT4 and MT5.
List of all our indicators:
You can see the complete list of our indicators visiting our profile page.