Normalized Trend Reversal Multi Time Frame MT4
- 지표
- Tino Viehweg
- 버전: 1.0
- 활성화: 5
정규화된 추세 반전 다중 시간 프레임 표시기
정규화된 추세 반전 다중 시간 프레임 표시기는 매우 안정적인 추세 반전 표시기로 개발되었습니다.
정규화된 추세 반전 다중 시간 프레임 표시기는 모든 외환 통화 쌍 및 금속에 적합하며 모든 종류의 시간 프레임 차트와 일치할 수 있습니다.
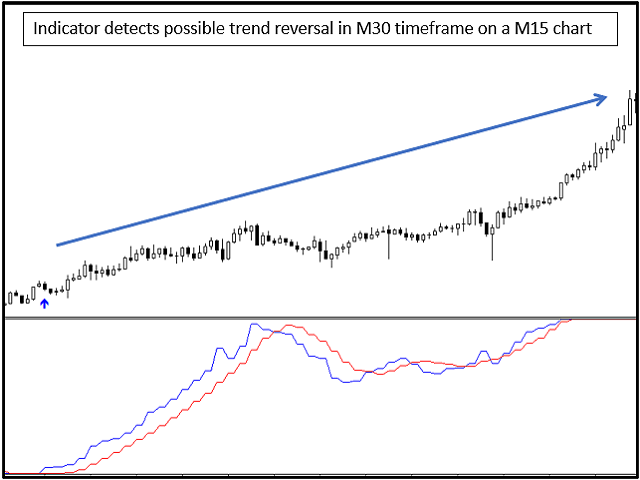
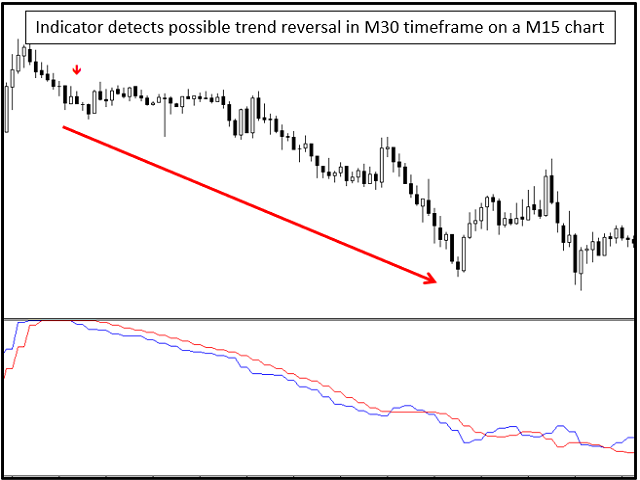
정규화된 추세 반전 다중 시간 프레임 표시기는 별도의 창에서 두 개의 수정된 이동 평균 시스템의 교차를 사용하여 신호를 생성합니다.
이러한 평균 수준을 정규화된 추세 반전 다중 시간 프레임 표시기라고 합니다.
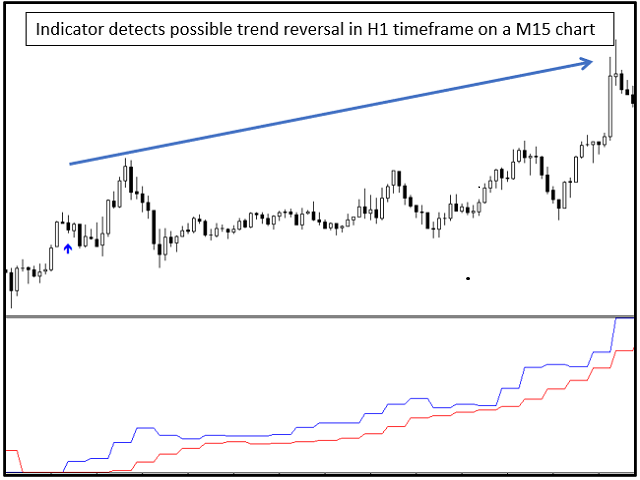
파란색 평균 수준을 빠른 정규화 추세 반전 다중 시간 프레임 표시기라고 하고 느린 정규화 추세 반전 다중 시간 프레임 표시기를 빨간색 평균 수준으로 표시합니다.
빠른 파란색 정상화 추세 반전 다중 시간 프레임 표시기가 느린 빨간색 정상화 추세 반전 다중 시간 프레임 표시기를 교차할 때마다 시장에 매수 진입을 알리는 강세 크로스오버로 간주됩니다.
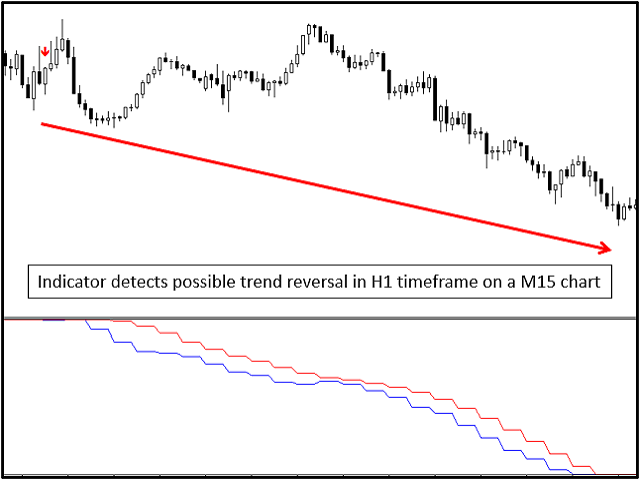
반면에 느린 빨간색 정규화 추세 반전 다중 시간 프레임 표시기가 빠른 파란색 표시기를 교차하여 유지하면 약세 크로스오버가 발생합니다.
구매자를 위한 지원 그룹이 있습니다. 댓글로 요청하세요.
일반 정보
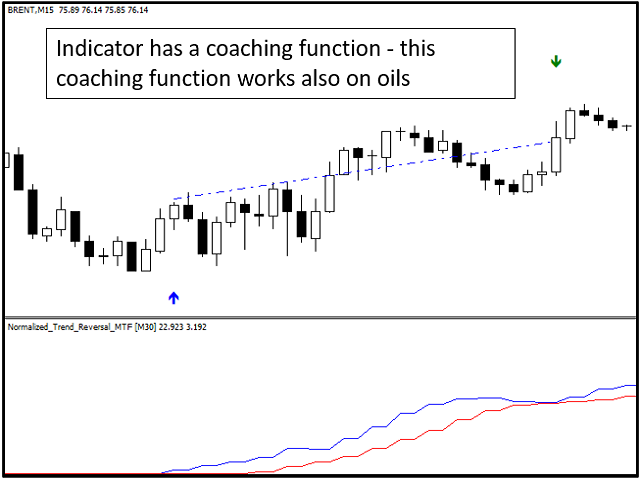
정규화된 추세 반전 다중 시간 프레임 표시기
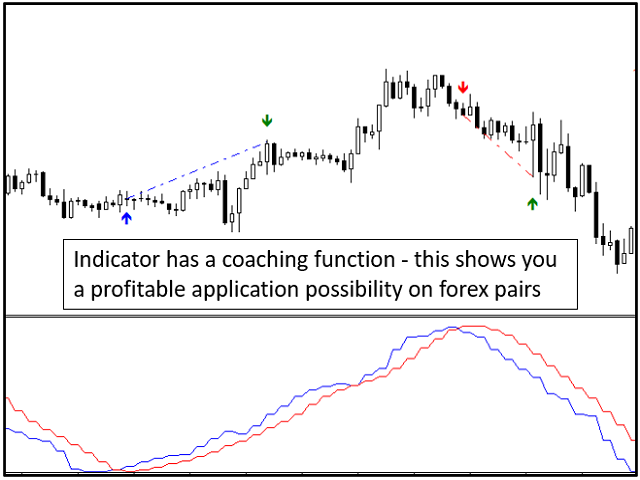
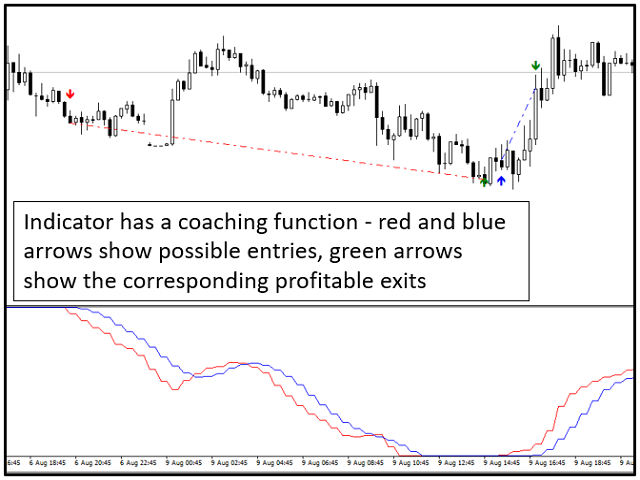
코칭 기능이 있습니다.
이는 지표 자체가 현재 설치된 차트에 이미 있는 거래 사례를 보여 준다는 것을 의미합니다.
입구와 출구는 파선으로 시각화되고 시각적으로 연결됩니다.
따라서 지속적으로 거래를 개선할 수 있습니다.
정규화된 추세 반전 다중 시간 프레임 표시기.
최상의 결과를 얻으려면 이 전자 통신 네트워크 계정을 권장합니다.
정규화된 추세 반전 다중 시간 프레임 표시기
브로커 Roboforex의 전자 통신망 데이터 피드로 최적화되었습니다.
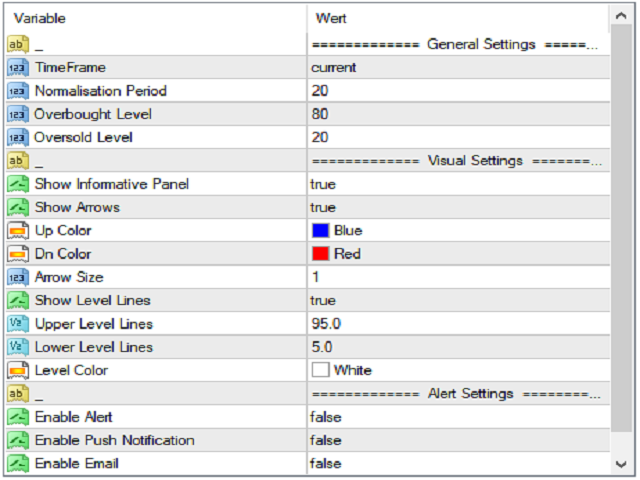
매개변수
설정에서 해당
타임프레임,
정상화 기간 및
과매수 /
과매도 수준을 설정할 수 있습니다.
정규화된 추세 반전 다중 시간 프레임 표시기.
정규화 기간을 사용하면 정규화된 추세 반전 다중 시간 프레임 표시기를 적용해야 하는 경우 값의 정규화 기간을 설정할 수 있습니다.
이 정규화는 예를 들어 시장이 평탄한 단계에 있을 때 잘못된 신호를 배제하는 역할을 합니다.
이러한 현재 평균 수준의 정상화로 인해 간편하고 정확한 시장 진입 가능성을 제공할 수 있다.