• 미리보기
  • 리뷰
  • 코멘트
  • 새 소식

Real NonRePaint 3TF RSI With Special Averaging

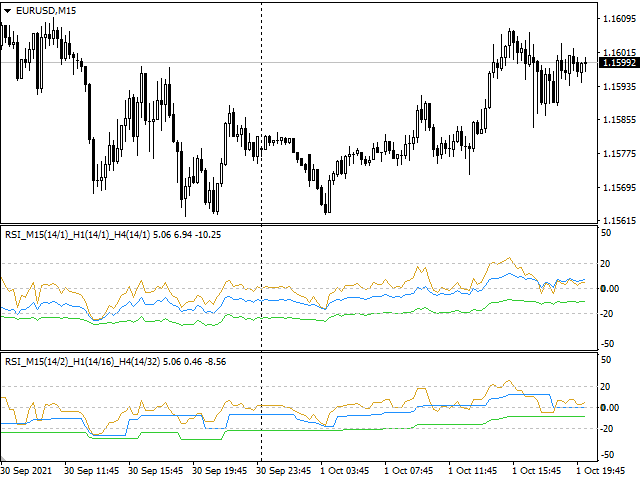
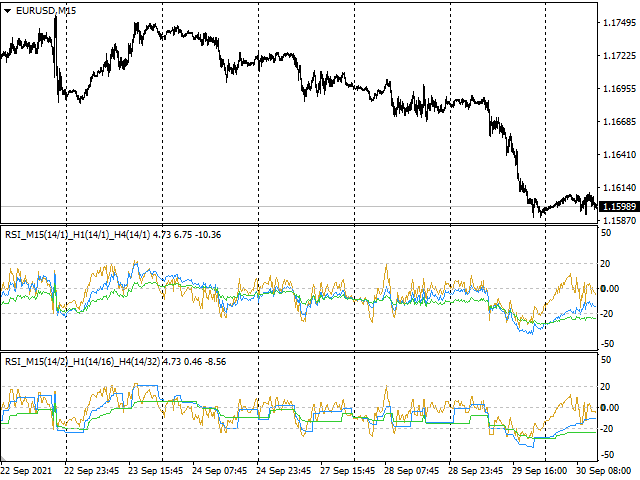
Индикатор содержит 3 RSI с возможностью выбора рабочего таймфрейма, периода и параметра сглаживания каждого.

Не перерисовывает начиная с 1 бара.

При задании параметра сглаживания большего 1 показания будут обработаны специальным образом, для исключения мелких колебаний.

Возможно использовать в качестве готовой торговой системы, где показания старших ТФ определяют тренд, а младший используется для поиска точек входа,

в качестве примера может служить система Дмитрия Брылякова https://www.infoclub.info/live/zarabatyvayte-operezhaya-rynok

только мой индикатор не рисует!!! Показания 1 бара не изменятся никогда.

추천 제품
VR Cub
Vladimir Pastushak
VR Cub 은 고품질 진입점을 얻는 지표입니다. 이 지표는 수학적 계산을 용이하게 하고 포지션 진입점 검색을 단순화하기 위해 개발되었습니다. 지표가 작성된 거래 전략은 수년 동안 그 효율성을 입증해 왔습니다. 거래 전략의 단순성은 초보 거래자라도 성공적으로 거래할 수 있다는 큰 장점입니다. VR Cub은 포지션 개시 지점과 이익 실현 및 손절매 목표 수준을 계산하여 효율성과 사용 편의성을 크게 높입니다. 간단한 거래 규칙을 이해하려면 아래 전략을 사용한 거래 스크린샷을 살펴보세요. 설정, 세트 파일, 데모 버전, 지침, 문제 해결 등은 다음에서 얻을 수 있습니다. [블로그] 다음에서 리뷰를 읽거나 작성할 수 있습니다. [링크] 버전 [MetaTrader 5] 진입점 계산 규칙 포지션 개설 진입점을 계산하려면 VR Cub 도구를 마지막 최고점에서 마지막 최저점까지 늘려야 합니다. 첫 번째 지점이 두 번째 지점보다 빠른 경우, 거래자는 막대가 중간선 위에서 마감될 때까지 기다립
Infinity Trend Pro
Yaroslav Varankin
1 (1)
This is a trend indicator without redrawing Developed instead of the binary options strategy (by the color of the Martingale candlestick) Also works well in forex trading When to open trades (binary options) A signal will appear in the place with a candle signaling the current candle It is recommended to open a deal for one candle of the current timeframe M1 and M5 When a blue dot appears, open a deal up When a red dot appears, open a trade down. How to open trades on Forex. When a signal is rec
Black series MT4
Dmitriy Kashevich
1 (1)
Black series MT4 - The indicator is designed for trading on binary options with Timeframe M1-M5-M15 Multicurrency (Works on cryptocurrency and currency pairs) The signal appears when the candle opens Up to 90% correct signals There is no signal redrawing at all Can be used with other indicators. Good for scalping! In Settings there is: -Indicator working methods -I Allert Arrow color Red signal down Blue signal up Also watch the video how the indicator works and signals
This is an arrow indicator without a future function,developed based on the most advanced profit trading algorithms.It has the most innovative and advanced dual trend analysis module, as well as the latest and highly effective market trend prediction algorithm.Trends are your friends, and following larger trends can earn the maximum profit in foreign exchange. This indicator helps traders identify current trends and track them. Someone once made a profit of 10 times in a week by relying on it.No
PZ Trend Trading
PZ TRADING SLU
4.75 (4)
Trend Trading is an indicator designed to profit as much as possible from trends taking place in the market, by timing pullbacks and breakouts. It finds trading opportunities by analyzing what the price is doing during established trends. [ Installation Guide | Update Guide | Troubleshooting | FAQ | All Products ] Trade financial markets with confidence and efficiency Profit from established trends without getting whipsawed Recognize profitable pullbacks, breakouts and early reversals The ind
Trendiness Index
Libertas LLC
5 (3)
"The trend is your friend" is one of the best known sayings in investing, because capturing large trendy price movements can be extremely profitable. However, trading with the trend is often easier said than done, because many indicators are based on price reversals not trends. These aren't very effective at identifying trendy periods, or predicting whether trends will continue. We developed the Trendiness Index to help address this problem by indicating the strength and direction of price trend
Owl smart levels
Sergey Ermolov
4.63 (54)
MT5 버전  |   FAQ Owl Smart Levels Indicator 는   Bill Williams 의 고급 프랙탈, 시장의 올바른 파동 구조를 구축하는 Valable ZigZag, 정확한 진입 수준을 표시하는 피보나치 수준과 같은 인기 있는 시장 분석 도구를 포함하는 하나의 지표 내에서 완전한 거래 시스템입니다. 시장과 이익을 취하는 장소로. 전략에 대한 자세한 설명 표시기 작업에 대한 지침 고문-거래 올빼미 도우미의 조수 개인 사용자 채팅 ->구입 후 나에게 쓰기,나는 개인 채팅에 당신을 추가하고 거기에 모든 보너스를 다운로드 할 수 있습니다 힘은 단순함에 있습니다! Owl Smart Levels   거래 시스템은 사용하기 매우 쉽기 때문에 전문가와 이제 막 시장을 연구하고 스스로 거래 전략을 선택하기 시작한 사람들 모두에게 적합합니다. 전략 및 지표에는 눈에 보이지 않는 비밀 공식 및 계산 방법이 없으며 모든 전략 지표는 공개되어 있습니다. Owl Smart Lev
Strength and weakness of currencies : Shows the currency status at any time, values between 50 and -50 are neutral, everything outside indicates a trend change  Waves : Current state of waves, daily, weekly monthly and yearly Recommended volume for trading a specific number of waves Yearly High Low Drawn waves on which the market will react in advance, without redrawing Yearly candle with bonus levels used to display deviations  For more info contact me
무한대에서 통화의 강도를 측정하는이 혁신적인 지표는 오랫동안 거래하는 암표 및 거래자에게 없어서는 안될 조수입니다. 통화의 강도/약점을 분석하는 시스템은 오랫동안 알려져 있으며 세계 최고의 거래자들에 의해 시장에서 사용되었습니다. 이 분석 없이는 차익 거래가 완료되지 않습니다. 우리의 지표는 서로 관련하여 기본 통화의 강도를 쉽게 결정합니다. 표시 라인에 차트에 대한 모든 또는 현재 통화 쌍의 수 있도록 즉각적인 분석 및 검색에 대한 강한 진입 점. 표시등,직관적 인 사용하면 신속하게 찾아와 스위치는 모든 쌍,모바일 패널 배치할 수 있는 모두에서 지하실에는 기본 차트. 통화의 강도의 변화의 통지의 타이머 모드는 상인에게 전화로 알림을받을 수있는 기회를 제공합니다.  통화 전력계 무한대 표시기를 사용하기위한 몇 가지 전략: 1. 신흥 추세에 대한 신호로 교차점을 검색 할 통화의 강도의 선형 표시의 차트를 사용하여 2. 추세 반전 신호가 나타난 후 강한 통화 방향으로 두피
Noize Absorption Index MT4
Ekaterina Saltykova
5 (1)
Noize Absorption Index - is the manual trading system that measures the difference of pressure between bears forces and bulls forces. Green line - is a noize free index that showing curent situation. Zero value of index shows totally choppy/flat market.Values above zero level shows how powerfull bullish wave is and values below zero measures bearish forces.Up arrow appears on bearish market when it's ready to reverse, dn arrow appears on weak bullish market, as a result of reverse expectation. S
Gyroscopes
Nadiya Mirosh
Gyroscope        professional forex expert   (for EURUSD, GBPUSD, USDJPY, AUDUSD, USDCHF, EURGBP, EURJPY, NZDUSD, USDCAD, EURCHF, AUDJPY, CADJPY pairs)   alyzing the market using the Elliot Wave Index. Elliott wave theory is the interpretation of processes in financial markets through a system of visual models (waves) on price charts. The author of the theory, Ralph Elliott, identified eight variants of alternating waves (of which five are in the trend and three are against the trend). The mo
Distinctive
Tatiana Savkevych
Distinctive is a forex trending arrow indicator for identifying potential entry points. I like it, first of all, because it has a simple mechanism of work, adaptation to all time periods and trading tactics. Created on the basis of a regression channel with filters. Plotting the Lawrence indicator signals on a price function chart using a mathematical approach. How it works - when the price breaks out in the overbought / oversold zone (channel levels), a buy or sell signal is generated. Every
PABT Pattern Indicator - it's classical system one of the signal patterns. Indicator logic - the Hi & Lo of the bar is fully within the range of the preceding bar, look to trade them as pullback in trend. In the way if indicator found PABT pattern it's drawing two lines and arrow what showing trend way.  - First line - it's entry point and drawing at: 1. On the high of signal bar or on middle of the signal bar (depending from indicator mode) for buy; 2. On the low of signal bar or on middle of t
Cosmic Diviner X Planet
Olena Kondratenko
4 (2)
This unique multi-currency strategy simultaneously determines the strength of trends and market entry points, visualizing this using histograms on the chart. The indicator is optimally adapted for trading on the timeframes М5, М15, М30, Н1. For the convenience of users, the indicator renders the entry point (in the form of an arrow), recommended take profit levels (TP1, TP2 with text labels) and the recommended Stop Loss level. The take profit levels (TP1, TP2) are automatically calculated for
For sure, this indicator has become very popular amongst traders. Through coding this indicator will give you the most accurate levels possible for your trading analysis. We have also added in the ability for you to receive alerts when the price breaks above or below a Support or Resistance lines! HOW TO USE The red rectangles represent your resistance/supply zone. The green rectangles represent your support/demand zone.  BONUS FEATURES We coded this indicator with the ability to switch between
Blahtech Market Profile
Blahtech Limited
4.61 (18)
Was: $249  Now: $99   Market Profile defines a number of day types that can help the trader to determine market behaviour. A key feature is the Value Area, representing the range of price action where 70% of trading took place. Understanding the Value Area can give traders valuable insight into market direction and establish the higher odds trade. It is an excellent addition to any system you may be using. Blahtech Limited presents their Market Profile indicator for the MetaTrader community. Ins
REX complete 3in1
Christophe Godart
This is the complete REX package. It consists of the lite, pro and ULTRA version.  Perfect for beginners and intermediates. REX complete is 100% non repaint. The strategy is based on a mix of different strategies, statistics, including pivot points, oscillators and patterns.  As the trading idea consists of a variety of some classic indicators like Momentum, Williams Percent Range, CCI, Force Index, WPR, DeMarker, CCI, RSI and Stochastic, it is clear that the fundamental indicators have being
Trade with Gann on your side!! MASTER CIRCLE 360 CIRCLE CHART, originally created by Gann admitted that this is “The Mother of all charts”. It is one of the last studies that this great trader left for us. The numeric tab le is apparently quite simple like all the tables and is based on square numbers, the SQUARE OF 12 and is by evolution, one of the most important square numbers. Here we can find CYCLE, PRICE AND TIME thanks to angles and grades, to show past and future support and resistance.
Fibonacci retracement and extension line drawing tool Fibonacci retracement and extended line drawing tool for MT4 platform is suitable for traders who use  golden section trading Advantages: There is no extra line, no too long line, and it is easy to observe and find trading opportunities Trial version: https://www.mql5.com/zh/market/product/35884 Main functions: 1. Multiple groups of Fibonacci turns can be drawn directly, and the relationship between important turning points
This indicator is another variant of the famous powerful indicator Fibonacci-SS https://www.mql5.com/en/market/product/10136 but has different behaviour in placing Pending Order and TP Line. Automatically places Fibonacci retracement lines from the last highest and lowest visible bars on the chart with: An auto Pending Order (Buy/Sell). Taking Profit 1, Taking Profit 2 is pivot point and Taking Profit 3 for extended reward opportunity. The best risk and reward ratio. Simple and powerful indica
Master scalping M1
Nataliia Marchuk
Master Scalping M1 is an innovative indicator that uses an algorithm to quickly and accurately determine the trend.The indicator calculates the time of opening and closing positions, the indicator's algorithms allow you to find the ideal moments to enter a deal (buy or sell an asset), which increase the success of transactions for most traders. Benefits of the indicator: Easy to assemble, does not overload the chart with unnecessary information. Can be used as a filter for any strategy. Works on
Chart Patterns Detect 15 patterns (Ascending Triangle, Descending Triangle, Rising Wedge, Falling Wedge, Bullish Flag, Bearish Flag, Bullish Rectangle, Bearish Rectangle Symmetrical triangle, Head and Shoulders, Inverted Head and Shoulders, Triple top, Triple Bottom, Double Top, Double Bottom) Use historical data to calculate the probability of each pattern to succeed (possibility to filter notification according to the chance of success) gives graphic indication about the invalidation level and
PZ Mean Reversion MT4
PZ TRADING SLU
2.33 (3)
평균 회귀 거래에 대한 전문적이고 정량적인 접근 방식을 구현하는 고유한 지표입니다. 이는 가격이 예측 가능하고 측정 가능한 방식으로 평균으로 전환되고 반환된다는 사실을 이용하여 비정량적 거래 전략을 훨씬 능가하는 명확한 진입 및 퇴장 규칙을 허용합니다. [ Installation Guide | Update Guide | Troubleshooting | FAQ | All Products ] 명확한 거래 신호 놀랍도록 쉬운 거래 사용자 정의 가능한 색상 및 크기 성능 통계 구현 대부분의 거래 전략을 능가합니다. 적절한 SL 및 TP 레벨을 표시합니다. 이메일/음향/시각 알림을 구현합니다. 작동 원리 이 지표는 더 높은 기간에서 완전히 사용자 정의 가능한 이동 평균 주변의 표준 편차를 측정하고 추세 추종 접근 방식을 사용하여 정확하게 거래를 찾습니다. 거래는 현재 차트의 가격 동작을 살펴보고 선택한 더 높은 기간에서 계산된 평균 가격대로 가격이 돌아오면 닫힙니다. 코딩 방식 때문
캔들의 종가를 예측하는 지표입니다. 지표는 주로 D1 차트에서 사용하기 위한 것이. 이 지표는 전통적인 외환 거래와 바이너리 옵션 거래 모두에 적합합니다. 지표는 독립형 거래 시스템으로 사용하거나 기존 거래 시스템에 추가로 사용할 수 있습니다. 이 표시기는 현재 양초를 분석하여 양초 본체 내부의 특정 강도 요인과 이전 양초의 매개변수를 계산합니다. 따라서 지표는 시장 움직임의 추가 방향과 현재 양초의 종가를 예측합니다. 이 방법 덕분에 지표는 단기 및 중장기 거래 모두에 적합합니다. 지표를 사용하면 시장 상황을 분석하는 동안 지표가 생성할 잠재적 신호의 수를 설정할 수 있습니다. 표시기 설정에는 이를 위한 특별한 매개변수가 있습니다. 또한 인디케이터는 새로운 신호에 대해 차트의 메시지 형태, 이메일 및 PUSH 알림 형태로 알릴 수 있습니다. 구매 후 저에게 꼭 써주세요! 나는 당신에게 지표와 거래에 대한 나의 추천을 줄 것입니다! 또한 보너스를 받으세요!
Atomic Analyst
Issam Kassas
5 (2)
우선적으로 언급할 점은이 거래 지표가 다시 그리지 않고 지연되지 않으며 이를 통해 수동 및 로봇 거래 모두에 이상적이라는 점입니다. Atomic Analyst는 가격의 강도와 모멘텀을 활용하여 시장에서 더 나은 이점을 찾는 PA Price Action Indicator입니다. 고급 필터를 장착하여 잡음과 거짓 신호를 제거하고 거래 잠재력을 높이는 데 도움이 됩니다. 복잡한 지표의 다중 레이어를 사용하여 Atomic Analyst는 차트를 스캔하고 복잡한 수학적 계산을 간단한 신호와 색상으로 변환하여 초보 트레이더가 이해하고 일관된 거래 결정을 내릴 수 있도록합니다. "Atomic Analyst"는 새로운 및 경험이 풍부한 트레이더를위한 종합적인 거래 솔루션입니다. 프리미엄 지표와 최고 수준의 기능을 하나의 거래 전략에 결합하여 모든 종류의 트레이더에 대한 다재다능한 선택지가되었습니다. 인트라데이 거래 및 스캘핑 전략 : 빠르고 정확한 일일 거래 및 단기 거래를 위해 설계
Elliott Wave Trend MT4
Young Ho Seo
4 (7)
Elliott Wave Trend was designed for the scientific wave counting. This tool focuses to get rid of the vagueness of the classic Elliott Wave Counting using the guideline from the template and pattern approach. In doing so, firstly Elliott Wave Trend offers the template for your wave counting. Secondly, it offers Wave Structural Score to assist to identify accurate wave formation. It offers both impulse wave Structural Score and corrective wave Structure Score. Structural Score is the rating to sh
Forex Gump
Andrey Kozak
2.83 (6)
Forex Gump is a fully finished semi-automatic trading system. In the form of arrows, signals are displayed on the screen for opening and closing deals. All you need is to follow the instructions of the indicator. When the indicator shows a blue arrow, you need to open a buy order. When the indicator shows a red arrow, you need to open a sell order. Close orders when the indicator draws a yellow cross. In order to get the most effective result, we recommend using the timeframes H1, H4, D1. There
The Th3Eng PipFinite indicator is based on a very excellent analysis of the right trend direction with perfect custom algorithms. It show the true direction and the best point to start trading. With StopLoss point and Three Take Profit points. Also it show the right pivot of the price and small points to order to replace the dynamic support and resistance channel, Which surrounds the price. And Finally it draws a very helpful Box on the left side on the chart includes (take profits and Stop loss
History Pattern Search
Yevhenii Levchenko
표시기는 현재 시세를 작성하여 과거 시세와 비교할 수 있으며 이를 바탕으로 가격 변동을 예측합니다. 표시기에는 원하는 날짜로 빠르게 이동할 수 있는 텍스트 필드가 있습니다. 옵션: 기호 - 표시기가 표시할 기호 선택. SymbolPeriod - 지표가 데이터를 가져올 기간 선택. IndicatorColor - 표시기 색상. HorisontalShift - 지시자가 그린 따옴표를 지정된 막대 수만큼 이동합니다. Inverse - true는 인용 부호를 반대로, false - 원래 보기를 반전합니다. ChartVerticalShiftStep - 차트를 수직으로 이동합니다(키보드의 위/아래 화살표). 다음은 날짜를 입력할 수 있는 텍스트 필드의 설정으로, '엔터'를 누르면 즉시 이동할 수 있습니다.
ZhiBiMACD MT4
Qiuyang Zheng
4.5 (2)
This is a unique MACD indicator that is more accurate and easy to use than traditional MACD. It is suitable for any chart cycle and is suitable for any market variety. The red column is the (Buy) band signal, and the blue column is the (Sell) band signal. The yellow and green lines are trend lines, and the two lines never cross. Buy: In the blue column, look at the green line up through the middle 0 axis. Sell: In the red column, look at the yellow line down the middle 0 axis. The MACD
이 제품의 구매자들이 또한 구매함
기적적인 외환 지표 소개: 정확한 트레이딩의 힘을 발휘하세요 모든 시간대에서 뛰어난 결과를 제공하는 최고의 외환 지표를 찾는데 지친 적이 있나요? 더 이상 찾을 필요가 없습니다! 기적적인 외환 지표가 도래하여 귀하의 트레이딩 경험을 혁신하고 수익을 새로운 고도로 끌어올립니다. 최첨단 기술과 수년간의 정성스런 개발을 토대로 기적적인 외환 지표는 외환 시장에서의 힘과 정확성의 정점으로 떠오릅니다. 이 탁월한 도구는 모든 수준의 트레이더의 요구를 충족시키고 지속적인 수익을 추구하는 데에서 비길 데 없는 우위를 제공하기 위해 설계되었습니다. 기적적인 외환 지표의 가장 큰 장점은 그 뛰어난 적응성에 있습니다. 당신이 데이 트레이더, 스윙 트레이더이든 장기 포지션을 선호하든, 이 지표는 모든 시간대에서 뛰어난 결과를 제공하기 위해 최적화되었습니다. 그러나 그 정확성과 시장의 복잡한 움직임을 포착하는 능력이 참으로 빛을 발하는 것은 1시간 기간대에서 사용할 때입니다. 기적적인 외환 지표의 정확성
TrendMaestro
Stefano Frisetti
5 (2)
note: this indicator is for METATRADER4, if you want the version for METATRADER5 this is the link: TRENDMAESTRO recognizes a new TREND in the bud, he never makes mistakes. The certainty of identifying a new TREND is priceless. DESCRIPTION TRENDMAESTRO identifies a new TREND in the bud, this indicator examines the volatility, volumes and momentum to identify the moment in which there is an explosion of one or more of these data and therefore the moment in which prices have strong probability of f
Weis Wave with Alert
Trade The Volume Waves Single Member P.C.
4.79 (19)
Rental/Lifetime Package Options and Privileges' * For optimum results the yearly or lifetime package is suggested due to live training and Discord  channel trading with the  creator! Rent Monthly Six Months   Yearly/Lifetime Weis Wave with Speed with Alert+Speed Index x x x Manual  x x x Quick Set up Video x x x Blog x x x Lifetime Updates x x x Setup and Training Material x x Free Rectangle Break Alert Tool      x Discord Access Channel "The SI traders" x 2-hour live methodology traini
VTrende Pro mt4
Andrii Diachenko
3 (2)
VTrende Pro MT4 - MTF indicator for trend trading with a display panel for MT5 *** Videos can be translated into any language using subtitles (video language - Russian) Although the signals of the VTrende Pro indicator can be used as signals of a full-fledged trading system, it is recommended to use them in conjunction with the Bill Williams TS. VTrende Pro  MT4 is an extended version of the VTrende indicator. Difference between Pro version and VTrende: - Time zones - Signal V - signal 1-
Full STO
Roman Smoroda
전체 STO 표시기 (프리미엄, 골드, 실버의 세 가지 STO 표시기의 모든 버전 포함)-안정적인 거래 옵션은 자동 바이너리 옵션 거래를 위해 설계되었습니다.  주의 깊게 읽기!!!!! 중요 하나의 터미널에서 만기가 다른 두 개의 템플릿, 즉 18:01, 18:02의 만기가 1 분에서 15 분인 템플릿과 10 분에서 20 분의 만기가 22:00 인 템플릿을 만듭니다. 승률: 지난 5년간 71% 자금 관리: 예치금에서 0.3 이 버전의 지표는 모스크바 시간 18:01, 18:02, 22:00 거래 전용으로 설정되며 실버 및 금의 경우 1에서 15까지, 프리미엄 버전의 경우 10에서 20 분까지 만료됩니다. 신호는 양초 내부에 나타나고 커넥터를 사용하면 양초 내부에 마크 개구부를 넣으면 즉시 거래를 시작합니다. 표시기가 완전히 구성되었으므로 직접 변경할 필요가 없습니다. 설치 및 거래 !!! 확인 및 테스트없이 지표를 구입하지 마십시오. 실제 계정에서
Gann Swing Structure
Kirill Borovskii
5 (1)
This indicator is based on the mathematics of the great trader W.D. Ganna. With its help, you can easily find strong levels by analyzing swings to find the optimal entry point. The indicator works on all instruments and all timeframes. The indicator is fully manual and has control buttons. All you need to do is press the NEW button, a segment will appear, which you can place on any movement, swing or even 1 candle that you want to analyze. By placing the segment, press the OK button. A grid (th
Gann Zone Pro
Kirill Borovskii
This indicator identifies and displays zones, as it were areas of strength, where the price will unfold. The indicator can work on any chart, any instrument, at any timeframe. The indicator has two modes. The indicator is equipped with a control panel with buttons for convenience and split into two modes. Manual mode: To work with manual mode, you need to press the NEW button, a segment will appear. This segment is stretched over the movement and the LVL button is pressed. The level is displayed
Full Forex Market View Dashboard
Opengates Success International
5 (2)
전체 외환 시장 보기 대시보드 표시기 이것은 거래자에게 시장에서 일어나는 일에 대한 전체 보기를 제공하기 위해 만들어진 사용자 지정 지표입니다. 실시간 데이터를 사용하여 시장에 액세스하고 성공적인 거래에 필요한 모든 정보를 표시합니다. 설치: 이 지표를 창 차트에 첨부하기 전에 MT4의 Market Watch 패널로 이동하여 필요하지 않거나 거래하지 않는 모든 통화 쌍을 숨기고 나머지는 그대로 두십시오. 그 이유는 FFMV 대시보드가 MT4의 Market Watch에 나타나는 모든 통화 쌍을 표시하기 때문입니다. 최대 30개 이하의 통화 쌍을 표시할 수 있습니다. MT4의 Market Watch에서 그 이상이면 FFMV 대시보드의 글꼴과 이미지가 흐려지고 변형됩니다! 제대로 표시되지 않습니다. 용법:      솔로 트레이딩      바구니 거래의 경우(방법에 대한 스크린샷 참조)      다중 주문 거래에도 사용할 수 있습니다.      자신의 거래
IA Trendx3 PRO
Marco Aurelio Santos Costa
What if God Created a Trade System? No miracles... Just see how mathematics can be effective in the market. We managed to combine technical analysis / price action into indicators, creating the best setup for trading, be it in Forex, Indices, or stocks. It took us 2 years to create something that really works, and now it's time for you to discover it. TrendX3 is a revolution in trend analysis. Based on advanced algorithms and real-time data, it provides valuable insights so that you can make inf
Ferox Breakout
Tat Dat Nguyen
The breakout algorithm is a technique based on price, price features, to shape a breakout strategy. The strategy in this indicator will not be redrawn (none-repaint indicator), it is suitable for short or long term traders In the screenshot is the EURUSD pair, these currency pairs, commodities or stocks, it have similar strength *Non-Repainting (not redrawn) *For Metatrader4 Only *Great For Scalping *Great For Swing Trading *Arrow Entry, Green is Long, Red is Short *Works On Any Timeframe *Work
"Dragon's Tail" is an integrated trading system, not just an indicator. This system analyzes each candle on a minute-by-minute basis, which is particularly effective in high market volatility conditions. The "Dragon's Tail" system identifies key market moments referred to as "bull and bear battles". Based on these "battles", the system gives trade direction recommendations. In the case of an arrow appearing on the chart, this signals the possibility of opening two trades in the indicated directi
SMCpro VIP MT4  Original Price  $620   ---  Currently Price 20% OFF ( for unlimited use )   BONUS  AUX VIP Club 2024 : Include  EA Airbag  and  Load Data History  to enhance the performance of this tool to its maximum potential  Click Here to Download Files   ( for users only )   Hello World! Introducing.. SMCpro VIP tool and Indicator for MetaTrader 4, designed to revolutionize your trading experience with the ICT Smart Money Concept. This system is meticulously crafted to empower trad
Idea: RSI ( Relative Strength Index) and CCI ( Commodity Channel Index ) are powerfull to solved the market.  This indicator has Smoothed Algorithmic signal of RSI and CCI. So that, it separates the market into buy and sell zones, these areas are marked with arrows, red for downtrend, green for uptrend. This algorithm has the effect of predicting the next trend based on the historical trend, so users need to be cautious when the trend has gone many candles. Please visit screenshots
Fibonacci Retracements Pro
Savia Forex Software Solutions
Fibonacci Retracements Pro The Fibonacci Retracements Pro is a powerful yet easy to use indicator. It automatically plots all the important Fibonacci retracement and extension levels for you. FRP is dynamic powerful and seamlessly adjusts to whatever timeframe you are analyzing. Fibonacci Retracement Pro is optimized for ALL timeframes and ALL Currency pairs, Indices, Commodities, and Cryptocurrency pairs. Trade with improved confidence and maximize your success rate. Benefits Dynamic and Power
Fnix l long position
Monique Ellen Miranda Dos Santos
지금 한국어로 번역하겠습니다: 금융 시장에서 장기 기회를 찾고 계신 투자자이신가요? 여러분에게 커스텀 장기 트렌드 인디케이터를 소개합니다. 이 인디케이터는 일일, 주간 및 월간 차트보다 긴 시간대에서 포지션을 거래하려는 트레이더를 위해 디자인되었습니다. 명확하고 정확한 신호로, 여러분은 정보에 기반한 결정을 내릴 수 있을 것입니다. 주요 기능: 장기 전략: 이 인디케이터는 장기 거래에 헌신된 투자자에게 완벽합니다. 추천 시간대: 최상의 결과를 얻기 위해 이 인디케이터를 일간보다 긴 시간대에서 사용하는 것을 추천합니다. 정확한 신호: 인디케이터에서 생성된 신호와 캔들스틱 종가를 기다려, 신중한 결정을 내리십시오. 대기 주문: 최적의 사용을 위해 바이 스톱 또는 셀 스톱과 같은 대기 주문을 사용하는 것을 고려하십시오. 적절한 로트 크기: 작은 잔고를 가진 계정은 효과적인 리스크 관리를 위해 0.01의 로트 크기를 사용할 수 있습니다. 추천 통화 쌍: 이 인디케이터에 적합한 통화 쌍으로는
Daotradingfx
Huynh Cong Chinh
제목: "Daotradingfx - 7년 경험을 토대로 한 웨이브 트레이딩을 위한 완벽한 열쇠" 외환 거래는 결코 쉽지 않지만, Daotradingfx 지표를 사용하면 웨이브 트레이딩에서 성공의 문을 열 수 있는 신뢰할 만한 파트너를 찾을 수 있습니다. 내 7년의 거래 경험을 기반으로 만들어진 이 지표는 도구뿐만 아니라 시장 이해와 거래의 편의성에 대한 포괄적인 캔버스입니다. Daotradingfx는 여러 시간 프레임을 활용하는 능력으로 두드러지며, 이는 시장 트렌드와 다양한 시각에서의 시장 움직임을 더 깊게 이해하는 데 도움이 되는 중요한 기능입니다. 여러 시간 프레임을 동시에 모니터링하면 더 정확한 거래 결정을 내릴 수 있으며 모든 전략에 대한 성공 가능성을 향상시킬 수 있습니다. Daotradingfx의 또 다른 중요한 장점은 여러 통화 쌍을 추적하는 유연성입니다. 이 다양성은 하나의 통화 쌍에만 초점을 맞추는 것뿐만 아니라 시장 관찰 범위를 확장하고 거래 기회를
Introducing the "Magic Trades" for MetaTrader 4 – your ultimate tool for precision trading in dynamic markets. This innovative indicator revolutionizes the way you perceive market trends by harnessing the power of advanced analysis to detect subtle changes in character, paving the way for optimal trading opportunities. The Magic Trades Indicator is designed to empower traders with insightful entry points and well-defined risk management levels. Through its sophisticated algorithm, this indica
Oni Scalper
Goh Cheng Wai
5 (2)
Dear Onis, This Indicator is used for   GBPUSD, US30 and GOLD on 1-Min Chart . For US30 , Depending on your broker, Minimum Lot Size will differ from 0.01 to 1.0 lots. My Current Account is trading at 1.0 lots at $1 per point . Please check with your Broker what's the Margin Required for your Minimum lot sizes before you trade on your Real account. I have Forward Tested the indicator for around 6 months before releasing it to the public. ( No Demo is available for the Indicator, Strategy
Clidro FX
Mahmood Abdur Rafey Siddiqui
Clidro FX is a complete trading system designed and developed by Auxrum Analytics targeting the EURUSD, USDJPY, and GBPUSD FX pairs. It is currently available to MetaTrader 4 users. The Clidro FX algorithm, along with the optimized money-management and order-management rules sets up the basis for excellent trading results consistently over an extended period of time. The fundamental premise of the system is that each FX pair displays its unique quantitative characteristics while oscillating thro
Intro to APAMI, PROfessional edition Trace exactly how far prices trend between two price levels with fractional pip precision, while qualifying price movement between the same price levels. Completely automate when trends change direction and volatility, without any lag .  This is possible because the Accurate Price Action Measurement Indicator (APAMI) actually does what no other indicator can:  measure price distance between two points and simultaneously qualify the price action that occurs
Lineverse Trendlines
Arkady Segal
5 (1)
Automatic, live & interactive picture of all trendlines. Assign push, email and sound alerts to the lines of your choice and be informed about price rollback, breakout, rollback after breakout, number of rollbacks, line expiration by double breakout. Correct, drag or delete the lines and interactively tune the line system. https://youtu.be/EJUo9pYiHFA . Chart examples https: //www.mql5.com/en/users/efficientforex Price Interaction Events All events are effective immediately and only after on
The indicator displays the probable ( Support and resistance ) levels. The indicator draws horizontal and trend levels of support and resistance. The indicator settings: Trends - the mode for displaying trend lines or horizontal lines of support and resistance Yes - display trend lines only No - display horizontal lines only UseResource - use the resources built into the indicator. Yes - use the ZigZag indicator from the resources of the product. No - use a custom ZigZag indicator. HistoryBar -
THE GRAFF III
Antonin Skaryd
The [GRAFF] III manual trading system is based on multiple MetaTrader (MT4) indicators. Together, the entire PACK of GRAFF III indicators makes an advanced trading tool. The system consists of over 20 different custom-built indicators which have been carefully selected and tested in the long term to produce strong and efficient trading signals. The particular indicators are based on different mathematical formulas, so the entire system is calibrated to remove false signals from its own indicator
This indicator allows you to see the strength of the trend on all timeframes. It can be used for all currency pairs. The indicator can be displayed in the form of a column (from left to right): status buy / sell / strong buy / strong sell, strength of the trend in percentage, pips last candle, body candle now, remaining time, and the timeframe of M1 to MN. Information contained below (from left to right): total trend percent, sell percent, buy percent.
You can fins our other products from link : https://www.mql5.com/en/users/drbastem/seller   Also, you can ask all your questins from email : haskayafx@gmail.com or mobile : +90 530 867 5076 or @MehmetBastem    on telegram application This indicator is used to determine the trend. Standard Osma indicator is used. It has the indicator warning system: beep, e-mail and has three types of alerts, including messages to mobile phone. It shows the best performance on the chart of 5 minutes. When the
You can fins our other products from link : https://www.mql5.com/en/users/drbastem/seller   Also, you can ask all your questins from email : haskayafx@gmail.com or mobile : +90 530 867 5076 or @MehmetBastem    on telegram application This indicator is used to determine the trend. Standard Three Moving Average and ADX indicators are used. It has the indicator warning system (audio, e-mail) and three types of alerts, including messages to mobile phone. It shows the best performance on M5. When
This indicator is used to determine the trend. Standard Three Moving Average and ADX indicators are used. It has the indicator warning system (audio, e-mail) and three types of alerts, including messages to mobile phone. It shows the best performance on M5. When the trend value reaches the value set, the warning system is activated. This indicator works only with Forex symbols. Inputs SoundAlarm = true - Sound Alert Sendmail=true - Send an e-mail in case of a buy or sell signal Sendnotificatio
You can fins our other products from link : https://www.mql5.com/en/users/drbastem/seller   Also, you can ask all your questins from email : haskayafx@gmail.com or mobile : +90 530 867 5076 or @MehmetBastem    on telegram application This indicator is used to determine the trend. Standard MACD indicator is used. It has the indicator warning system: beep, e-mail and has three types of alerts, including messages to mobile phone. It shows the best performance on the chart of 5 minutes. When the
Smooth price for Monarch MT4
Konstantin Gruzdev
3.67 (3)
The Smooth Price technical indicator is used for plotting a smoothed line as close to the price of the financial instrument as possible, and serves to eliminate its noise components. The indicator is part of the Monarch trading system, but here it is presented as an independent technical analysis tool. The indicator is based on the cluster digital filter , which, unlike the ClusterSMA , is applied directly to the price time series. Smooth Price does not redraw (except the very last, zero bar) an
제작자의 제품 더 보기
The indicator displays 4 current levels between which the price is located. The levels are calculated based on the range of the previous day. The number and value of levels is arbitrary and expressed as a percentage. The position of the levels is calculated from the minimum of the previous day (an example can be found in the description of the parameters). It is advisable to place the levels in the settings line in order, nevertheless, the indicator will sort them by itself and if levels are fou
Displays the readings of the Moving Average indicator on the older timeframe. Wishes for other types of Moving Average are accepted (however, the possibility of implementation depends on the type of algorithm). It doesn't make sense to apply it to the current timeframe - there are free indicators for this. Does not redraw the readings starting from the first bar. It is very important to have and match the history of the timeframes on which it is installed and set in the settings. A simple built-
The next version of the indicator based on the range of previous day. Considers a difference of time zones. By default works the time zone of the broker. Can work on time zones: Greenwich, broker or local.  It can be applied only on timeframe from H1 below. If the day range of new day is lower minimum, then minimum is transferred from ranges of previous day symmetrically concerning the line of closing previous day (optionally, look Input parameters ). Screenshot 1: operation of the
In indicators the positive scale often unreasonably is accepted though in fact they are the symmetric. Such property has also standard RSI. The presented indicator works in the scale, symmetric concerning zero, but at the same time completely repeats an original form. In this indicator important levels 20 and -20. It is very convenient at its use in automatic trade as application of one threshold by optimization excludes overoptimization. Besides, the algorithm of calculation of the indi
ZigZagHistory
Aleksandr Martynov
The indicator was developed with one purpose - adequate processing on stories and the maximum approach to the original (it was required for development of more difficult indicator and use in the expert). I think, everything who tried to get history from the original indicator understood that in it there is information only on extrema and nothing more. It is not sure that similar does not exist, but mine is found on other than original to an algorithm: - for one pass (programmers will understand)
The indicator is constructed on the basis of ZigZagHistory ( https://www.mql5.com/ru/market/product/37376 ). At the same time calculated on the current timeframe and on the specified high. The history of the high timeframe is displayed by hollow squares. The history of a current timeframe is displayed by rhombuses. Colors and the sizes of signs can be adjusted. Attention!  The Price noise parameter - has significant effect on formation of extrema. Parameters: High TimeFrame (HTF) - the high ti
This indicator is based on the previous option ( https://www.mql5.com/ru/market/product/37376 ) and includes all completions at the time of creation. Availability of additional data allows to understand more deeply the principle of work as this indicator and original. Points on extrema of bars show history of a portrayal of extrema as before. Levels of a reverse show as far as the price for formation of a new shoulder has to deviate. The Price noise parameter has a special impact (the name "devi
ZigZag Minimal
Aleksandr Martynov
The indicator is made on the basis of the algorithm put in the ZigZag History indicator ( https://www.mql5.com/ru/market/product/37376/ ). In the real option there are no additional buffers and an opportunity to trace work history. It causes the minimum involvement of random access memory, however productivity practically does not improve. Attention!  The Price noise parameter - has significant effect on formation of extrema. Parameters: Depth  - is depth of search of a local extremum in bar
The RSI Symmetric indicator approximated by function of the known Buzzer indicator. Display for the high timeframe is provided. 2 types of signals are of interest: 1. Position of the RSI line concerning the approximated line 2. The trend direction of the approximated line  Indicator parameters: RSI TimeF rame - the worker  timeframe (it has to be equal or more than current); RSI Period - no comments; Buzzer Period is the period of approximation of the RSI Symmetric indicator; B
Индикатор отображает 4 текущих уровня между, которыми находится цена. Уровни вычисляются на основе диапазона предыдущей недели. Количество и значение уровней произвольное   и выражается в процентах . Положение уровней отсчитывается от минимума предыдущего дня (пример можно посмотреть в описании параметров). Целесообразно размещать уровни в строке настроек по порядку, тем не менее индикатор сам их отсортирует и если обнаружатся уровни отстоящие менее чем на 1% выдаст ошибку. Индикатор работает н
ZigZag Level
Aleksandr Martynov
One of the disadvantages of the ZigZag indicator when working with advisers is the need to find the latest extremes. For this purpose, various algorithms of history analysis in indicator buffers are used. However, the indicator itself knows these values and can therefore display them. To this target, the ZigZag Minimum indicator ( https://www.mql5.com/ru/market/product/37975 ) has been refined. The zero buffer stores the value of the last maximum. The first buffer stores the value of the last m
ZigZag Mini Extra
Aleksandr Martynov
Not a logical continuation of the ZigZag indicator series is an indicator cut to an absolute minimum. An important property of this indicator is that it will never redraw the value of a completed bar. Based on previous indicator algorithms, e.g. ( https://www.mql5.com/ru/market/product/37975 ). Parameters: Depth  - is depth of search of a local extremum in bars; On minute calc  - is switching ON/OFF of calculation on minute bar (it is switched off - calculation on each tic).
The proposed indicator is based on the ZigZag Mini Extra indicator ( https://www.mql5.com/ru/market/product/42632 ). Unlike the prototype can be built at the price of Close or High-Low with the established timeframe. The prices of the current timeframe will be used when calculating the indicator on the highest timeframes at Close price, . Indicator parameters: ZigZag TimeFrame = PERIOD_CURRENT - operating time frame (must be equal or more than current timeframe); Depth = 12 - depth of
The ZigZag indicator is based on the RSI indicator. This makes it possible to identify significant extremes. Different calculation options are provided: - RSI indicator at Close or Hi-Low prices (1 and 2 buffers respectively in OnClose mode - the first buffer, in Hi-Low mode the first buffer at High price, the second buffer at Low); - ZigZag indicator by period (standard) or minimal deviation. (The ZigZag indicator values are always in zero buffer.) If you use a higher timeframe, make s
Trend Ranger
Aleksandr Martynov
The indicator does not use predictions. It merely shows what range the price is in. However, it does a good job with chart markings and mapping current trade preferences. It can act as an independent tool of medium and long-term urgent trade, and together with oscillators it is possible to build a good scalper system. Important! The signal is 0 bar - does not repaint! Indicator parameters: Zone Range (Pips) - size of zone in pips excluding the number of characters; Line or Histogram Wid
Based on the course records of Yuri Antonov (academyfx.ru) YouTube Channel: https://www.youtube.com/playlist? list=PLj3wALUOwoZ9kdacS09K9bjD1zulR _ HJh The indicator is intended for people who know the strategy but find it difficult to mark the graph.  Approaches the new Intensive MD system. The default parameters are set as of mid-2019. For a 5-digit EURUSD account! You can work on the 4-character after the parameters are recalculated. The current parameters can be found on the autho
Fractal with levels
Aleksandr Martynov
Indicator of fractals with adjustable indents. Designed according to an original simplified algorithm for use in EA. The main ones in the indicator are lines showing the levels of the current fractals, which allows you to read the values ​ ​ of the last fractal in one operation. It works on a closed bar, so it does not redraw and does not load the terminal with calculations. It should be understood that the indicator is late with the detection of the fractal by the number of bars on the r
Trend Ranger XO
Aleksandr Martynov
Индикатор отображает на графике другой популярный индикатор XO, представленный на рисунке в подвале. Важно! Сигнальным является 0 бар - не перекрашивается!  Параметры индикатора: Zone Range (Pips)   - размер зоны в пипсах без учета количества знаков; Line or Histogram Width   - ширина линий или гистограммы;    Zone Draw Type  - способ отрисовки зон: в виде гистограммы или линий на графике; Up Zone Color   -  цвет зоны BUY; Down Zone Color   - цвет зоны SELL; AlertsMessage   - включение вывода со
Сканер Heiken Ashi на четырех таймфреймах. Индикатор не рисует и не подсматривает историю. Модифицированный расчет повышает чувствительность! Возможно отключить модифицированный расчет для каждого таймфрейма отдельно, а также отключить анализ 4 таймфрейма. В нулевом (скрытом) буфере хранится информация о совпадении трендов на всех рабочих ТФ. Эта опция упрощает анализ и чтение из советников. Требователен к истории. Наиболее простое отсутствие данных по старшим ТФ проверяется при загрузке. Осно
Indicator from the Real Non RePaint MultiTimeFrame (Real NRP MTF)  series. Specially designed to display the RSI standard indicator reading from the Senior TimeFrame (TF) to the Junior. The indicator differs from the standard scale - symmetrical relative to 0. Add 50.0 to the readings to get the standard values. Does not look into the future for history at the senior TF. DOES NOT DIFFER from the standard real-time indicator readings (including bias), but shows the actual indicator readings on th
Indicator from the Real Non RePaint MultiTimeFrame   (Real NRP MTF)  series. The indicator is based on the standard one. Does not redraw in any mode: the last closed candle is a rock. Does not look into the future for history at the senior TF. The formula for sensitivity enhancement has been changed (disabled in settings). It works on the current TF or older ones with the display on the current one. The last closed Heiken Ashi candle of the current timeframe before the opening of the new senior
Indicator from the  Real Non RePaint MultiTimeFrame  (Real NRP MTF) series. Specially designed to display the standard Stohastic indicator from the senior timeframe (TF) to the junior. The indicator differs from the standard scale - symmetrical relative to 0. Add 50.0 to the readings to get the standard values. Does not look into the future for history at the senior TF. DOES NOT DIFFER from the real-time standard indicator (offset-based), but shows the actual indicator counts on the history
Dynamic Fibo Level
Aleksandr Martynov
Индикатор отображает динамические разворотные уровни по шкале Фибоначи. Основан на индикаторе ЗИГ-ЗАГ, который управляется периодом и минимальной глубиной для переключения тренда. Если указать глубину переключения равной 0, то она не будет участвовать в расчетах индикатора. Используется неперерисовывающий сформированные вершины индикатор - возможны несоответствия экстремумов со стандартным индикатором ЗИГ-ЗАГ. Расчитывается на закрытом баре, действие зоны отображается для текущего бара. Основные
필터:
리뷰 없음
리뷰 답변
버전 1.1 2021.10.26
Снято ограничение на максимальный используемый таймфрейм.
Однако, таймфреймы в настройках должны идти в порядке возрастания или быть равными предыдущему.
При нарушении порядка следования таймфреймов индикатор самостоятельно их изменит и оповестит всплывающим окном.