• 미리보기
  • 리뷰
  • 코멘트

Pivot pro with Alert

Pivot Pro with Alert

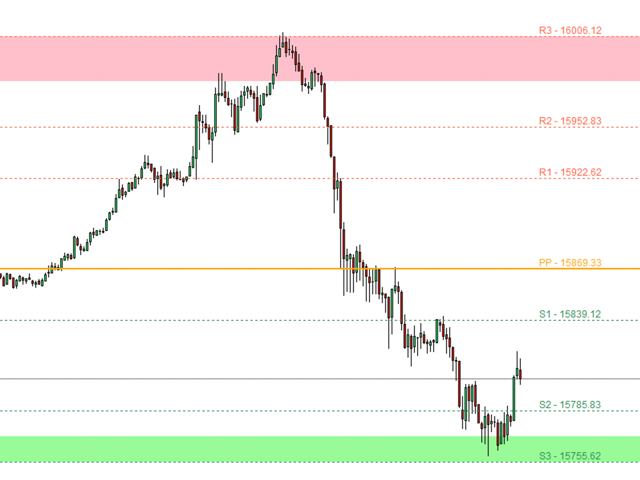
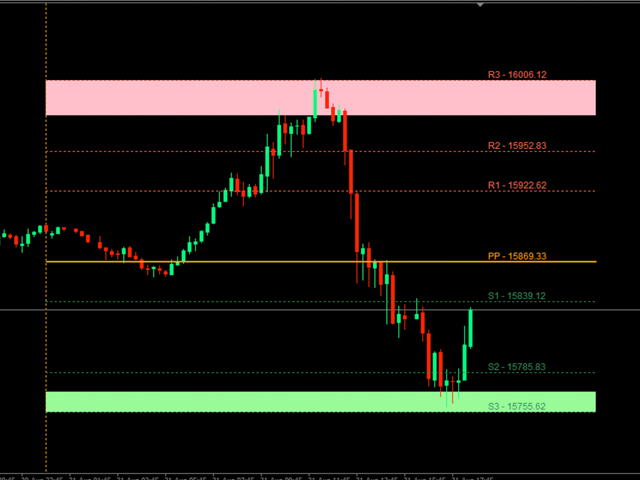
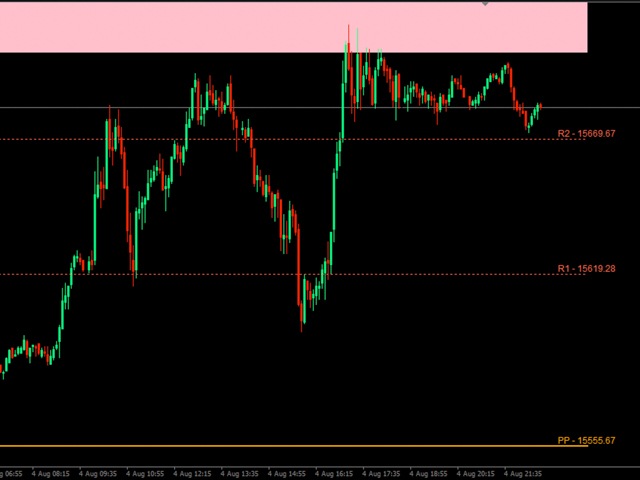
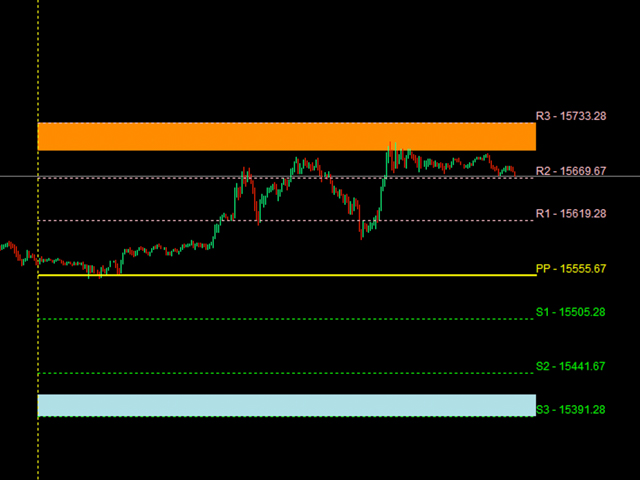
Pivot points offer very good brands that are often run over by price. At these brands, reactions of the price arise. They can be used excellently as target zones, or as entrances.


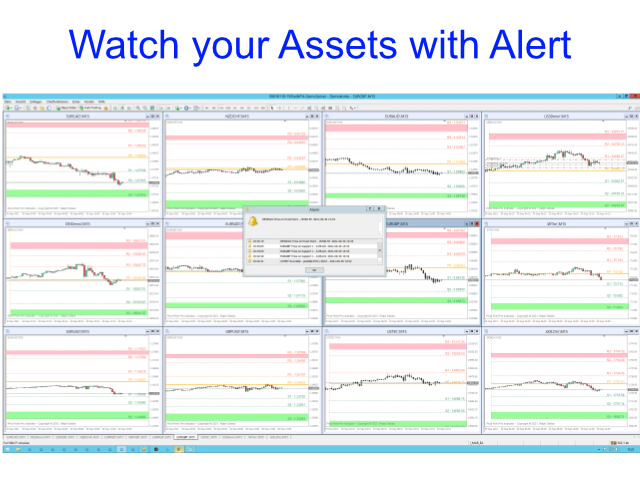
The alarm function allows several charts to be opened and it is very easy to find profitable entries.

No missed entries through notification on the mobile phone. You can watch the market with Alerts.

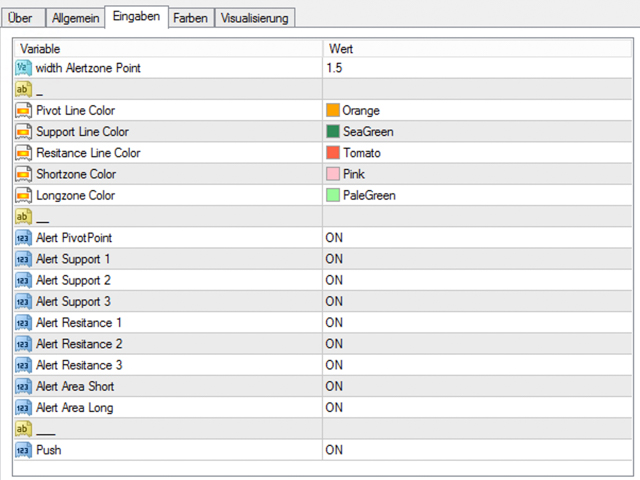
These settings can be changed:

  • Width of the alarm zone
  • Colors of all pivot lines
  • Colors of the reaction zones
  • Alarms for each individual pivot point or all pivot points
  • Push notification
추천 제품
Simple supply and demand indicator which should help identify and visualize S&D zones. Settings: Color for supply zones, color for demand zones - default colors are set for dark (black) background. Number of how much zones should be created above and below current price - value "3" means there will be 3 zones above current price and 3 zones below current price. Principle: When price creates "V", reversal zone is registered. Rectangle filled based on zone type (supply / demand) is drawn if pri
Deep River AM
Andriy Matviyevs'kyy
The presented indicator is the author's implementation of the idea embodied in the Alligator indicator, which has already become a classic. The proposed product allows you to visually demonstrate the direction of price movement, temporary price rollbacks and zones of multidirectional price movement. Namely: The indicator lines go up and diverge from each other - a strong bullish trend; The indicator lines go down and diverge from each other - a strong bearish trend; The indicator lines go up but
FREE
Classic Fractals indicator for MT4, with additional Trendlines connecting the latest couples of fractals ( fractals are showing highest high, and lowest low on each period) Rules for trendlines: -if new top fractal is below the last one = new resistance line -if new bot fractal is above the last one = new support line -Trendlines can be hidden -Fractals can be hidden Fractal Period = can be both even or uneven number, as it is setting for half (one side) of the bars sequence
Fibonacci Calculation Indicator
Richard Louis Pastor
4 (3)
Basic Fibonacci Calculation Indicator  shows Trend, Stoploss, Profit 1,2,3, will show you your daily Highs and your Daily Lows , it will also show you where it expects the price to move to.  best time frame is H1 or higher .  For  a better system that also includes my Non-repaint Indicator please check out my paid Fibo Indicator  https://www.mql5.com/en/market/product/82323
FREE
UPD1 Fibo Levels
Vitaliy Kuznetsov
5 (3)
표시기는 지정된 수의 양초를 분석하고 고가를 기준으로 피보나치 수준을 표시합니다. 레벨이 재정렬되기 때문에 범위의 오른쪽에 관심이 있습니다. 가격은 레벨을 자화하고 터치에 반응합니다. 이 도구를 사용하여 수정 후 추세 진입점을 찾습니다. 왼쪽에서 레벨이 완벽하게 상승한 것을 보면 극한 지점에서 움직임의 끝을 발견했다고 가정할 수 있습니다. 모든 선은 버퍼 또는 개체를 통해 그려집니다(선택 사항). 입력 매개변수. Bars Count - 계산 범위. Visual Button - 버튼 표시(활성화/비활성화). Corner - 버튼 앵커 각도. X indent - 픽셀의 수평 패딩. Y indent - 픽셀의 수직 패딩. Label Visual - 디스플레이 레벨 레이블. Label Font Size   - 글꼴 크기. Label Shift Bars   - 비문의 들여쓰기(촛불의 수). Label Tooltip   - 레벨 위의 커서 아래에 텍스트 표시. Draw Lin
FREE
Fibonacci SR Indicator
Martin Eshleman
3 (2)
Fibonacci SR Indicator This indicator creates support and resistance lines. This indicator is based on Fibonacci Retracement and Extension levels. It will consider many combinations of the Fibonacci levels and draw support/resistance lines based on these. This indicator uses tops and bottoms drawn by the ZigZag indicator in its calculations. The ZigZag can also be drawn on the chart, if necessary. The indicator considers many combinations of past reversal points and Fibonacci ratio levels, and
FREE
Auto AndrewFork
Noor Ghani Rahman
1 (1)
Auto Pitchfork Indicator The indicator calculate the Pitch fork for the previous Day (Selectable) with multiple Support and Resistance lines from the Median price which acts as Magnet for the Price that if price touch the above warning (1) or below warning (1) lines and not cross up or down then there is maximum possibilities that it will return to the Median Line, and thus maintain the Price Action in Cyclic Pattern to the Market Move. You are able to select how many warning lines you want to k
Fibonacci Retracement object is an object that has been provided by metatrader 4 platform. But  Fibonacci Retracement  object doesn't automated adjust the chart. You have to put and manage it manually to the chart. Because of that, this indicator was created. If you like using filbonacci retracement indicator, highly recommended to use Automated Fibonacci Retracement Indicator if you want to get better result in here: https://www.mql5.com/en/market/product/95515 LT Automated Fibonacci Retrace
FREE
ZigZag Fibo Retracement
Dang Khoa Nguyen
5 (1)
ZigZag Fibo Retracement Indicator Optimize Your Trading Strategy! Are you seeking to optimize your trading strategy in the financial markets? Explore the unique features of the ZigZag Fibo Retracement Indicator, a powerful tool designed to help you identify potential support and resistance levels based on the combination of ZigZag patterns and Fibonacci ratios. Integration of ZigZag Patterns and Fibonacci: The ZigZag Fibo Retracement Indicator combines the effectiveness of ZigZag patterns, helpi
FREE
Free automatic fibonacci
Tonny Obare
4.65 (62)
Free automatic Fibonacci is an indicator that automatically plots a Fibonacci retracement based on the number of bars you select on the BarsToScan setting in the indicator. The Fibonacci is automatically updated in real time as new highest and lowest values appears amongst the selected bars. You can select which level values to be displayed in the indicator settings. You can also select the color of the levels thus enabling the trader to be able to attach the indicator several times with differe
FREE
Trend Catcher with Alert
Issam Kassas
4.8 (49)
트렌드 캐쳐: 알림 인디케이터와 함께 하는 트렌드 캐쳐 전략은 시장 트렌드와 잠재적인 진입 및 체크 포인트를 식별하는 데 도움이 되는 다목적 기술 분석 도구입니다. 이는 시장 상황에 적응하여 트렌드 방향을 명확하게 시각적으로 표현하는 동적 트렌드 캐쳐 전략을 제공합니다. 트레이더는 선호도와 위험 허용도에 맞게 매개변수를 사용자 정의할 수 있습니다. 이 인디케이터는 트렌드 식별을 지원하고 잠재적인 반전을 신호로 제공하며 트레일링 스탑 메커니즘으로 작동하며 실시간 경고를 제공하여 신속한 시장 대응을 돕습니다. 특징: - 트렌드 식별: 상승 트렌드와 하락 트렌드를 신호합니다. - 트렌드 반전: 양봉 색상이 상승에서 하락으로 변경되거나 그 반대의 경우 잠재적인 반전을 경고합니다. - 실시간 경고: 새로운 트렌드 식별을 위한 경고를 생성합니다. 추천사항: - 통화 및 페어: EURUSD, AUDUSD, XAUUSD 등... - 시간 프레임: H1. - 계정 유형: 모든 E
FREE
VJ Pivot Levels
Vijayaratna Kumar Boda
4.4 (5)
Introduction: Whatever trading method you use, it is important to know the Pivot levels to take the key attention for your entries & exits. This indicator has been made using the standard classic formula for Auto drawing the Pivot levels. Also based on the previous day trading range, the probable expected today trading range has been highlighted in a different color for your reference. Output of the Indicator: This Indicator gives the Pivot level Different resistance Levels Different Support l
AutoPivot
Hafis Mohamed Yacine
This indicator will draw monthly, weekly, and daily pivot. Pivot line will be calculated automatically again when the period ends. Auto Pivot Metatrader 4 Indicator The Auto Pivot indicator for Metatrader 4 automatically updates the pivot point (PP), support (S1,S2,S3) and resistance levels (r1,r2,r3) every day. Price above the pivot point means positive while price below the pivot point means negative. S3 indicates extremely oversold while price above resistance r3 means extremely overbought.
The PUA MultiType Pivot indicator is built on the daily chart of the previous day. The PUA MultiType Pivot indicator is one of the most popular tools in technical analysis, used by traders to identify potential reversal points in financial markets. This indicator constructs three types of Pivot points: Classic, Fibonacci, and Camarilla, each offering its unique approach to market analysis. The advantages of this indicator include: Simplicity and Clarity PUA MultiType Pivot provides clearly defi
Automatic fibonacci with alerts is an indicator that automatically plots a fibonacci retracement based on the number of bars you select on the BarsToScan setting in the indicator. The fibonacci is automatically updated in real time as new highest and lowest values appear amongst the selected bars. You can select which level values to be displayed in the indicator settings. You can also select the color of the levels thus enabling the trader to be able to attach the indicator several times with d
MultiFiboDynamicMT4
Andrey Spiridonov
3.5 (2)
MultiFiboDynamicMT4 is a powerful, professional indicator for estimating the most important support and resistance levels. The main advantage is that it plots the Fibonacci levels at all timeframes simultaneously, which allows the trader to see the full picture of the possible price movement of the trading instrument! Advantages of the indicator The indicator is perfect for scalping and trading binary options. Suitable for beginners and experienced traders. Works on all timeframes. Works on an
FREE
Fibonacci retracements can be used to draw support lines, identify resistance levels, place stop-loss orders and set target prices. The Advanced Automatic Fibonacci retracements draws automatically all the levels. You have a lot of options to choose. For exemple you can use the tracements of another time frame (MTF) in the current chart, you can also choose between the closest level or less close to draw the retracements. You can also add 2 levels of your choice. You can add levels extensions o
This powerful tool combines the Zigzag algorithm with Fibonacci retracement levels, enhancing your trading experience in the MetaTrader 4 (MT4) platform. Zigzag with Fibo Indicator Time Frame :- 1H and above The   Zigzag with Fibo Indicator   is designed to identify trend direction and provide precise entry and exit points for forex trading. Here’s what makes it stand out: Zigzag Algorithm Integration : The indicator utilizes the Zigzag algorithm, which helps filter out market noise and highligh
FREE
DMS Fibo
Diogo Mitsunaga Dos Santos
Fibonacci retracements are trend lines drawn between two significant points, usually between absolute lows and absolute highs, plotted on a chart. Intersecting horizontal lines are placed at the Fibonacci levels. Fibonacci retracements are useful tools that help traders identify support and resistance levels. With the information gathered, they can place orders, identify stop-loss levels, and set price targets. Although useful, traders often use other indicators to make more accurate assessments
Absolute Bands
Aleksey Ivanov
4.5 (4)
Principles of construction of the indicator.               The Absolute Bands (AB) indicator is reminiscent of the Bollinger Bands indicator with its appearance and functions, but only more effective for trading due to the significantly smaller number of false signals issued to them. This effectiveness of the Absolute Bands indicator is due to its robust nature.               In the Bollinger Bands indicator, on both sides of the moving average - Ma, there are lines spaced from Ma by the standa
FREE
The indicator detects and displays Shark harmonic pattern (see the screenshot). The pattern is plotted by the extreme values of the ZigZag indicator (included in the resources, no need to install). After detecting the pattern, the indicator notifies of that by a pop-up window, a mobile notification and an email. The indicator highlights the process of the pattern formation and not just the complete pattern. In the former case, it is displayed in the contour triangles. After the pattern is comple
VaviStar is an indicator based on trend retracements determined by ZigZag segments. It is theorized, and statistics confirm, that stocks react to certain retracement levels. Many use Fibonacci retracement levels (23.6%, 38.2%, 61.8%). It is assumed that once the price goes beyond the 61.8% retracement, we can already speak of a trend reversal. This indicator allows you to comfortably chart a segment of the ZigZag with the relative operating levels chosen. With a reversal mindset , you can use it
"The Squeeze indicator attempts to identify periods of consolidation in a market. In general the market is either in a period of quiet consolidation or vertical price discovery. By identifying these calm periods, we have a better opportunity of getting into trades with the potential for larger moves. Once a market enters into a "squeeze," we watch the overall market momentum to help forecast the market direction and await a release of market energy." The StdATR Squeeze Channel combines standard
MACDivergence MTF
Pavel Zamoshnikov
4.29 (7)
Advanced ideas of the popular MACD indicator: It detects and displays classic and reverse divergences (three methods of detecting divergences). It uses different color to highlight an uptrend and a downtrend. Two methods of determining a trend: а) MACD crosses the 0 level (classic signal); б) MACD crosses its own average (early signal). This is a multi-timeframe indicator: it can display MACD data from other timeframes. Two methods of drawing: classic histogram and line. It generates sound and v
Based on MACD indicator waves with standard parameters Applies Fibonacci levels to the last two MACD waves, positive and negative respectively, if at the moment the MACD indicator runs out of negative Wave - the color is green, if at the moment the MACD indicator runs out of positive Wave - the color is red. The Wave termination criterion is two ticks with a different MACD sign. Applies trend lines on the last four MACD Waves. Works well with the expert Figures MACD   https://www.mql5.com/ru/mar
The price is moving between two curve tunnel lines in a trend. The two lines of a tunnel represent support and resistance. In an uptrend, for instance, a trade might be entered at the support of the trend line (shown by the red line in the chart) and exited at resistance of the upper tunnel line (shown by the blue line). Tunnel show trend direction for any timeframe (if you have enough bars on the chart for higher timeframes). Trend, or price tunnel, can be up, down or sideways. If the current p
FiboRec
Alfred Kamal
This indicator depends on Fibonacci lines but there is a secret lines i used them, by using FiboRec indicator you will be able to know a lot of important information in the market such as: Features You can avoid entry during market turbulence. You can enter orders in general trend only. You will know if the trend is strong or weak. Signal Types and Frame used You can use this indicator just on H1 frame. Enter buy order in case Candle break out the square area and closed over it, at least 20
BeST_ Classic Pivot Points is an MT4 Indicator that is based on the widely known and definitely classic Pivot Point of a market prices activity. A pivot point is calculated as an average of significant prices (high,low,close) from the performance of a market in the prior trading period. If the market in the following period trades above the pivot point it is usually evaluated as a bullish sentiment, whereas trading below the pivot point is seen as bearish. A pivot point and the associated suppo
FREE
Fibo Bands
Igor Semyonov
5 (1)
Fibo Bands is an innovative indicator and an analyzer for trading in the current trend direction. The indicator builds a Fibonacci channel (bands), and consists of a trend line (middle line), channel bands, colored bars and reference information. After completion of the current bar, the trend line, the channel and the color of the bar are not redrawn. However, the channel width can be changed after a reset or restart of the indicator depending on volatility. The channel is built in accordance wi
Wolfe Wave Scanner MT4
Reza Aghajanpour
4.6 (10)
**  All Symbols  x  All Timeframes  scan just by pressing scanner button ** *** Contact me after the purchase to send you instructions and add you in "Wolfe Wave Scanner group" for sharing or seeing experiences with other users. Introduction: A Wolfe Wave is created with five-wave patterns in price. It shows supply and demand and a fight towards a balance price. T hese waves of price actions can help traders identify the boundaries of   the trend . Also  It helps forecast how the price will move
이 제품의 구매자들이 또한 구매함
Gann Made Easy
Oleg Rodin
4.92 (60)
Gann Made Easy 는 mr.의 이론을 사용하여 최고의 거래 원칙을 기반으로 하는 전문적이고 사용하기 쉬운 Forex 거래 시스템입니다. W.D. 간. 이 표시기는 Stop Loss 및 Take Profit Levels를 포함하여 정확한 BUY 및 SELL 신호를 제공합니다. PUSH 알림을 사용하여 이동 중에도 거래할 수 있습니다. 구매 후 연락주세요! 내 거래 팁과 훌륭한 보너스 지표를 무료로 공유하겠습니다! 아마도 Gann 거래 방법에 대해 이미 여러 번 들었을 것입니다. 일반적으로 Gann의 이론은 초보자 거래자뿐만 아니라 이미 거래 경험이 있는 사람들에게도 매우 복잡한 것입니다. Gann의 거래 방식은 이론적으로 적용하기 쉽지 않기 때문입니다. 나는 그 지식을 연마하고 Forex 지표에 최고의 원칙을 적용하기 위해 몇 년을 보냈습니다. 표시기는 적용하기가 매우 쉽습니다. 차트에 첨부하고 간단한 거래 권장 사항을 따르기만 하면 됩니다. 지표는 지속적으로 시장 분석 작업
맞춤형 MT4 지표로 성공적인 외환 거래에 대한 비밀을 발견하십시오! 외환 시장에서 성공을 달성하고 위험을 최소화하면서 일관되게 이익을 얻는 방법을 궁금해 한 적이 있습니까? 여기에 당신이 찾고 있던 답이 있습니다! 거래에 대한 귀하의 접근 방식을 혁신 할 독점적 MT4 지표를 소개 할 수 있습니다. 독특한 다양성 우리의 지표는 Renko 및 Rangebar Candle Formations를 선호하는 사용자를 위해 특별히 설계되었습니다. 우리는 이러한 차트 유형이 많은 숙련 된 거래자들이 선호한다는 것을 이해하기 때문에 우리의 지표가 그들과 완벽하게 통합되어 비교할 수없는 시장 분석을 제공합니다. 명확한 추세 신호 복잡한 분석을 잊어 버리십시오! 우리의 지표는 생생한 색상과 명확한 점 구조를 사용하여 시장 동향을 명확하게 나타냅니다. 빨간색과 파란색 점은 가격 이동 방향에 대해 의심의 여지가 없어 거래에서 빠른 의사 결정을 할 수 있습니다. HH/HL HL/LL
Atomic Analyst
Issam Kassas
5 (3)
우선적으로 언급할 점은이 거래 지표가 다시 그리지 않고 지연되지 않으며 이를 통해 수동 및 로봇 거래 모두에 이상적이라는 점입니다. 사용자 매뉴얼: 설정, 입력 및 전략. Atomic Analyst는 가격의 강도와 모멘텀을 활용하여 시장에서 더 나은 이점을 찾는 PA Price Action Indicator입니다. 고급 필터를 장착하여 잡음과 거짓 신호를 제거하고 거래 잠재력을 높이는 데 도움이 됩니다. 복잡한 지표의 다중 레이어를 사용하여 Atomic Analyst는 차트를 스캔하고 복잡한 수학적 계산을 간단한 신호와 색상으로 변환하여 초보 트레이더가 이해하고 일관된 거래 결정을 내릴 수 있도록합니다. "Atomic Analyst"는 새로운 및 경험이 풍부한 트레이더를위한 종합적인 거래 솔루션입니다. 프리미엄 지표와 최고 수준의 기능을 하나의 거래 전략에 결합하여 모든 종류의 트레이더에 대한 다재다능한 선택지가되었습니다. 인트라데이 거래 및 스캘핑 전략 : 빠르고 정확한
Advanced Currency Strength28 Indicator
Bernhard Schweigert
4.9 (663)
현재 26% 할인 초보자 또는 전문가 트레이더를 위한 최고의 솔루션! 이 지표는 우리가 독점 기능과 새로운 공식을 통합했기 때문에 독특하고 고품질이며 저렴한 거래 도구입니다. 단 하나의 차트로 28 Forex 쌍의 통화 강도를 읽을 수 있습니다! 새로운 추세 또는 스캘핑 기회의 정확한 트리거 포인트를 정확히 찾아낼 수 있기 때문에 거래가 어떻게 개선될지 상상해 보십시오. 사용 설명서: 여기를 클릭  https://www.mql5.com/en/blogs/post/697384 그것이 첫 번째, 원본입니다! 쓸모없는 지망생 클론을 사지 마십시오. 더 스페셜  강력한 통화 모멘텀을 보여주는 하위 창의 화살표 GAP가 거래를 안내합니다! 기본 또는 호가 통화가 과매도/과매도 영역(외부 시장 피보나치 수준)에 있을 때 개별 차트의 기본 창에 경고 표시가 나타납니다. 통화 강도가 외부 범위에서 떨어질 때 풀백/반전 경고. 교차 패턴의 특별 경고 추세를 빠르게 볼 수 있는
Advanced Supply Demand
Bernhard Schweigert
4.92 (310)
현재 33% 할인! 초보자나 전문 트레이더를 위한 최고의 솔루션! 이 보조지표는 우리가 다수의 독창적 기능과 새로운 공식을 통합한 독특하고 고품질이며 저렴한 거래 도구입니다. 이 업데이트를 통해 이중 시간대를 표시할 수 있습니다. 더 높은 TF를 표시할 수 있을 뿐만 아니라 차트 TF와 더 높은 TF 모두를 표시할 수 있습니다: 중첩 영역 표시. 모든 Supply Demand 트레이더들이 좋아할 것입니다. :) 중요한 정보 공개 Advanced Supply Demand의 잠재력을 극대화하려면 다음을 방문하십시오. https://www.mql5.com/ko/blogs/post/720245   진입 또는 목표의 명확한 트리거 포인트를 정확히 찾아냄으로 해서 거래가 어떻게 개선될지 상상해 보십시오. 새로운 알고리즘을 기반으로 매수자와 매도자 간의 잠재적인 불균형을 훨씬 더 쉽게 분간할 수 있습니다. 왜냐하면 가장 강한 공급영역과 가장 강한 수요 영역과 과거에 어떻게 진행 되었는지를(이
TPSpro RFI Levels
Roman Podpora
5 (13)
A key element in trading is zones or levels from which decisions to buy or sell a trading instrument are made. Despite attempts by major players to conceal their presence in the market, they inevitably leave traces. Our task was to learn how to identify these traces and interpret them correctly. Reversal First Impulse levels (RFI)   -  Version MT5                INSTRUCTIONS                 RUS                 ENG                                       R ecommended to use with an indicator   -  
Break and Retest
Mohamed Hassan
4.56 (9)
‍You can visually backtest Break & Retest to see how it behaved in the past!     Manual guide:   Click here $65  for only 1  copy left! Next price is $120 .  This Indicator only places quality trades when the market is really in your favor with a clear break and retest. Patience is key with this price action strategy! Recommended timeframes: M1 for Scalpers.  M15 for Intraday traders. H1 & H4 for Day traders. Other timeframes are also excellent! After many months of hard w
ON Trade Optuma Astro
Abdullah Alrai
5 (4)
물론입니다. 아래는 제공해주신 텍스트의 한국어 번역입니다: MT4용 천문학 지표 소개: 귀하의 최상급 하늘 트레이딩 동반자 트레이딩 경험을 천체의 높이로 끌어올리기 준비가 되셨나요? MT4용 천문학 지표를 소개합니다. 이 혁신적인 도구는 복잡한 알고리즘의 힘을 활용하여 탁월한 천문학적 통찰과 정밀한 계산을 제공합니다. 정보의 우주를 손에 담다: 천문학적 데이터의 보물함을 드러내는 포괄적인 패널을 살펴보세요. 행성의 지오/헬리오센트릭 좌표, 태양/지구 거리, 크기, 길이, 별자리, 황도 좌표 및 적도 좌표, 심지어 수평 좌표 등 각각이 정밀하게 계산되고 아름답게 제시됩니다. 지표에 의해 생성된 수직선은 시간 값에 해당하여 트레이딩 여정에 우주적인 시각을 부여합니다. 행성 라인과 관계: 수정 가능한 스케일과 각도로 차트를 장식하는 행성 라인의 마법을 경험해보세요. 직관적인 컨트롤 패널을 통해 각 행성의 라인의 가시성을 손쉽게 전환할 수 있습니다. 쥰션이나 섹스타일, 사분각, 삼분각, 트
Quantum Trend Sniper Indicator MT4
Bogdan Ion Puscasu
4.59 (39)
소개       Quantum Trend Sniper Indicator는   추세 반전을 식별하고 거래하는 방식을 변화시키는 획기적인 MQL5 지표입니다! 13년 이상의 거래 경험을 가진 숙련된 트레이더 팀이 개발한       Quantum Trend Sniper 표시기       매우 높은 정확도로 추세 반전을 식별하는 혁신적인 방법으로 거래 여정을 새로운 차원으로 끌어올리도록 설계되었습니다. ***Quantum Trend Sniper Indicator를 구입하면 Quantum Breakout Indicator를 무료로 받을 수 있습니다!*** Quantum Trend Sniper Indicator는 추세 반전을 식별하고 세 가지 이익실현 수준을 제안할 때 경고, 신호 화살표를 제공합니다. 초보자 거래자와 전문 거래자 모두에게 적합합니다. Quantum EA 채널:       여기를 클릭하세요 MT5 버전:       여기를 클릭하세요
우선적으로, 이 거래 도구는 전문적인 거래에 이상적인 비-다시 그리기 및 지연되지 않는 지표입니다.  온라인 강좌, 사용자 매뉴얼 및 데모. 스마트 가격 액션 컨셉트 인디케이터는 신규 및 경험 많은 트레이더 모두에게 매우 강력한 도구입니다. Inner Circle Trader Analysis 및 Smart Money Concepts Trading Strategies와 같은 고급 거래 아이디어를 결합하여 20가지 이상의 유용한 지표를 하나로 결합합니다. 이 인디케이터는 스마트 머니 컨셉트에 중점을 두어 대형 기관의 거래 방식을 제공하고 이동을 예측하는 데 도움을 줍니다.  특히 유동성 분석에 뛰어나 기관이 어떻게 거래하는지 이해하는 데 도움을 줍니다. 시장 트렌드를 예측하고 가격 변동을 신중하게 분석하는 데 탁월합니다. 귀하의 거래를 기관 전략에 맞추어 시장의 동향에 대해 더 정확한 예측을 할 수 있습니다. 이 인디케이터는 시장 구조를 분석하고 중요한 주문 블록을 식별하고 다양한
on free demo press zoom out button to see back.. cnt number is bar numbers.you can change up to 3000 related to chart bars numbers. minimum value is 500. there is g value set to 1.01. no need to change it. this indicator almost grail,no repaint and all pairs ,all timeframe indicator. there is red and blue histograms. if gold x sign comes on red histogram that is sell signal. if blue x sign comes on blue histogram that is buy signal. this indicator on thise version works all pairs.al timeframes
ON Trade Waves Patterns Harmonic Elliot Wolfe를 소개합니다. 이는 수동 및 자동 방법을 사용하여 다양한 시장 패턴을 감지하기 위해 개발된 고급 지표입니다. 다음은 그 작동 방식입니다: 조화적 패턴: 이 지표는 차트에 나타나는 조화적 패턴을 식별할 수 있습니다. 이러한 패턴은 Scott Carney의 "Harmonic Trading vol 1 및 2"에서 설명한 것처럼 조화적 거래 이론을 연습하는 트레이더에게 중요합니다. 수동으로 그리든 자동 감지를 사용하든 ON Trade Waves Patterns가 도움을 줄 것입니다. 컨트롤 패널: 이 지표에는 사용자 친화적인 컨트롤 패널이 있습니다. 차트 및 시간 프레임 설정을 저장하여 다양한 구성 간에 쉽게 전환할 수 있습니다. 차트 공간을 최대화하려면 최소화할 수도 있습니다. 다른 분석 도구를 사용하는 것을 선호하는 경우 닫기 버튼을 클릭하여 모든 지표 데이터를 숨길 수 있습니다. 템플릿 저장: 설정을 사
Trend Screener
STE S.S.COMPANY
4.83 (86)
트렌드 표시기, 트렌드 트레이딩 및 필터링을 위한 획기적인 고유 솔루션, 하나의 도구 안에 내장된 모든 중요한 트렌드 기능! Forex, 상품, 암호 화폐, 지수 및 주식과 같은 모든 기호/도구에 사용할 수 있는 100% 다시 칠하지 않는 다중 시간 프레임 및 다중 통화 표시기입니다. Trend Screener는 차트에 점이 있는 화살표 추세 신호를 제공하는 효율적인 지표 추세 추종 지표입니다. 추세 분석기 표시기에서 사용할 수 있는 기능: 1. 트렌드 스캐너. 2. 최대 이익 분석이 있는 추세선. 3. 추세 통화 강도 측정기. 4. 경고가 있는 추세 반전 점. 5. 경고가 있는 강력한 추세 점. 6. 추세 화살표 Trend Screener Indicator가 있는 일일 분석 예, 일일 신호 성능...등은 여기에서 찾을 수 있습니다.   여기를 클릭하십시오. LIMITED TIME OFFER : Trend Screener Indicator는 50 $ 및 평생 동안만 사용할 수 있
TPSproTREND PrO
Roman Podpora
5 (15)
TPSpro TRENDPRO  - is a trend indicator that automatically analyzes the market and provides information about the trend and each of its changes, as well as giving signals for entering trades without redrawing! The indicator uses each candle, analyzing them separately. referring to different impulses - up or down impulse. Exact entry points into transactions for currencies, crypto, metals, stocks, indices!  -  Version MT5               DETAILED DESCRIPTION        /       TRADING SETUPS           
Scalper Vault
Oleg Rodin
5 (28)
Scalper Vault 는 성공적인 스캘핑에 필요한 모든 것을 제공하는 전문 스캘핑 시스템입니다. 이 표시기는 외환 및 바이너리 옵션 거래자가 사용할 수 있는 완전한 거래 시스템입니다. 권장 시간 프레임은 M5입니다. 시스템은 추세 방향으로 정확한 화살표 신호를 제공합니다. 또한 상단 및 하단 신호와 Gann 시장 수준을 제공합니다.  이 시스템은 사용하기가 매우 쉽습니다. 원하는 시장 지역의 화살표만 따라가면 됩니다. 엑시트는 가격이 적정 수준에 도달하거나 시장의 고점 또는 저점 신호가 나타날 때 수행됩니다.  표시기는 PUSH 알림을 포함한 모든 유형의 경고를 제공합니다. 인디케이터 구매 후 연락주세요. 내 개인 거래 권장 사항과 훌륭한 보너스 지표를 무료로 공유합니다! 나는 당신에게 행복하고 유익한 거래를 기원합니다!
Advanced Currency IMPULSE with ALERT
Bernhard Schweigert
4.91 (494)
현재 31% 할인!! 초보자 또는 전문가 트레이더를 위한 최고의 솔루션! 이 지표는 우리가 독점 기능과 비밀 공식을 통합했기 때문에 독특하고 고품질이며 저렴한 거래 도구입니다. 단 하나의 차트로 28개 통화 쌍 모두에 대한 경고를 제공합니다. 새로운 추세 또는 스캘핑 기회의 정확한 트리거 포인트를 정확히 찾아낼 수 있기 때문에 거래가 어떻게 개선될지 상상해 보십시오! 새로운 기본 알고리즘을 기반으로 구축되어 잠재적인 거래를 훨씬 더 쉽게 식별하고 확인할 수 있습니다. 이는 통화의 강세 또는 약세가 가속되는지 여부를 그래픽으로 표시하고 가속 속도를 측정하기 때문입니다. 자동차의 속도계처럼 생각하면 됩니다. 가속화할 때 Forex 시장에서 동일한 일이 분명히 더 빠르게 발생합니다. 즉, 반대 방향으로 가속화되는 통화를 페어링하면 잠재적으로 수익성 있는 거래를 식별한 것입니다. 통화 모멘텀의 수직선과 화살표가 거래를 안내합니다! 역동적인 Market Fibonacci 23
Currency Strength Wizard
Oleg Rodin
4.91 (44)
통화 강도 마법사는 성공적인 거래를 위한 올인원 솔루션을 제공하는 매우 강력한 지표입니다. 표시기는 여러 시간 프레임의 모든 통화 데이터를 사용하여 이 또는 해당 외환 쌍의 힘을 계산합니다. 이 데이터는 특정 통화의 힘을 확인하는 데 사용할 수 있는 사용하기 쉬운 통화 지수 및 통화 전력선의 형태로 표시됩니다. 필요한 것은 거래하려는 차트에 표시기를 부착하는 것뿐입니다. 표시기는 거래하는 통화의 실제 강세를 보여줍니다. 지표는 또한 추세와 거래할 때 유리하게 사용할 수 있는 구매 및 판매 거래량 압력의 극한값을 보여줍니다. 지표는 또한 피보나치에 기반한 가능한 대상을 보여줍니다. 표시기는 PUSH 알림을 포함한 모든 유형의 알림을 제공합니다. 구매 후 연락주세요. 나는 당신과 거래 팁을 공유하고 당신에게 무료로 훌륭한 보너스 지표를 줄 것입니다! 나는 당신에게 행복하고 유익한 거래를 기원합니다!
The BB Reversal Arrows technical trading system has been developed to predict reverse points for making retail decisions. The current market situation is analyzed by the indicator and structured for several criteria: the expectation of reversal moments, potential turning points, purchase and sale signals. The indicator does not contain excess information, has a visual understandable interface, allowing traders to make reasonable decisions. All arrows appear to close the candle, without redr
Market Reversal Alerts
LEE SAMSON
4.21 (121)
가격이 역전되고 후퇴함에 따라 시장 구조가 변경됩니다. 시장 구조 반전 경고 표시기는 추세 또는 가격 움직임이 고갈에 가까워지고 반전할 준비가 되었음을 식별합니다. 일반적으로 반전이나 큰 하락이 일어나려고 할 때 발생하는 시장 구조의 변화를 알려줍니다. 지표는 가능한 고갈 지점 근처에서 새로운 고점 또는 저점이 형성될 때마다 초기에 돌파와 가격 모멘텀을 식별합니다. 표시기는 반대쪽에 있는 마지막 촛불에 직사각형을 그립니다. 그런 다음 현재의 단기 추세에서 계속 움직이기 때문에 가격과 함께 직사각형을 따라갈 것입니다. 가격이 사각형 위나 아래로 다시 닫힐 정도로 약해지면 시장 구조에 잠재적인 변화가 일어나고 있음을 나타냅니다. 그런 다음 표시기는 방향의 잠재적인 이동과 추세 또는 주요 하락의 가능한 반전 시작에 대해 경고합니다. 작동 방식을 보려면 아래의 작동 표시기를 참조하십시오! 여기에서 모든 쌍 및 기간을 모니터링하기 위한 선택적 대시보드 추가 기능: https://
Up down v6T
Guner Koca
5 (1)
Thise indicator is up down v6  comes with tradingwiev pinescript. purchased people, after installed on terminal ,contact me on mql5  to get BONUS  TradingView pinescript. up-down indicator is no repaint and works all pairs and lower than weekly time frames charts. it is suitable also 1 m charts for all pairs. and hold long way to signal. dont gives too many signals. when red histogram cross trigger line that is up signal.and price probably will down when blue histogram cross trigger line that
Entry Points Pro
Yury Orlov
4.7 (225)
다시 색을 칠하지 않고 거래에 진입할 수 있는 정확한 신호를 제공하는 MT4용 지표입니다. 외환, 암호화폐, 금속, 주식, 지수 등 모든 금융 자산에 적용할 수 있습니다. 매우 정확한 추정값을 제공하고 매수와 매도의 가장 좋은 시점을 알려줍니다. 하나의 시그널로 수익을 내는 지표의 예와 함께 비디오 (6:22)시청하십시오! 대부분의 거래자는 Entry Points Pro 지표의 도움으로 첫 거래 주 동안 트레이딩 결과를 개선합니다. 저희의   Telegram Group 을 구독하세요! Entry Points Pro 지표의 좋은점. 재도색이 없는 진입 신호 신호가 나타나고 확인되면(시그널 캔들이 완성된 경우) 신호는 더 이상 사라지지 않습니다. 여타 보조지표의 경우 신호를 표시한 다음 제거되기 때문에 큰 재정적 손실로 이어집니다. 오류 없는 거래 게시 알고리즘을 통해 트레이드(진입 또는 청산)를 할 이상적인 순간을 찾을 수 있으며, 이를 통해 이를 사용하는 모든 거래자의
현재 20% 할인 ! 초보자 또는 전문가 트레이더를 위한 최고의 솔루션! 이 대시보드 소프트웨어는 28개의 통화 쌍에서 작동합니다. 2가지 주요 지표(Advanced Currency Strength 28 및 Advanced Currency Impulse)를 기반으로 합니다. 전체 Forex 시장에 대한 훌륭한 개요를 제공합니다. 고급 통화 강도 값, 통화 이동 속도 및 모든(9) 시간대의 28 Forex 쌍에 대한 신호를 보여줍니다. 추세 및/또는 스캘핑 기회를 정확히 파악하기 위해 차트의 단일 지표를 사용하여 전체 시장을 볼 수 있을 때 거래가 어떻게 개선될지 상상해 보십시오! 잠재적인 거래를 식별하고 확인하면서 강력한 통화와 약한 통화를 더욱 쉽게 식별할 수 있도록 이 지표에 기능을 내장했습니다. 이 표시기는 통화의 강세 또는 약세가 증가 또는 감소하는지 여부와 모든 시간대에서 수행되는 방식을 그래픽으로 보여줍니다. 추가된 새로운 기능은 현재 시장 조건 변화에 적
Symbols must be separated by commas (,) and entered into the parameters exactly as displayed by your broker to ensure they are recognized in the dashboard. These symbols will be used for analysis by the indicator. With one click open any pair any timeframe directly from dashboard The MA Speedometer Dashboard is a highly functional MetaTrader 4 (MT4) indicator designed to enhance trading strategies through dynamic market analysis. It offers robust features for identifying market trends, trading
TrendMaestro
Stefano Frisetti
5 (2)
note: this indicator is for METATRADER4, if you want the version for METATRADER5 this is the link:  https://www.mql5.com/it/market/product/108106 TRENDMAESTRO ver 2.4 TRENDMAESTRO recognizes a new TREND in the bud, he never makes mistakes. The certainty of identifying a new TREND is priceless. DESCRIPTION TRENDMAESTRO identifies a new TREND in the bud, this indicator examines the volatility, volumes and momentum to identify the moment in which there is an explosion of one or more of these data a
FX Power MT4 NG
Daniel Stein
5 (9)
모닝 브리핑 여기 mql5 와 텔레그램에서 FX Power MT4 NG 는 오랫동안 인기 있는 통화 강도 측정기인 FX Power의 차세대 버전입니다. 이 차세대 강도 측정기는 무엇을 제공합니까? 기존 FX Power에서 좋아했던 모든 것 PLUS GOLD/XAU 강도 분석 더욱 정밀한 계산 결과 개별 구성 가능한 분석 기간 더 나은 성능을 위한 사용자 정의 가능한 계산 한도 특별 멀티더 많은 것을보고 싶은 사람들을위한 특별한 다중 인스턴스 설정 모든 차트에서 좋아하는 색상을위한 끝없는 그래픽 설정 수많은 알림 옵션, 중요한 것을 다시는 놓치지 않도록 Windows 11 및 macOS 스타일의 둥근 모서리가 있는 새로운 디자인 마법처럼 움직이는 인디케이터 패널 FX 파워 키 특징 모든 주요 통화의 완전한 강세 이력 모든 시간대에 걸친 통화 강세 이력 모든 브로커 및 차트에서 고유 계산 결과 100% 신뢰할 수있는 실시간100 % 신뢰할 수있는 실시간 계산-> 다시 칠하지 않음
IX Power MT4
Daniel Stein
5 (5)
IX Power는 마침내 FX Power의 탁월한 정밀도를 외환이 아닌 기호에도 적용했습니다. 좋아하는 지수, 주식, 원자재, ETF, 심지어 암호화폐까지 단기, 중기, 장기 추세의 강도를 정확하게 파악할 수 있습니다. 단말기가 제공하는 모든 것을 분석할 수 있습니다. 사용해 보고 트레이딩 타이밍이 크게 향상되는 것을 경험해 보세요. IX Power 주요 특징 단말기에서 사용 가능한 모든 거래 심볼에 대해 100% 정확한 비재도장 계산 결과 제공 사전 구성 및 추가적으로 개별 구성 가능한 강도 분석 기간의 드롭다운 선택 가능 이메일, 메시지, 모바일 알림을 통한 다양한 알림 옵션 제공 EA 요청을 위한 액세스 가능한 버퍼 더 나은 성능을 위한 사용자 지정 가능한 계산 한도 더 많은 것을 보고 싶은 사용자를 위한 특별 다중 인스턴스 설정 모든 차트에서 좋아하는 색상을 위한 무한한 그래픽 설정 가능 Windows 11 및 macOS 스타일의 둥근 모서리를 가
77% discount for the next 10 buyers (original price $605): 1 left 3 Indicators in 1 indicator Strategy based on price action Made specifically for the best forex currency pairs Can be used in the best time frame of the market at a very reasonable price This indicator is basically 3 different indicatos . But we have combined these 3 indicators in 1 indicator so that you can use 3 indicators at the lowest price. All three strategies are based on price action. But based on different trends.
Trend Forecasting
Mohamed Hassan
5 (20)
This indicator is unstoppable when combined with our other indicator called Katana. After purchase, send us a message and you could get Katana for FREE as a BONUS After purchase, send us a private message for your instructions.  MT5 version: click here 3 copies left available at $45. Next price is $95. Don't miss this great deal!  The Trend Forecasting indicator is a very unique & easy tool that is able to make prediction about future price movement based on the signals generated
Quantum Breakout Indicator PRO
Bogdan Ion Puscasu
4.96 (26)
소개       Quantum Breakout PRO   , 브레이크아웃 존 거래 방식을 변화시키는 획기적인 MQL5 지표! 13년 이상의 거래 경험을 가진 숙련된 트레이더 팀이 개발한   Quantum Breakout PRO는   혁신적이고 역동적인 브레이크아웃 영역 전략으로 거래 여정을 새로운 차원으로 끌어올리도록 설계되었습니다. Quantum Breakout Indicator는 5개의 이익 목표 영역이 있는 브레이크아웃 영역의 신호 화살표와 브레이크아웃 상자를 기반으로 한 손절 제안을 제공합니다. 초보자 거래자와 전문 거래자 모두에게 적합합니다. Quantum EA 채널:       여기를 클릭하세요 MT5 버전 :   여기를 클릭하세요 중요한! 구매 후 설치 매뉴얼을 받으려면 개인 메시지를 보내주십시오. 추천: 기간: M15 통화쌍: GBPJPY, EURJPY, USDJPY,NZDUSD, XAUUSD 계정 유형: 스프레드가 매우 낮은 ECN, Ra
Scalper Inside PRO
Alexey Minkov
4.75 (57)
An exclusive indicator that utilizes an innovative algorithm to swiftly and accurately determine the market trend. The indicator automatically calculates opening, closing, and profit levels, providing detailed trading statistics. With these features, you can choose the most appropriate trading instrument for the current market conditions. Additionally, you can easily integrate your own arrow indicators into Scalper Inside Pro to quickly evaluate their statistics and profitability. Scalper Inside
제작자의 제품 더 보기
Riverside
Ralph Debes
Bring the "sheep" into the dry. The blue channel represents the river. The "sheep" have to be brought into the dry over this river so that they can graze on the pasture. Whereby the "sheep" are the candles and the "grazing" are the profit. Entry for long trades is the high of the first candle, which closes completely above the channel. Reversed accordingly for shorts. Stop Loss as you please. It is best to be below the last low. Take Profit can either be set according to CRV, according
필터:
리뷰 없음
리뷰 답변