XM Channel
- 지표
- Kaijun Wang
- 버전: 3.0
- 업데이트됨: 6 3월 2023
- 활성화: 5
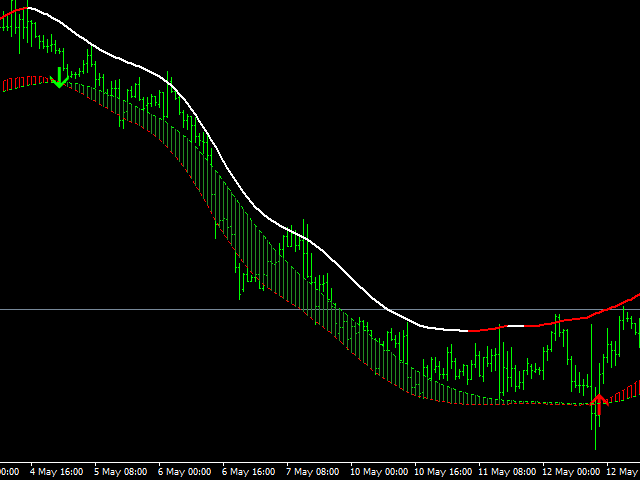
The market price usually falls between the borders of the channel .
If the price is out of range, it is a trading signal or trading opportunity .
Basically, Fit Channel can be used to help determine overbought and oversold conditions in the market. When the market price is close to the upper limit, the market is considered overbought (sell zone). Conversely, when the market price is close to the bottom range, the market is considered oversold (buy zone).
However, the research can be used to help determine the strength of price trends. The closing price of the price above the upper limit of channel trading is used as a buy signal, and the closing price of pushing the price lower and lower than the lower limit price is used as a selling signal.
The price channel will be constantly revised during operation, and the channel will serve as a reference for current trading decisions.


its looking very good so far but will keep an eye out for it in the future